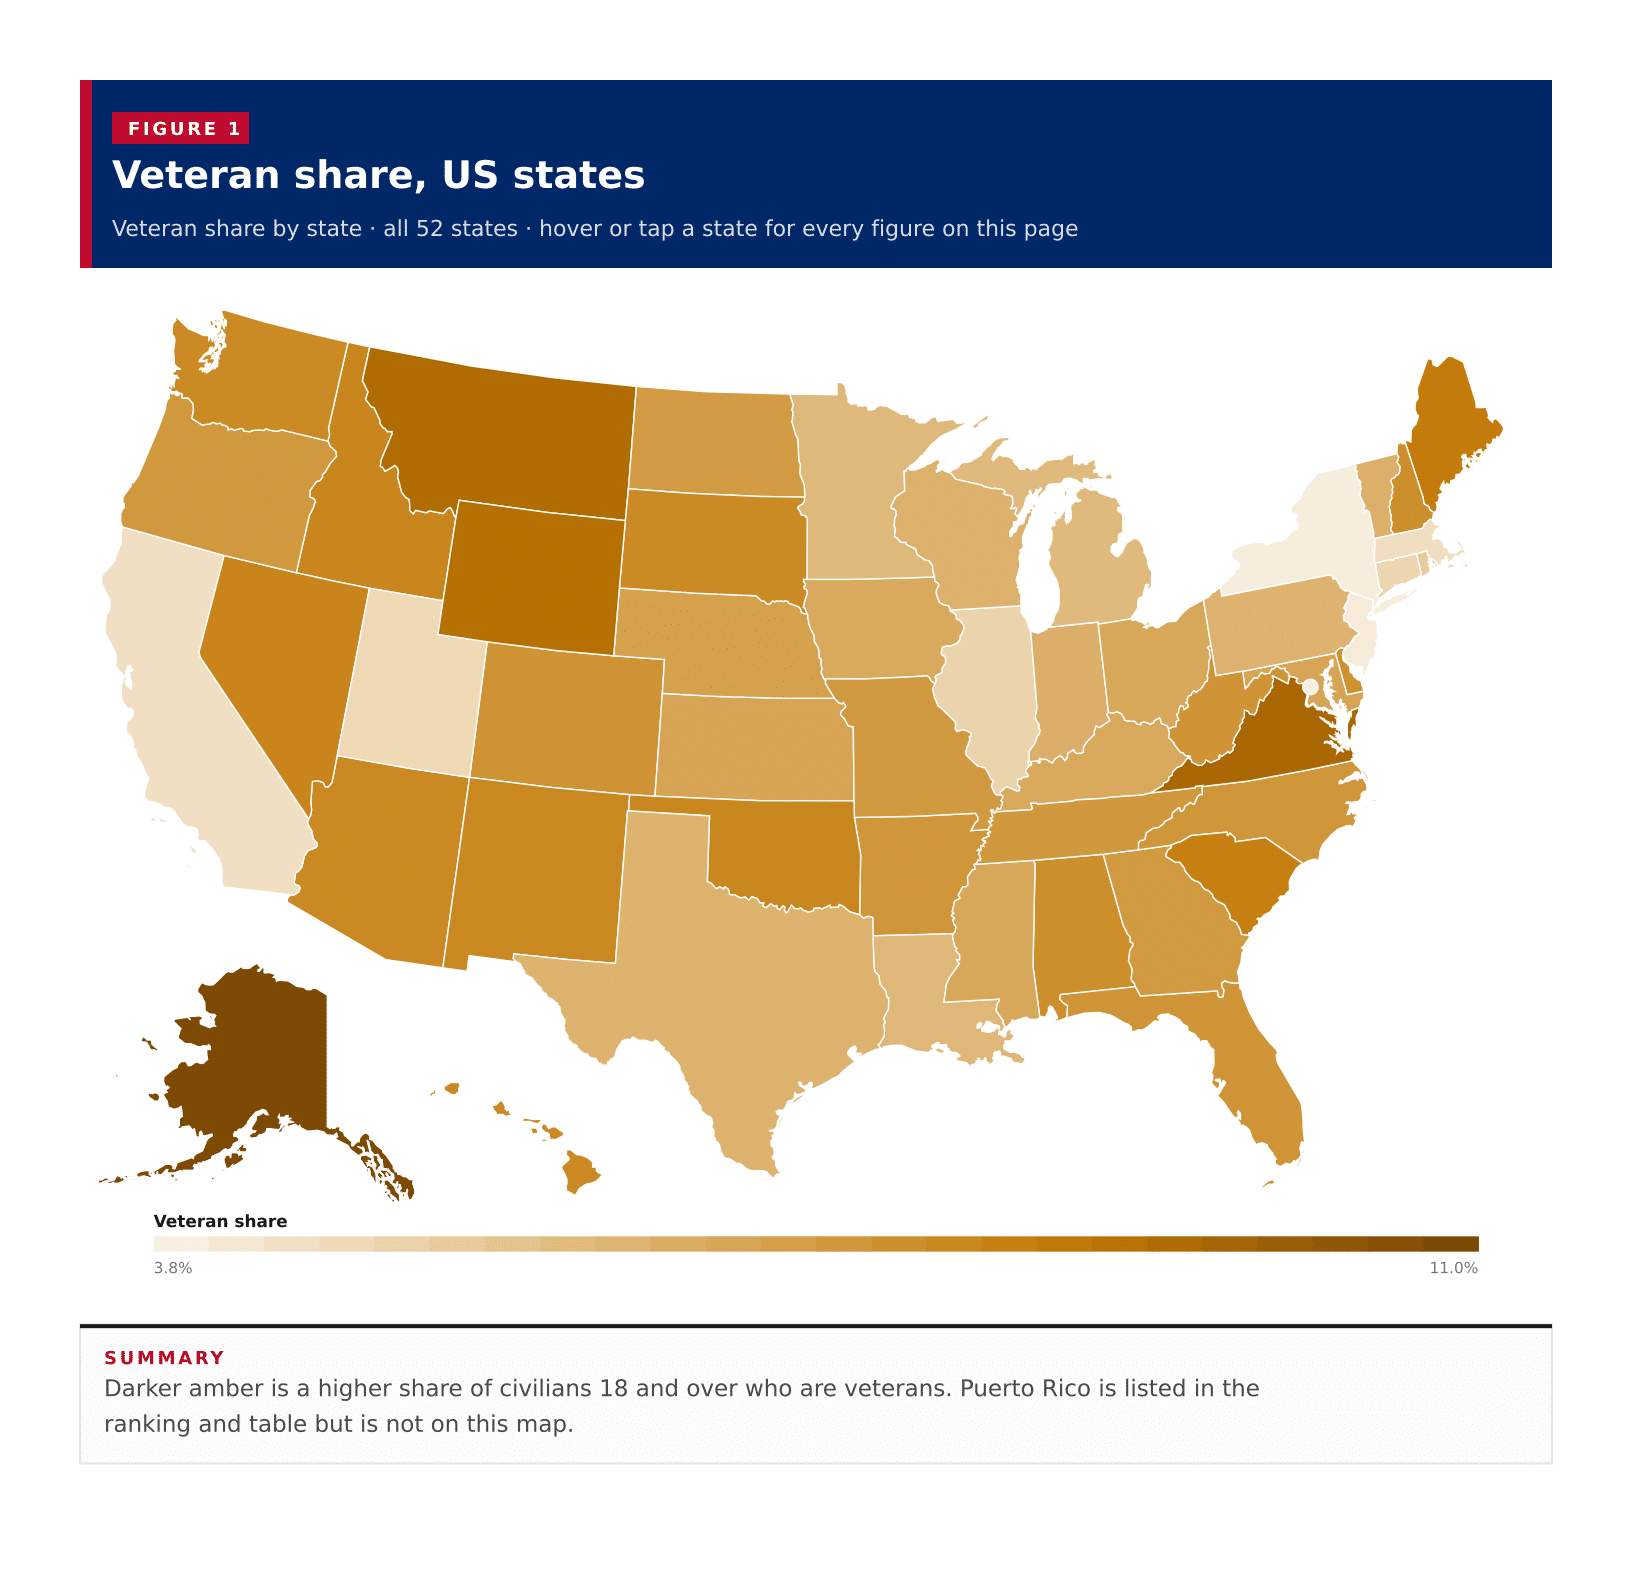
Darker amber is a higher share of civilians 18 and over who are veterans. Puerto Rico is listed in the ranking and table but is not on this map.
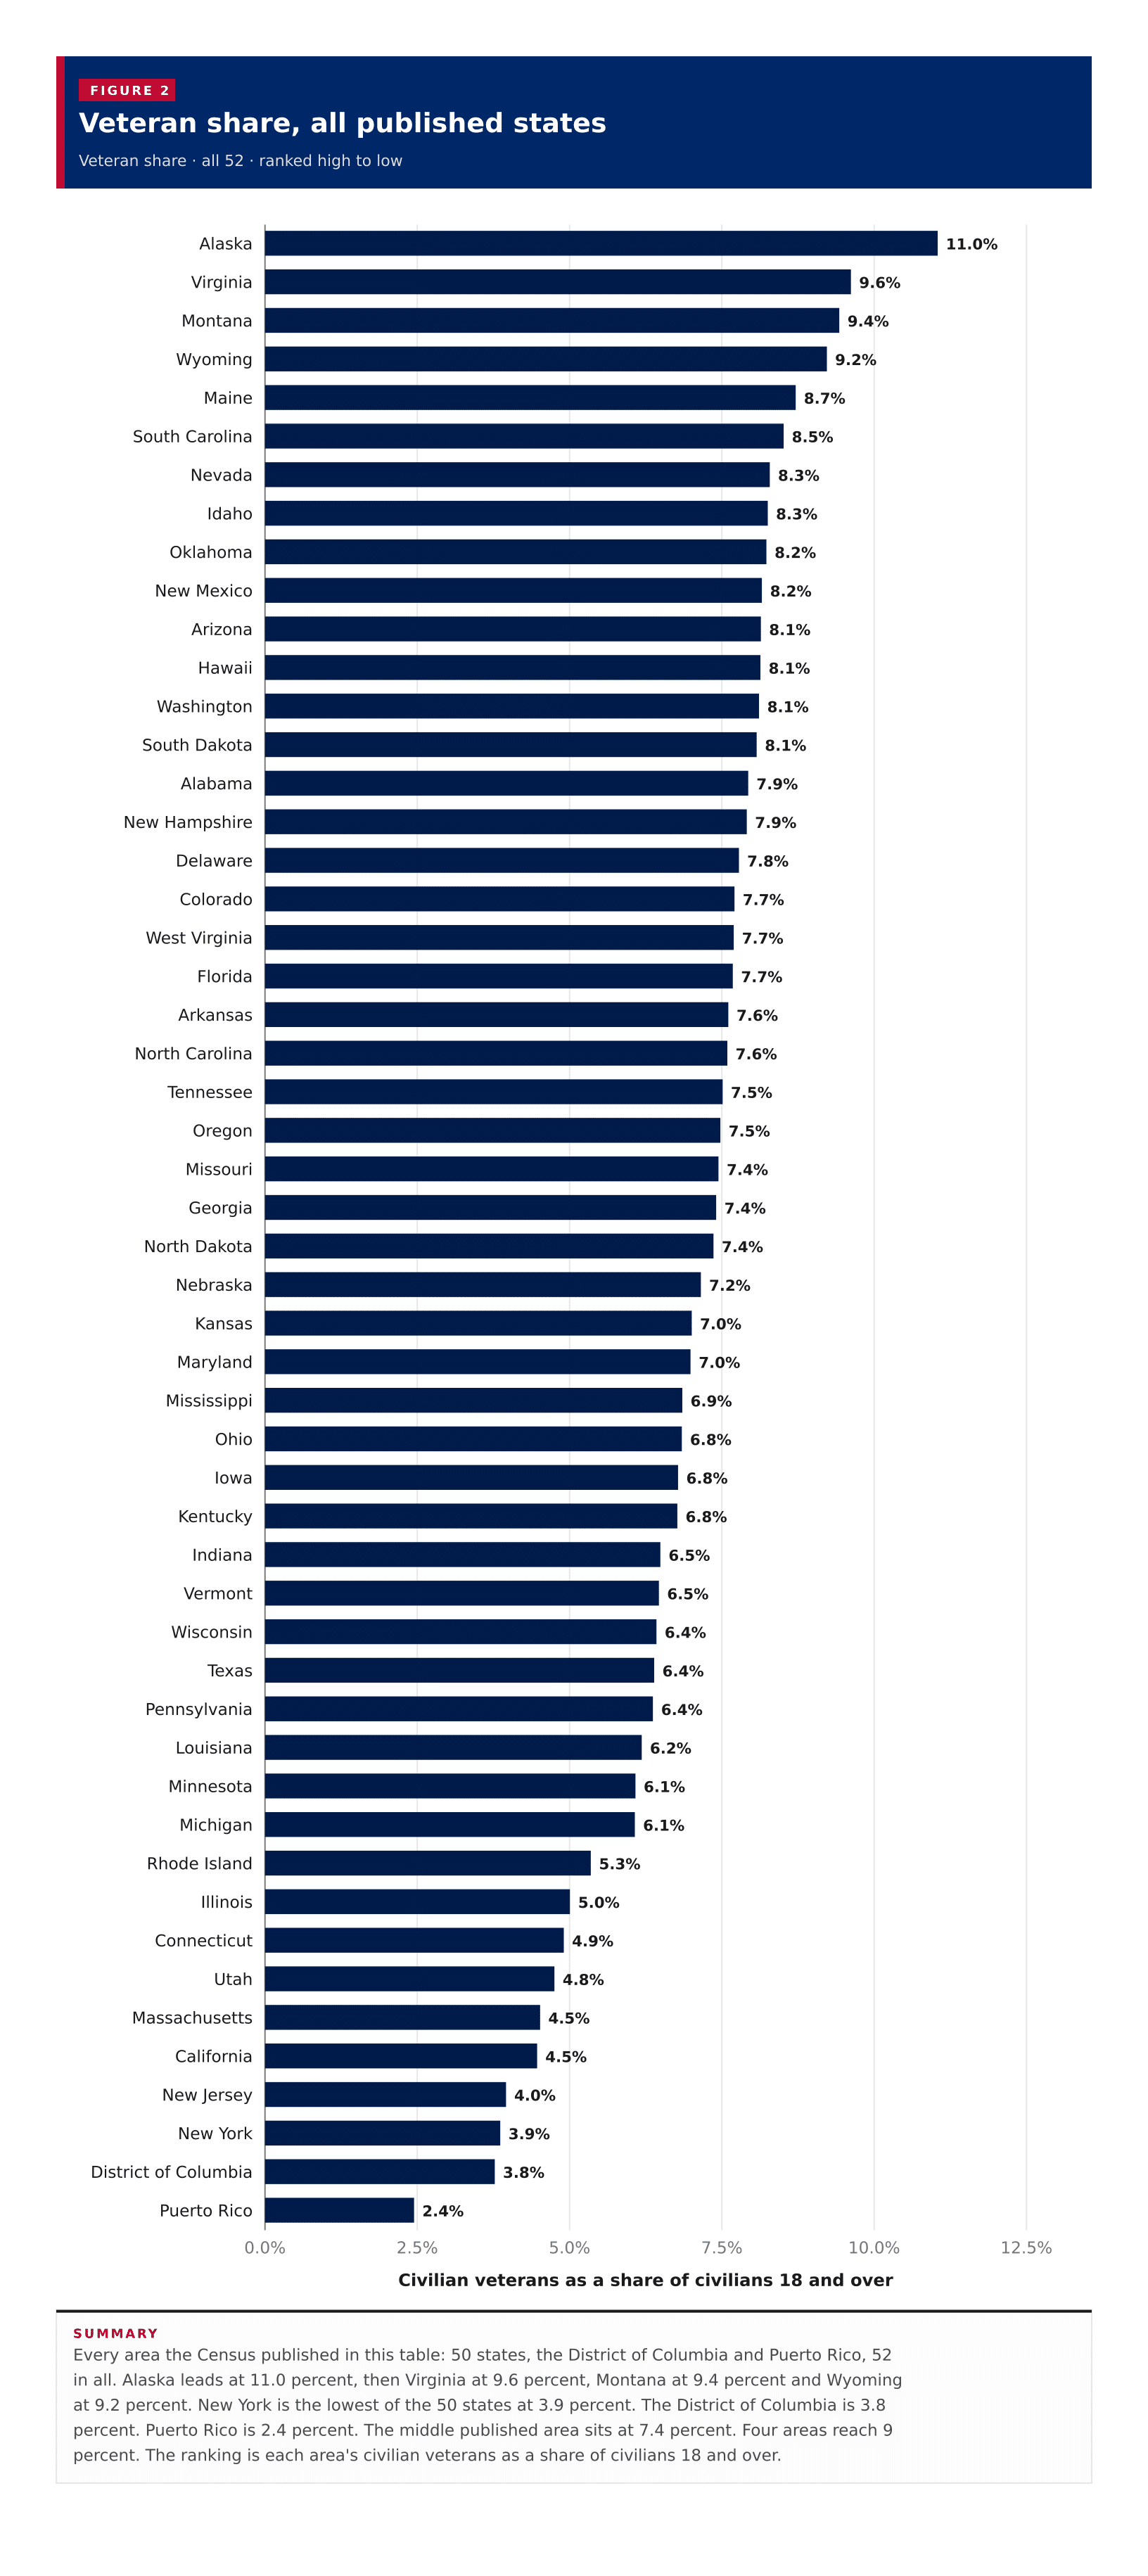
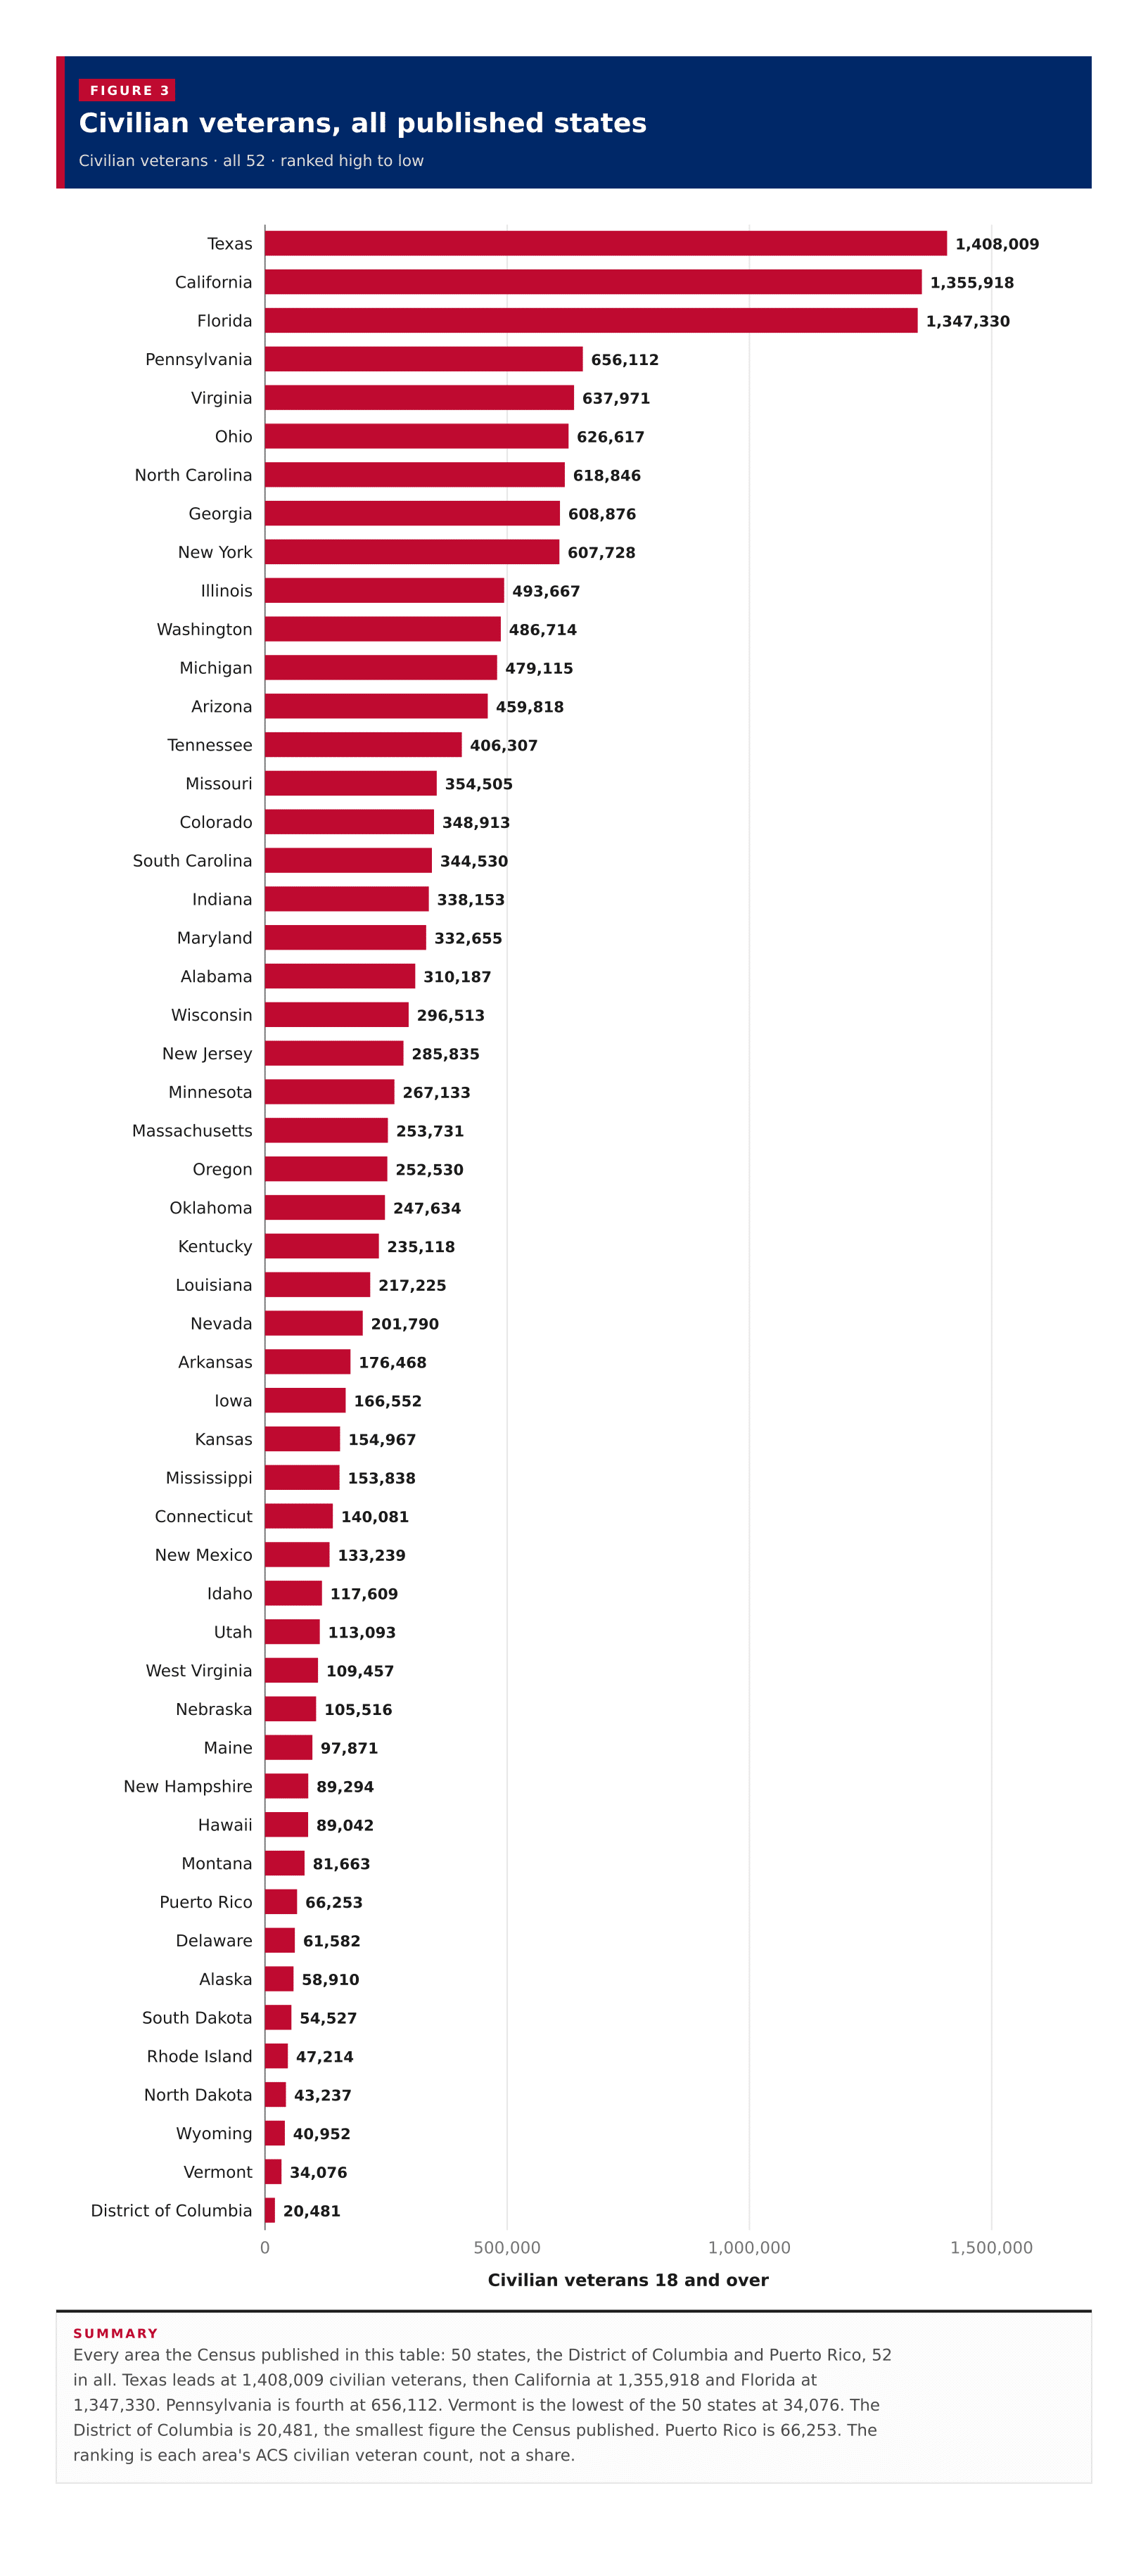
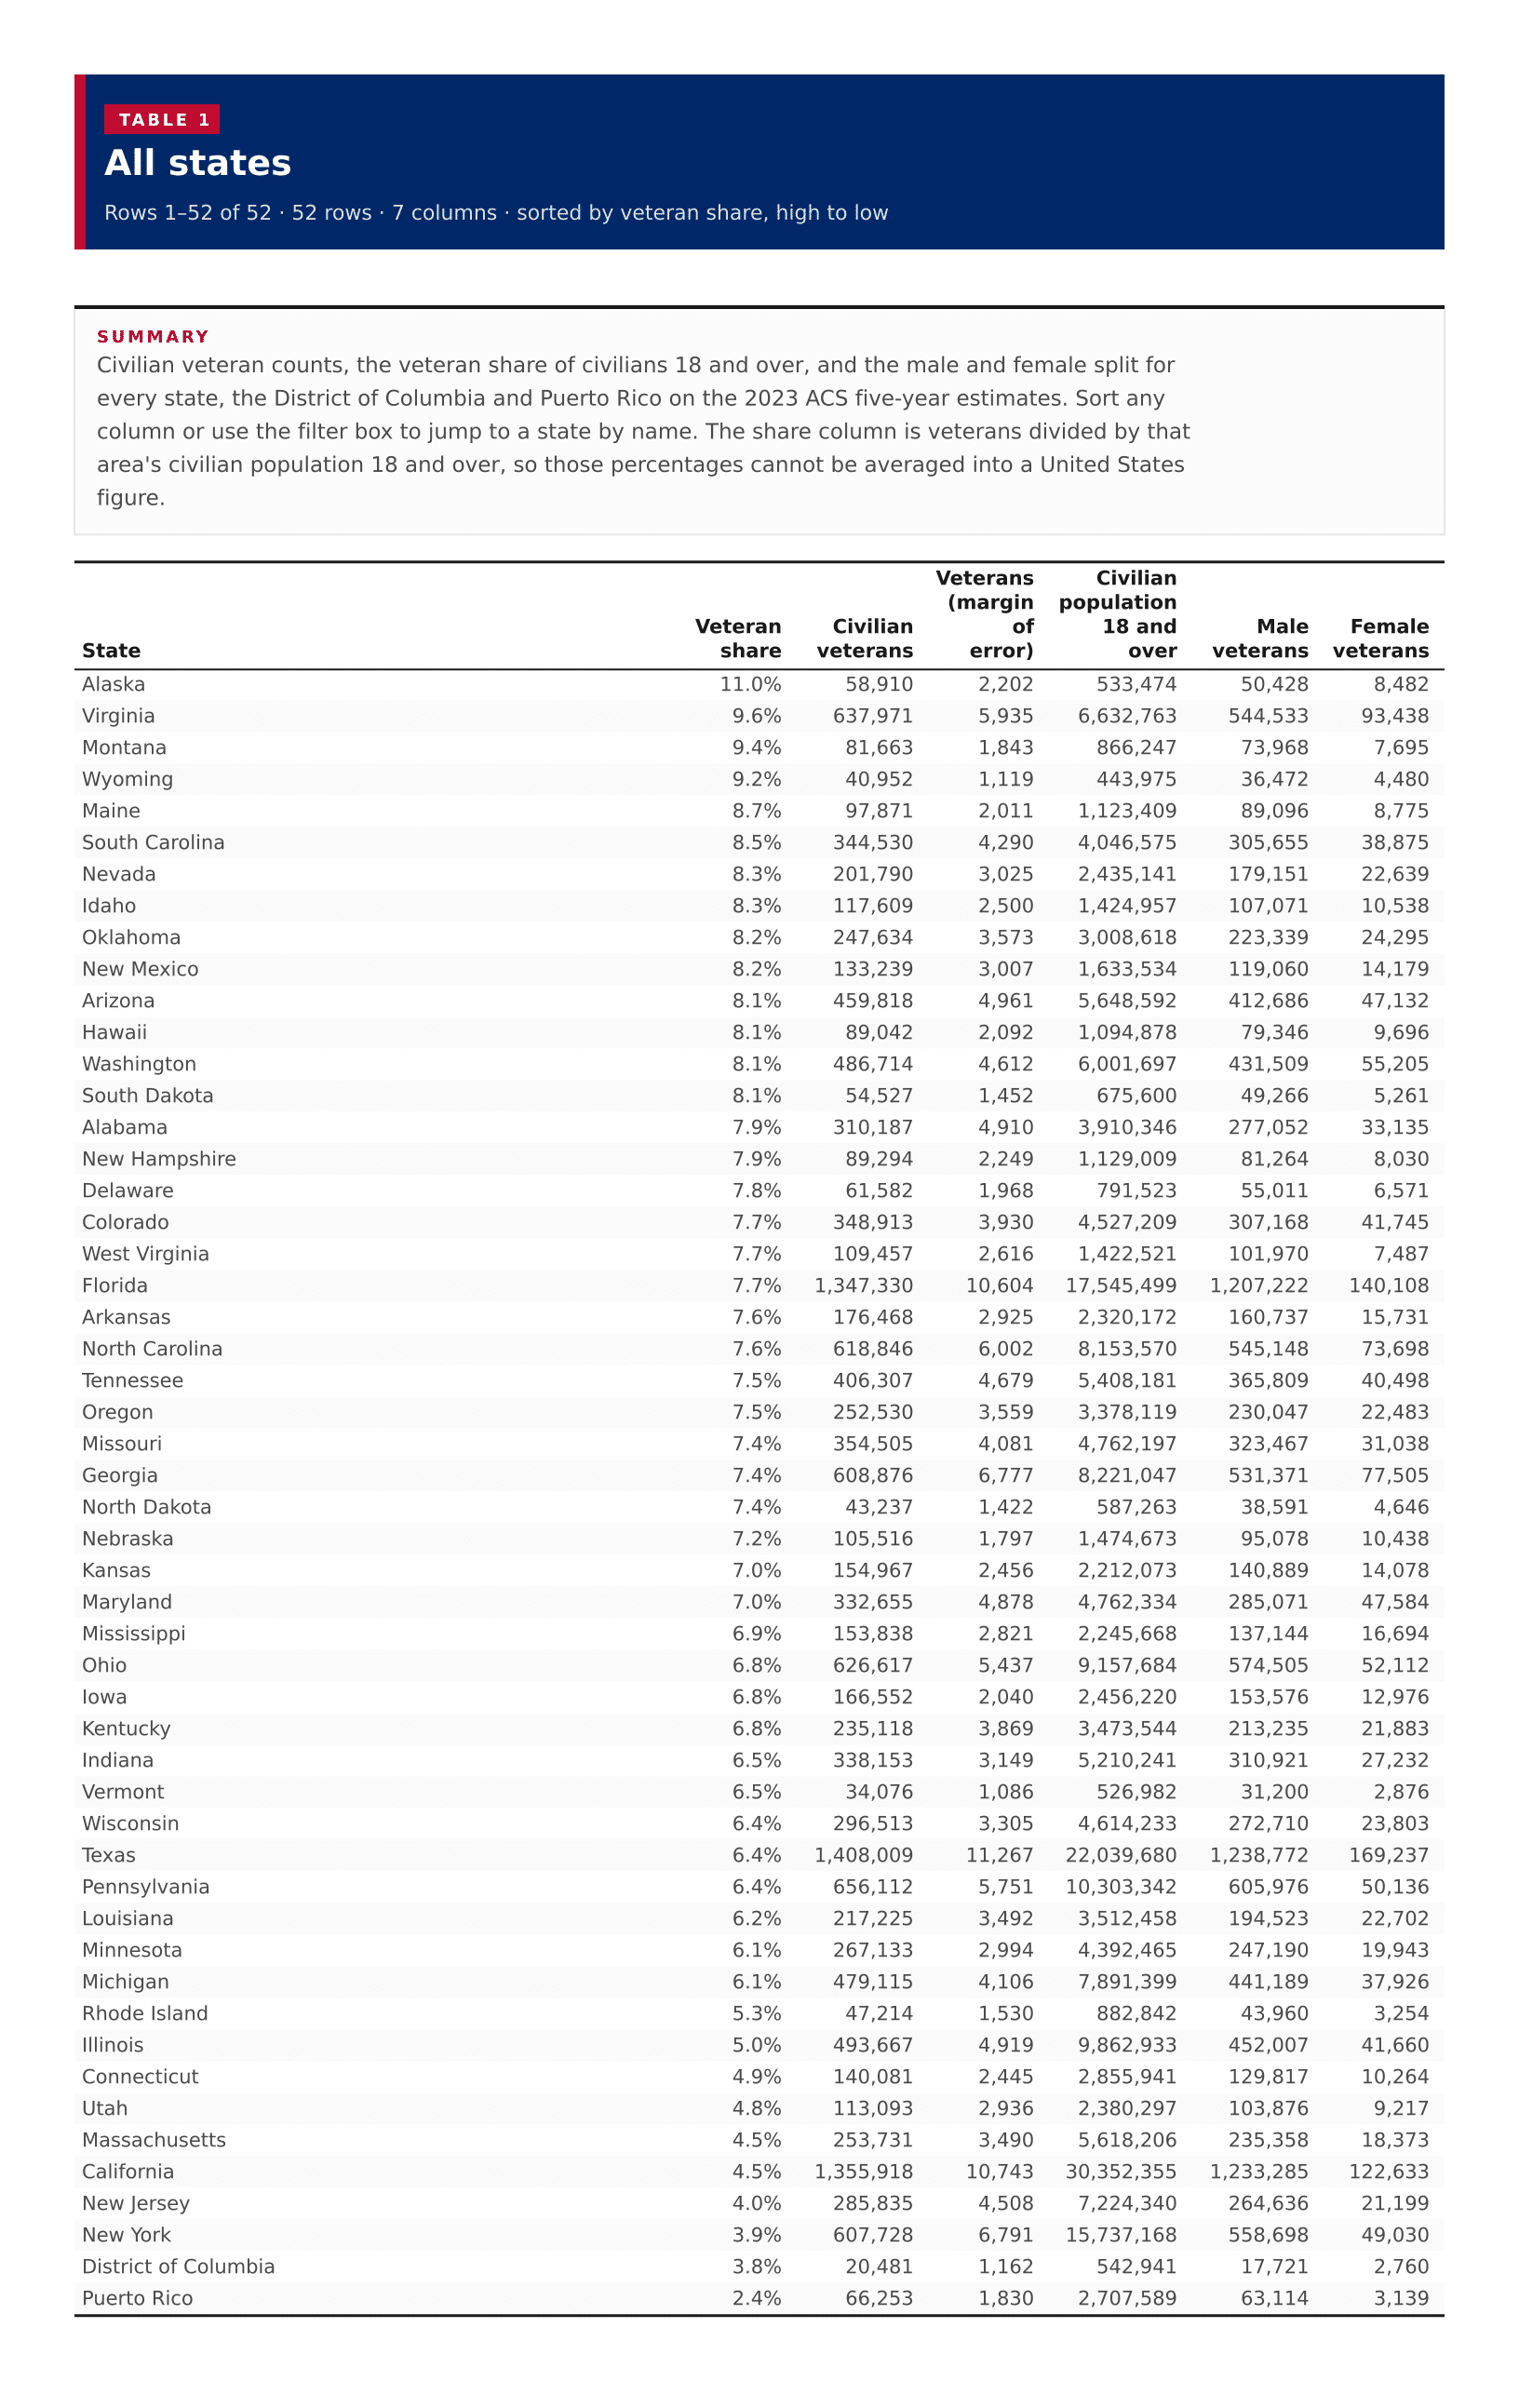
Alaska has the highest civilian veteran share among the 52 published areas on the 2023 ACS five-year estimates: 11.0 percent of civilians 18 and over. Virginia is next at 9.6 percent, then Montana at 9.4 percent and Wyoming at 9.2 percent. A typical published area sits at 7.4 percent, the midpoint of those 52 shares, not a national rate. New York is the lowest of the 50 states at 3.9 percent. The District of Columbia is 3.8 percent, and Puerto Rico, which this table also returns, is 2.4 percent. Texas has the largest veteran population, 1,408,009, just ahead of California at 1,355,918 and Florida at 1,347,330. These are ACS estimates of civilians who served on active duty, not a count of people now in uniform.
In short
11.0%Alaskahighest veteran share
7.4%typical published areathe middle of the 52 shares, not an average
Every area the Census published in this table: 50 states, the District of Columbia and Puerto Rico, 52 in all. Alaska leads at 11.0 percent, then Virginia at 9.6 percent, Montana at 9.4 percent and Wyoming at 9.2 percent. New York is the lowest of the 50 states at 3.9 percent. The District of Columbia is 3.8 percent. Puerto Rico is 2.4 percent. The middle published area sits at 7.4 percent. Four areas reach 9 percent. The ranking is each area's civilian veterans as a share of civilians 18 and over.
Every area the Census published in this table: 50 states, the District of Columbia and Puerto Rico, 52 in all. Texas leads at 1,408,009 civilian veterans, then California at 1,355,918 and Florida at 1,347,330. Pennsylvania is fourth at 656,112. Vermont is the lowest of the 50 states at 34,076. The District of Columbia is 20,481, the smallest figure the Census published. Puerto Rico is 66,253. The ranking is each area's ACS civilian veteran count, not a share.
Figure 3
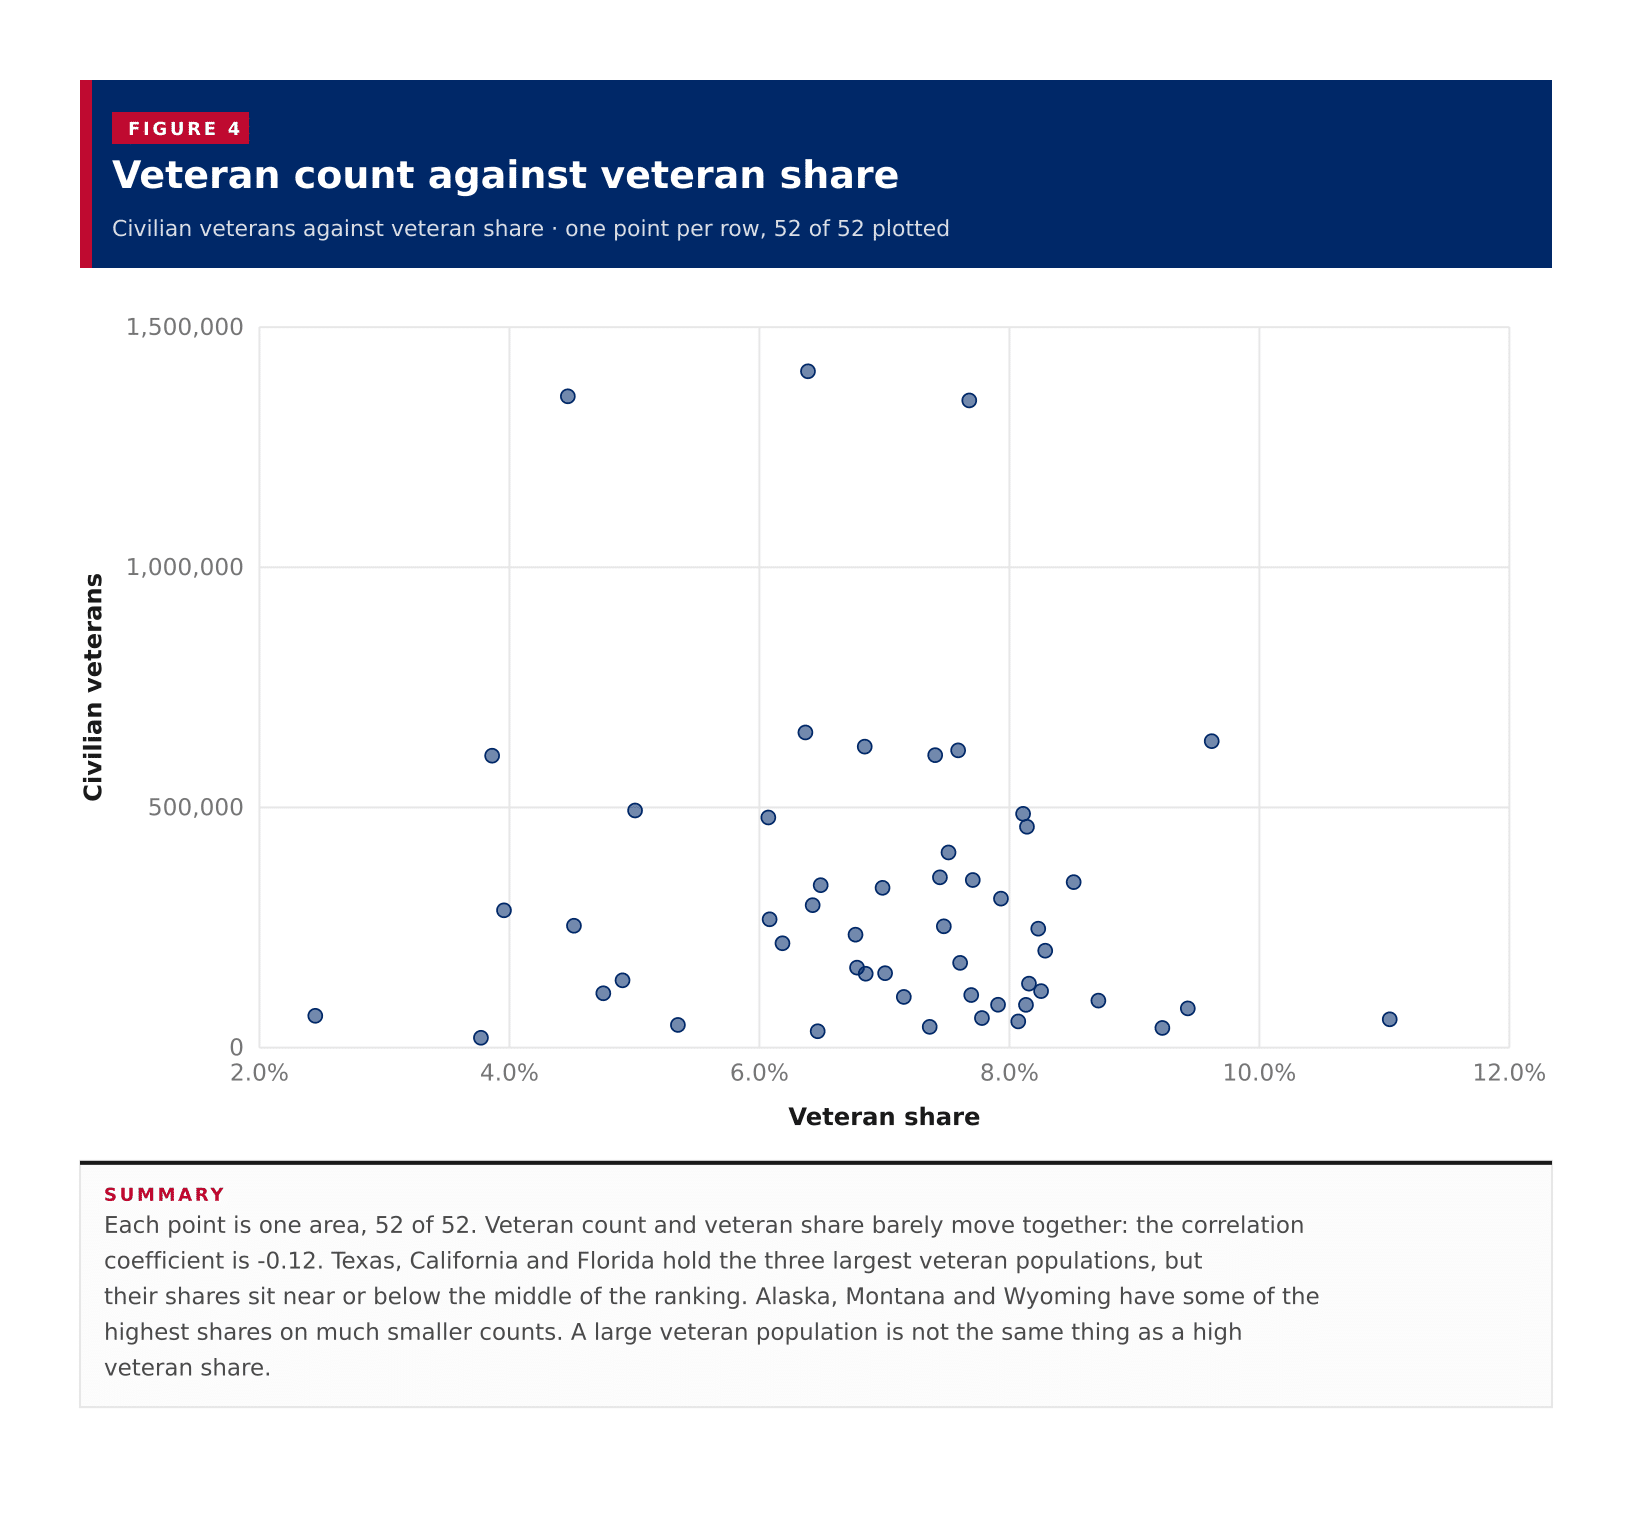
Veteran count against veteran share
Civilian veterans against veteran share · one point per row, 52 of 52 plotted
Each point is one area, 52 of 52. Veteran count and veteran share barely move together: the correlation coefficient is -0.12. Texas, California and Florida hold the three largest veteran populations, but their shares sit near or below the middle of the ranking. Alaska, Montana and Wyoming have some of the highest shares on much smaller counts. A large veteran population is not the same thing as a high veteran share.
Table 1
All states
52 rows · 7 columns · sorted by veteran share, high to low
Civilian veteran counts, the veteran share of civilians 18 and over, and the male and female split for every state, the District of Columbia and Puerto Rico on the 2023 ACS five-year estimates. Sort any column or use the filter box to jump to a state by name. The share column is veterans divided by that area's civilian population 18 and over, so those percentages cannot be averaged into a United States figure.
A civilian veteran is someone 18 or over who served on active duty in the U.S. Armed Forces, Reserves or National Guard and is not now on active duty. People currently in uniform are outside this universe.
Veteran share is civilian veterans divided by the civilian population 18 and over in that area. A state share is for that area alone, so these percentages cannot be averaged into a United States veteran rate.
Adding the 52 veteran counts does not produce an official national total. Puerto Rico is included here, and these are ACS period estimates rather than a Department of Veterans Affairs caseload.
The Census published 50 states, the District of Columbia and Puerto Rico. None of the veteran counts were suppressed, and the main margins of error are ordinary sampling errors rather than ACS controlled-estimate sentinels.
Puerto Rico is in the ranking and table. Alaska and Hawaii appear on the ranking; on the map they are shown in inset.
Male and female veteran columns are the ACS sex split of civilian veterans 18 and over in each area.