Figure 1
Non-Hispanic White share, US states
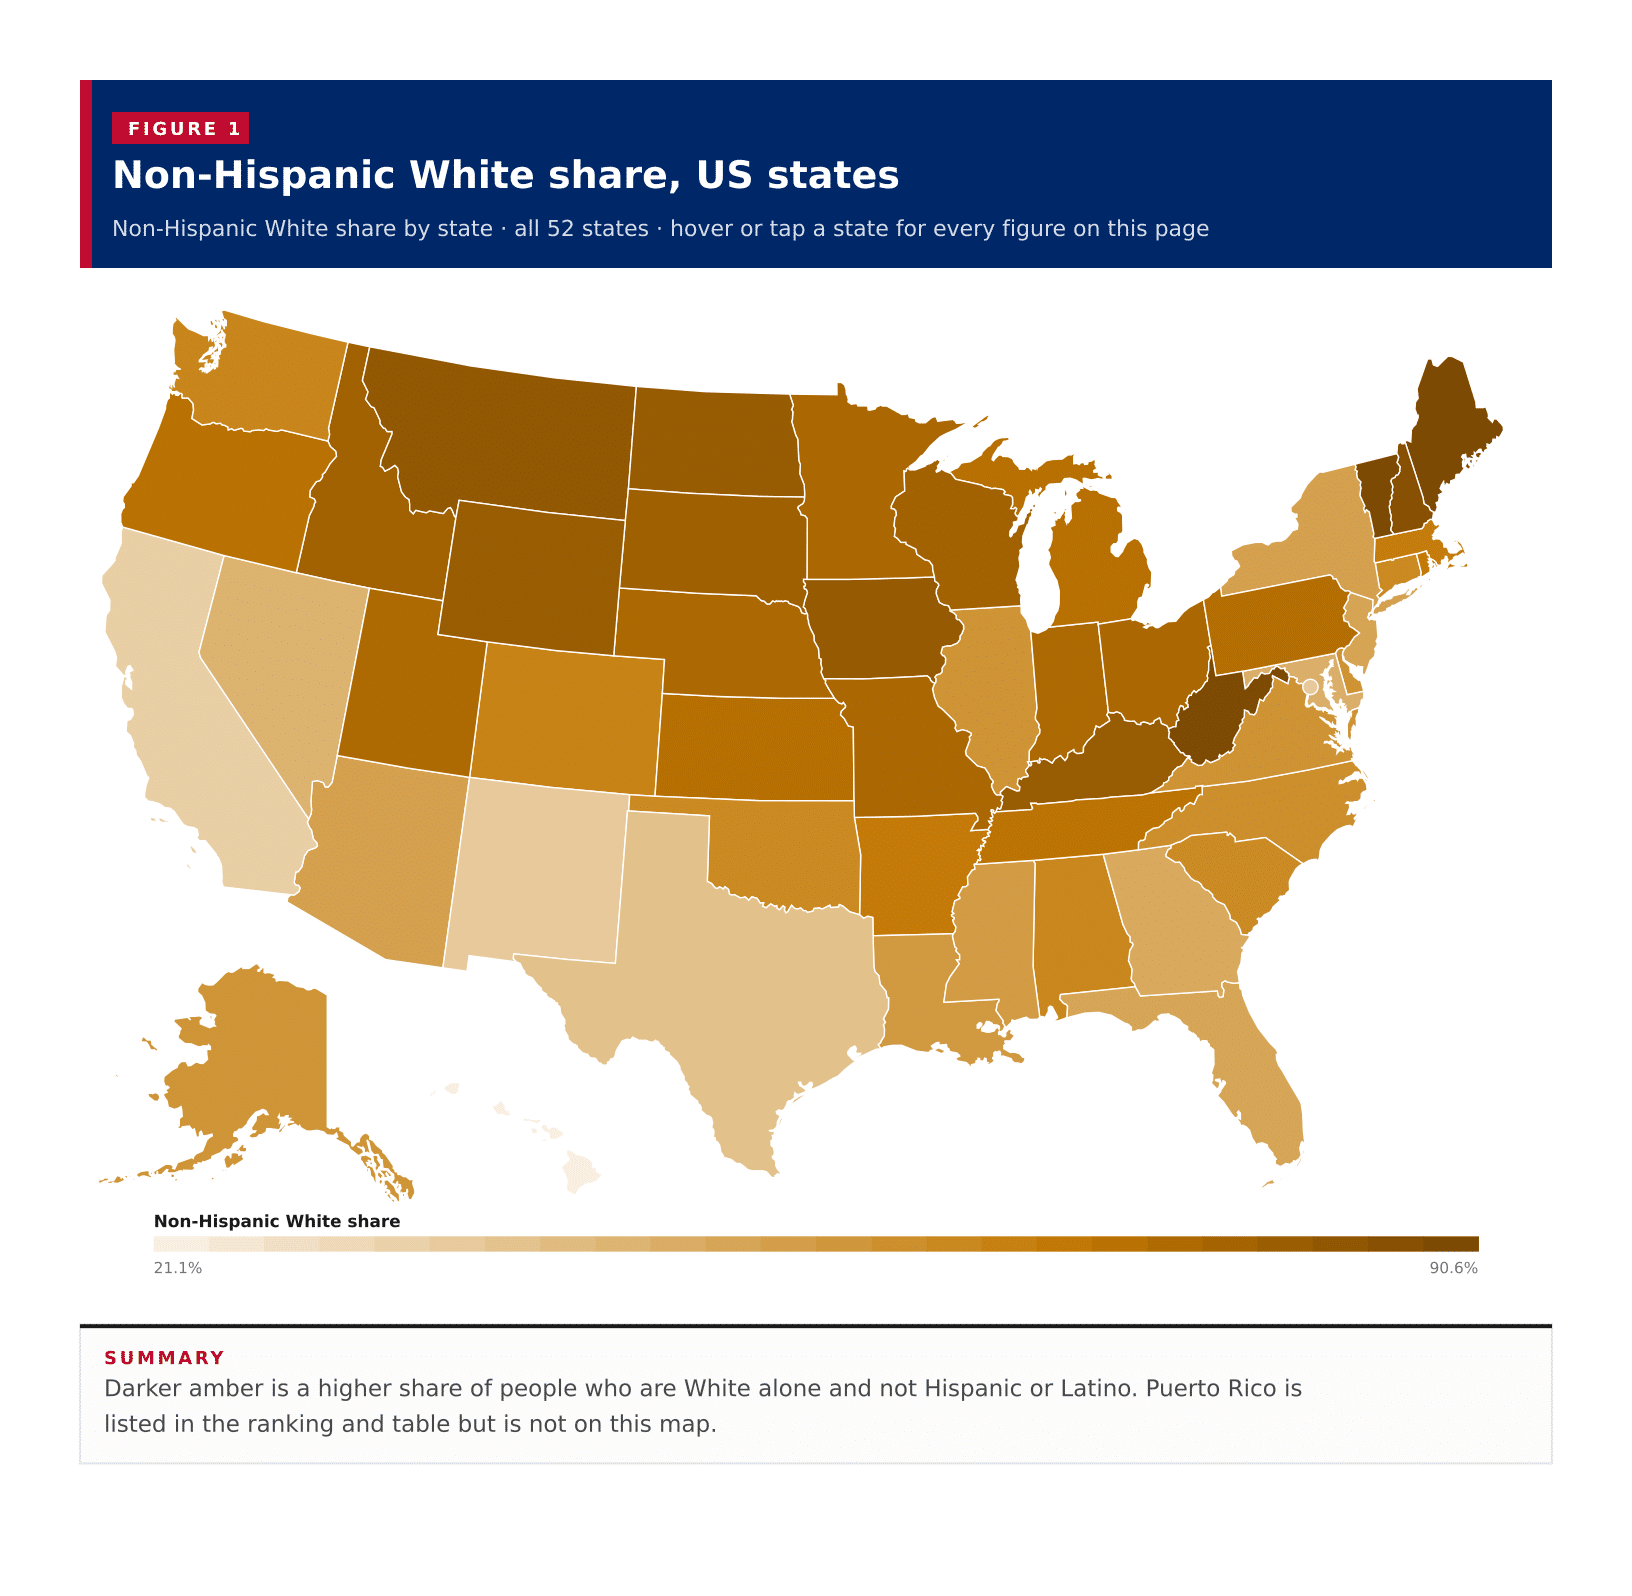
Non-Hispanic White share by state · all 52 states · hover or tap a state for every figure on this page
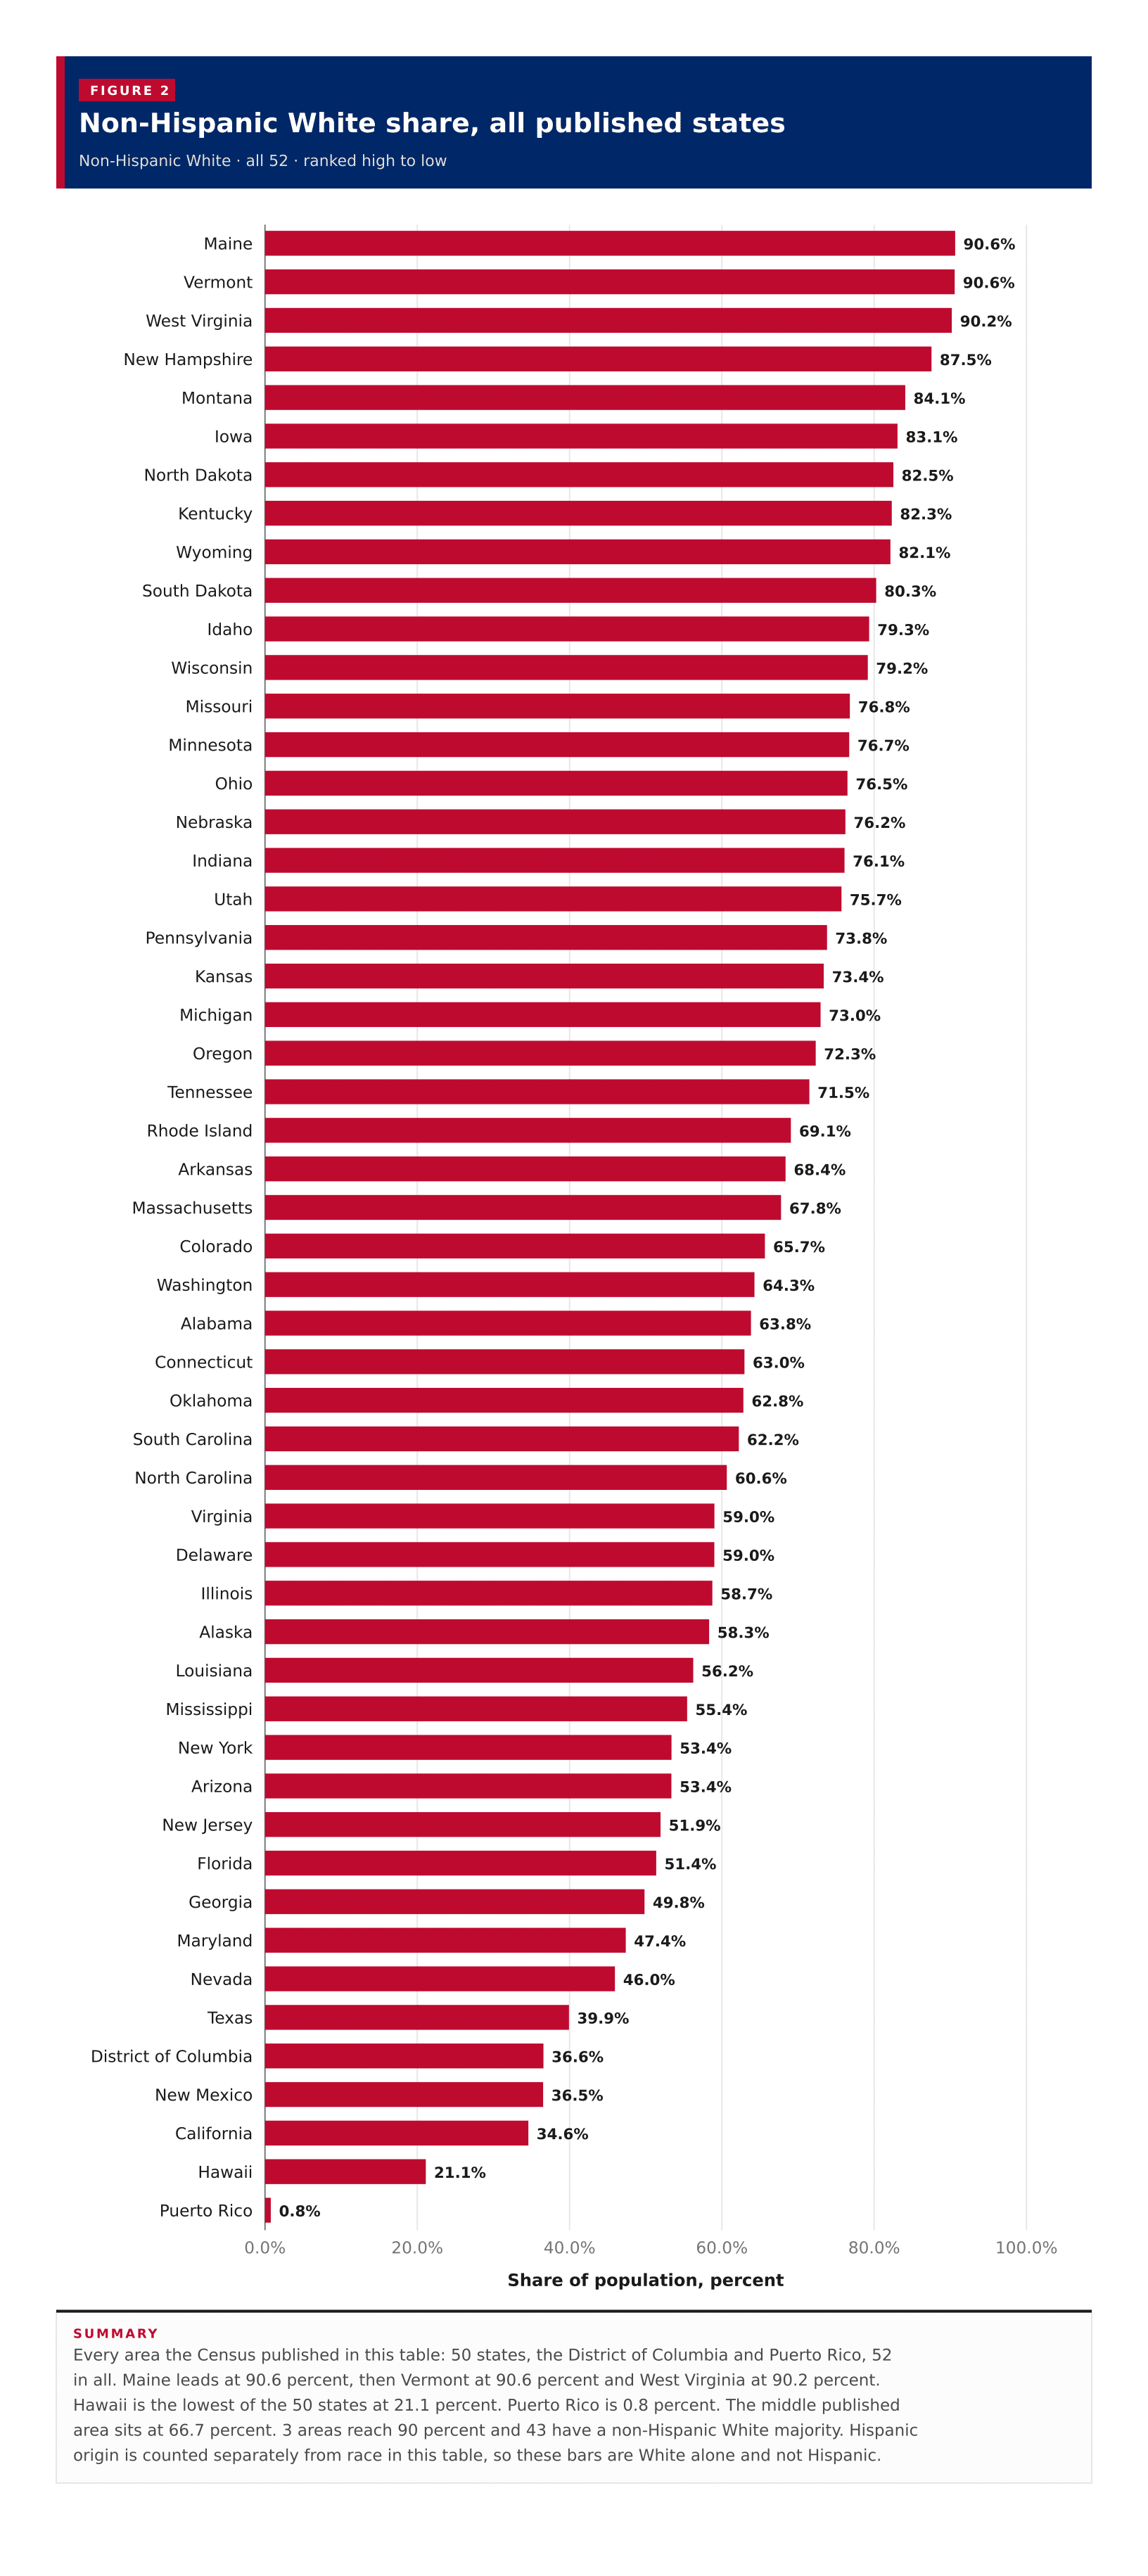
A typical published area is 66.7 percent White alone and not Hispanic, the midpoint of the 50 states, the District of Columbia and Puerto Rico on the 2023 ACS five-year estimates. Maine leads at 90.6 percent, with Vermont essentially tied and West Virginia at 90.2 percent. Hawaii is the lowest of the 50 states at 21.1 percent, and Asian residents are the largest group there at 36.7 percent. Puerto Rico, which this table also returns, is 98.8 percent Hispanic and 0.8 percent non-Hispanic White. Nine of the 52 published areas sit below a non-Hispanic White majority, including California, New Mexico, Texas, Georgia and the District of Columbia. These are each area’s own ACS shares, not a national average of people.
Non-Hispanic White · all 52 · ranked high to low
Every area the Census published in this table: 50 states, the District of Columbia and Puerto Rico, 52 in all. Maine leads at 90.6 percent, then Vermont at 90.6 percent and West Virginia at 90.2 percent. Hawaii is the lowest of the 50 states at 21.1 percent. Puerto Rico is 0.8 percent. The middle published area sits at 66.7 percent. 3 areas reach 90 percent and 43 have a non-Hispanic White majority. Hispanic origin is counted separately from race in this table, so these bars are White alone and not Hispanic.
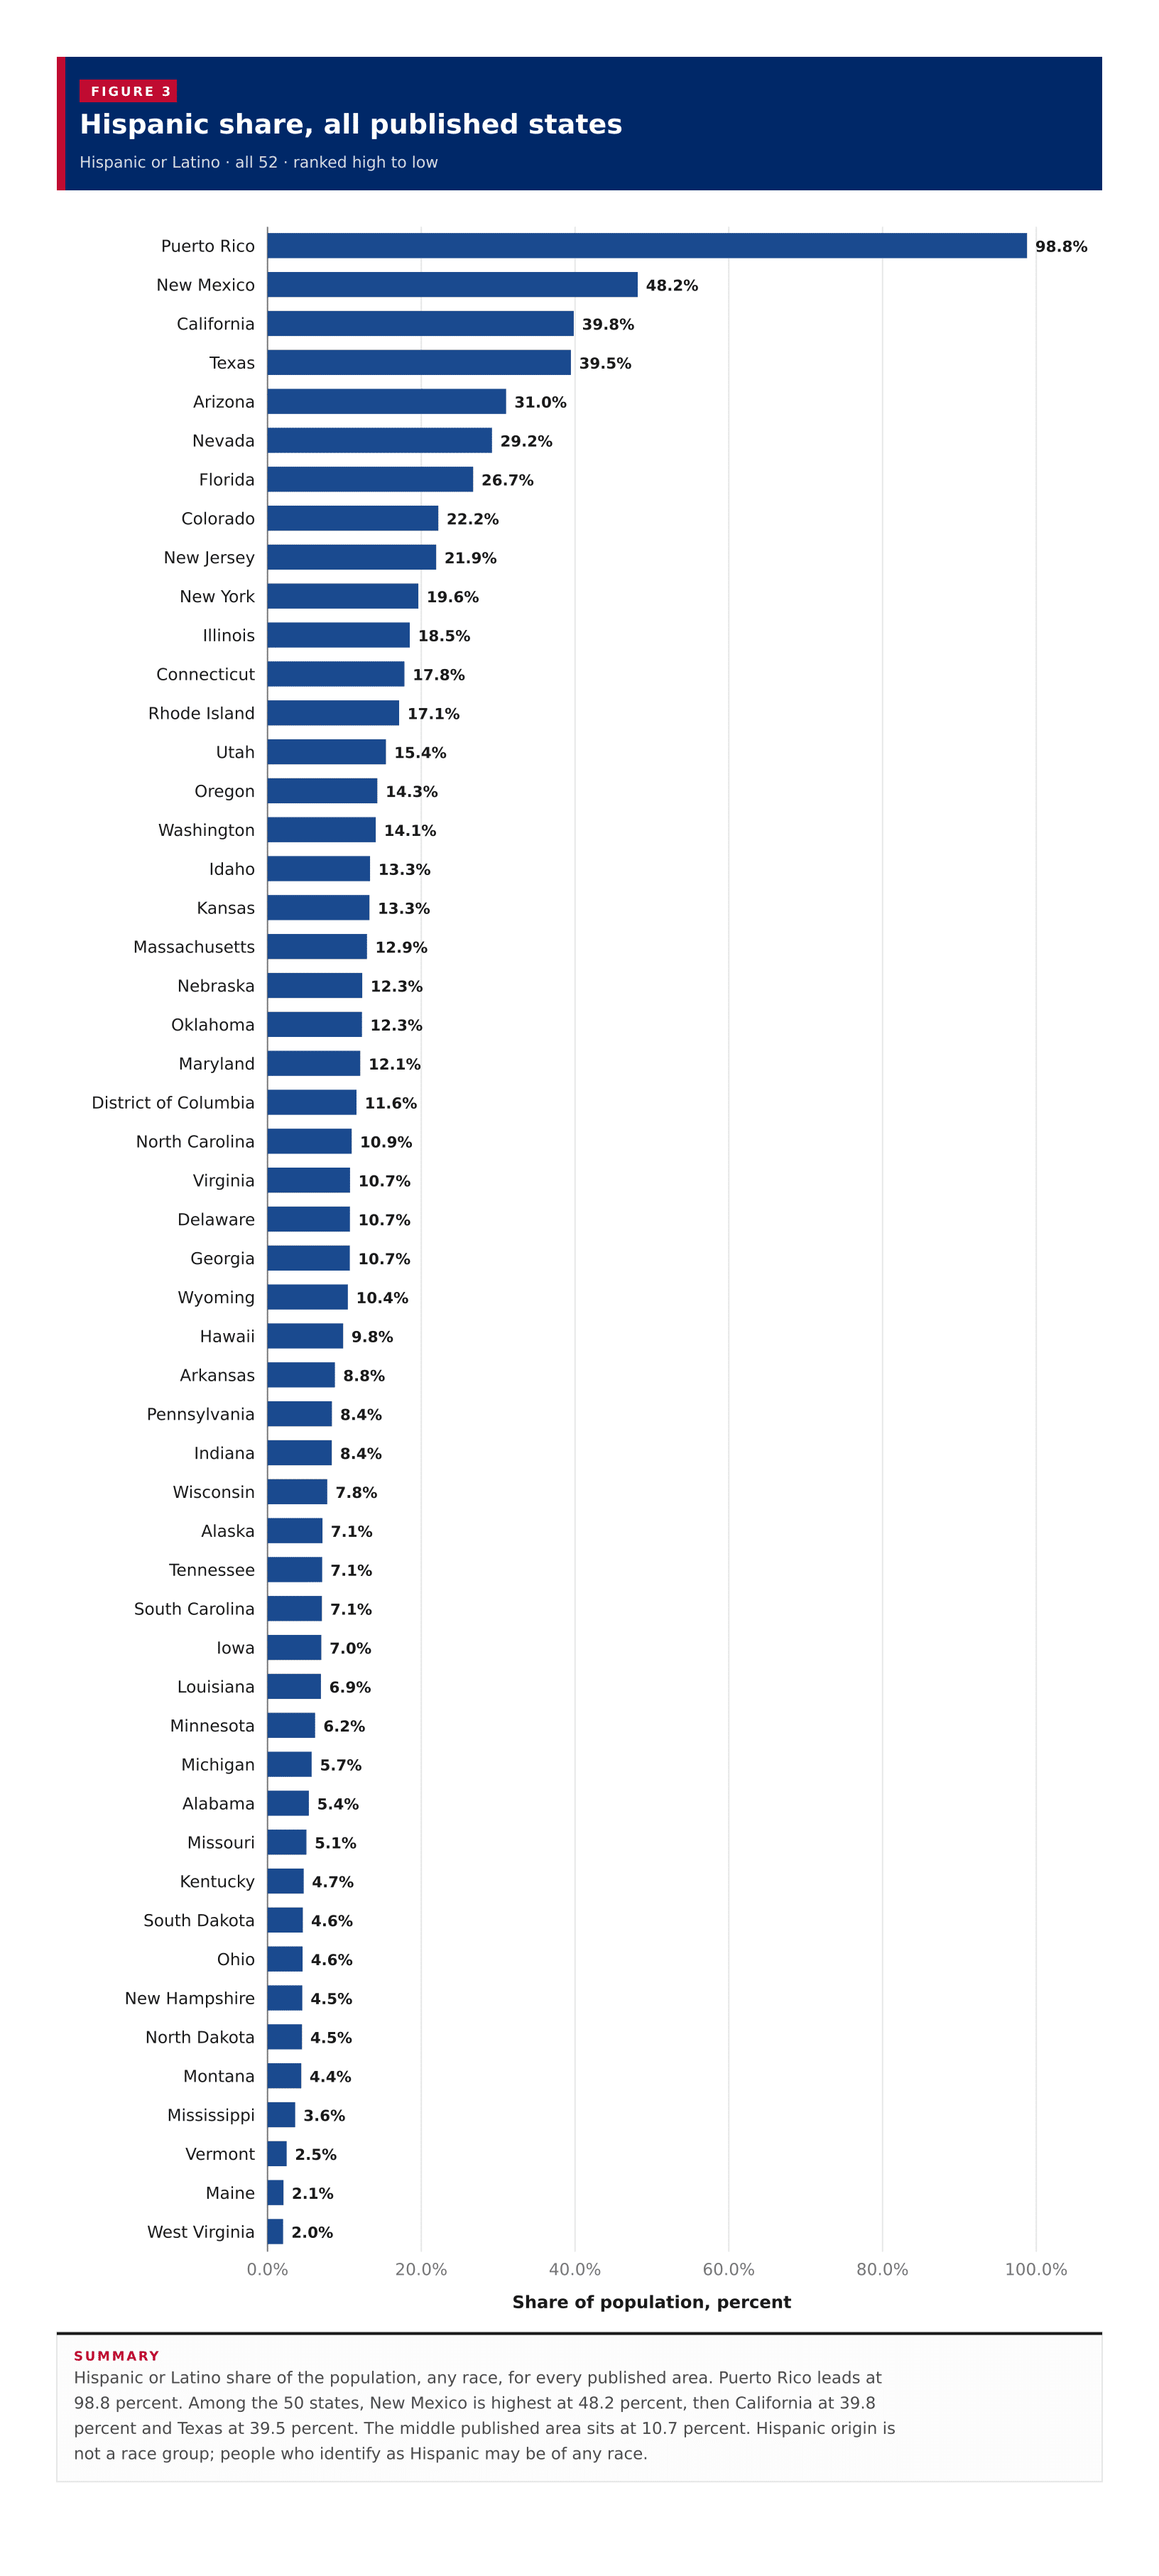
Hispanic or Latino · all 52 · ranked high to low
Hispanic or Latino share of the population, any race, for every published area. Puerto Rico leads at 98.8 percent. Among the 50 states, New Mexico is highest at 48.2 percent, then California at 39.8 percent and Texas at 39.5 percent. The middle published area sits at 10.7 percent. Hispanic origin is not a race group; people who identify as Hispanic may be of any race.
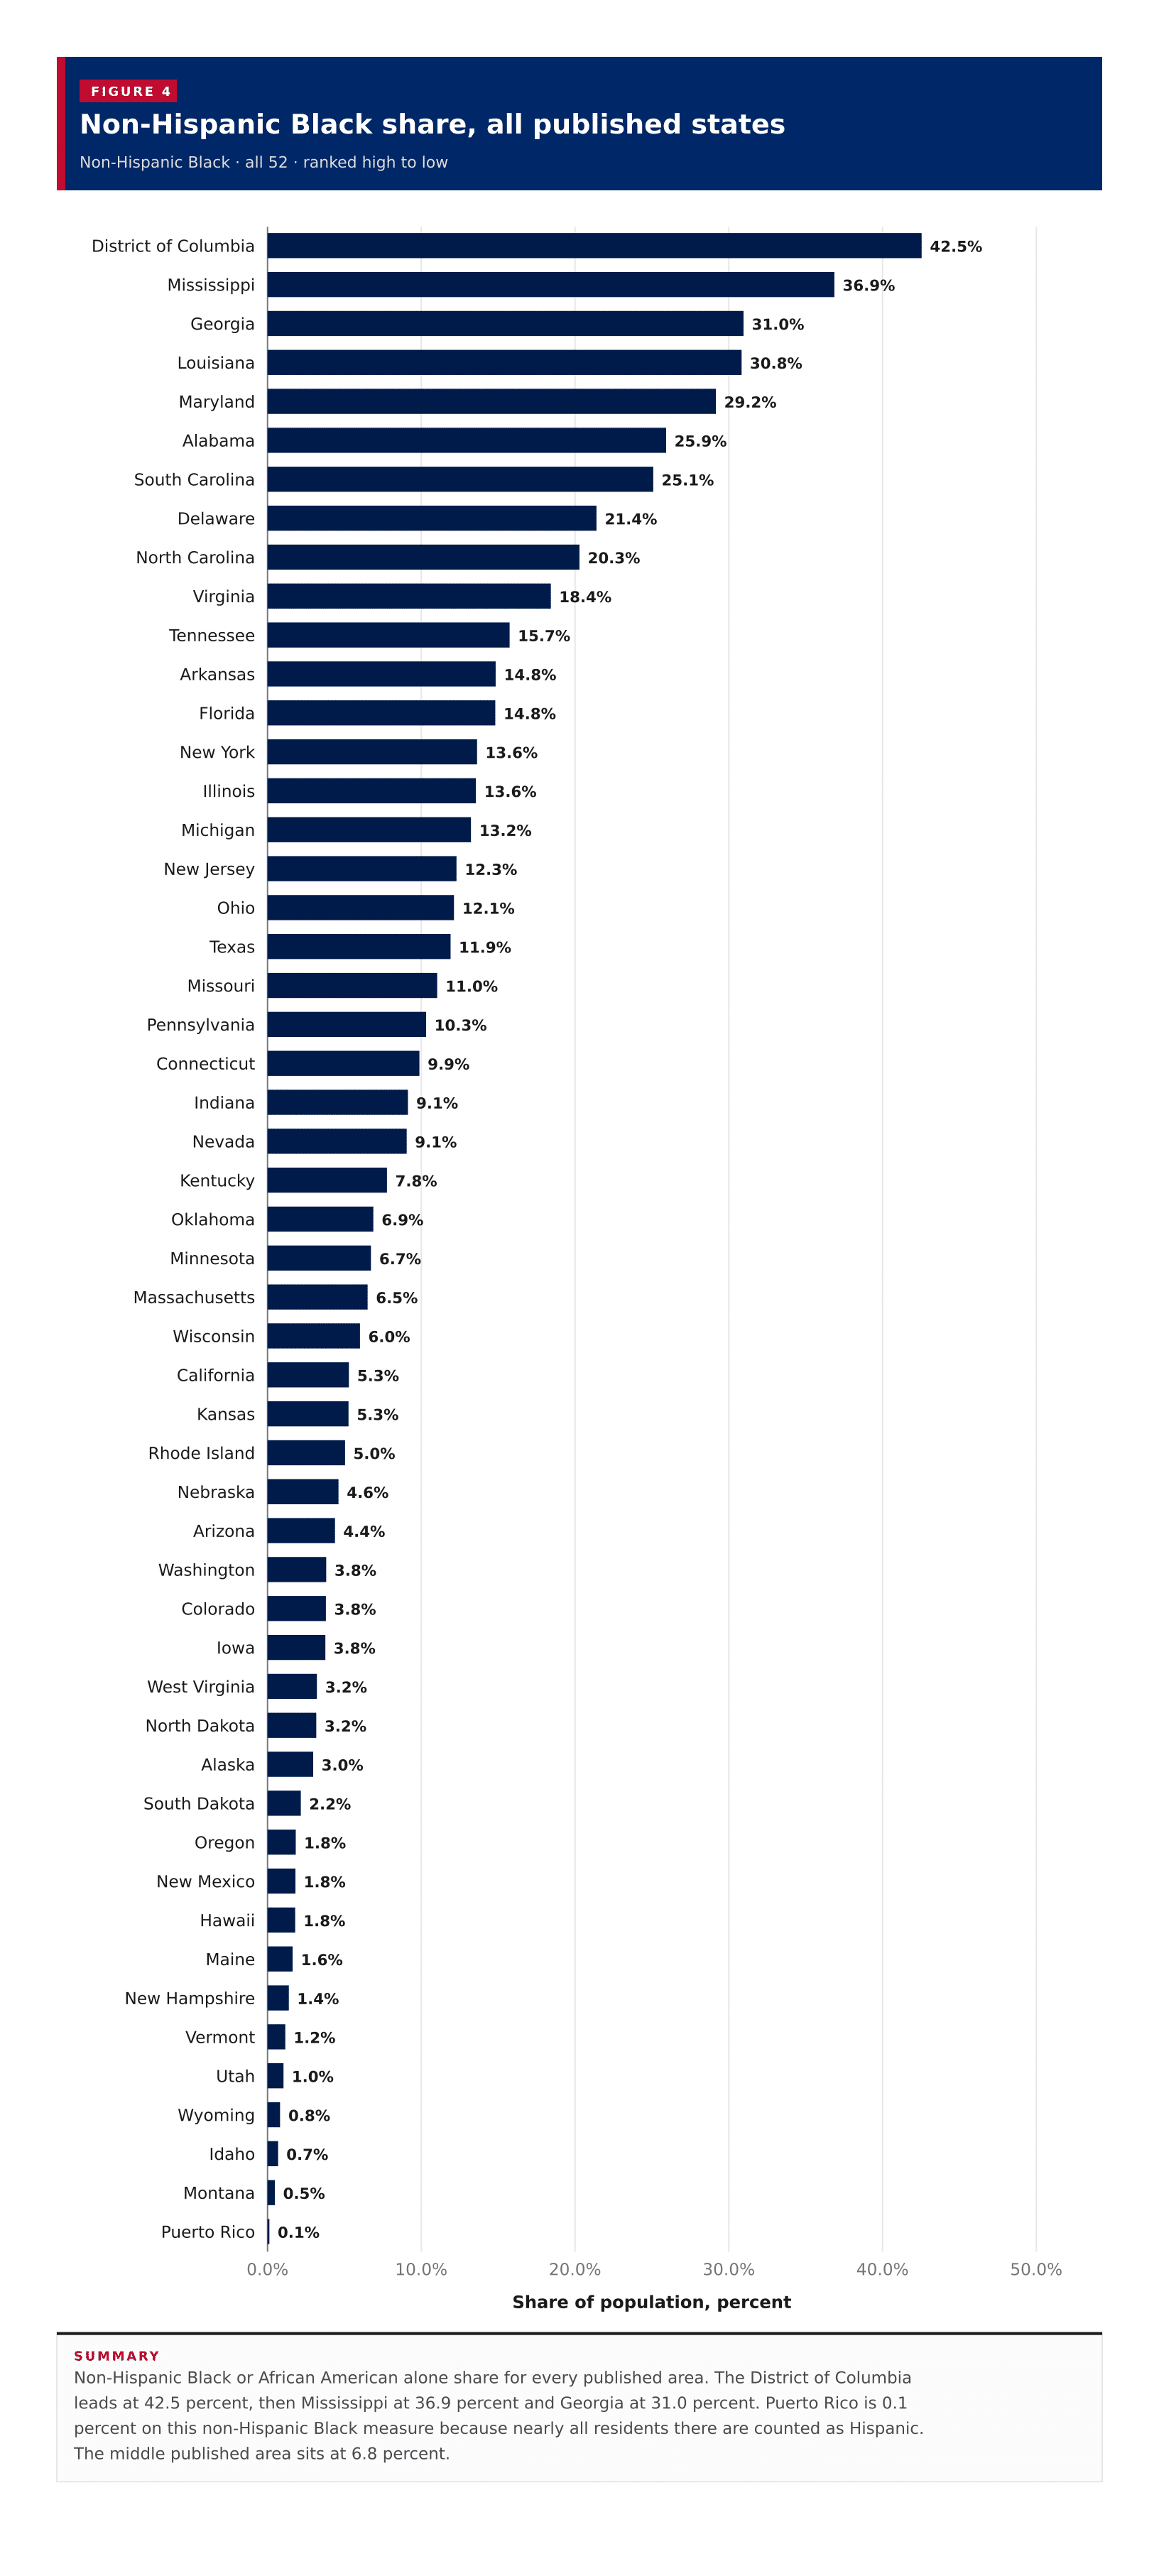
Non-Hispanic Black · all 52 · ranked high to low
Non-Hispanic Black or African American alone share for every published area. The District of Columbia leads at 42.5 percent, then Mississippi at 36.9 percent and Georgia at 31.0 percent. Puerto Rico is 0.1 percent on this non-Hispanic Black measure because nearly all residents there are counted as Hispanic. The middle published area sits at 6.8 percent.
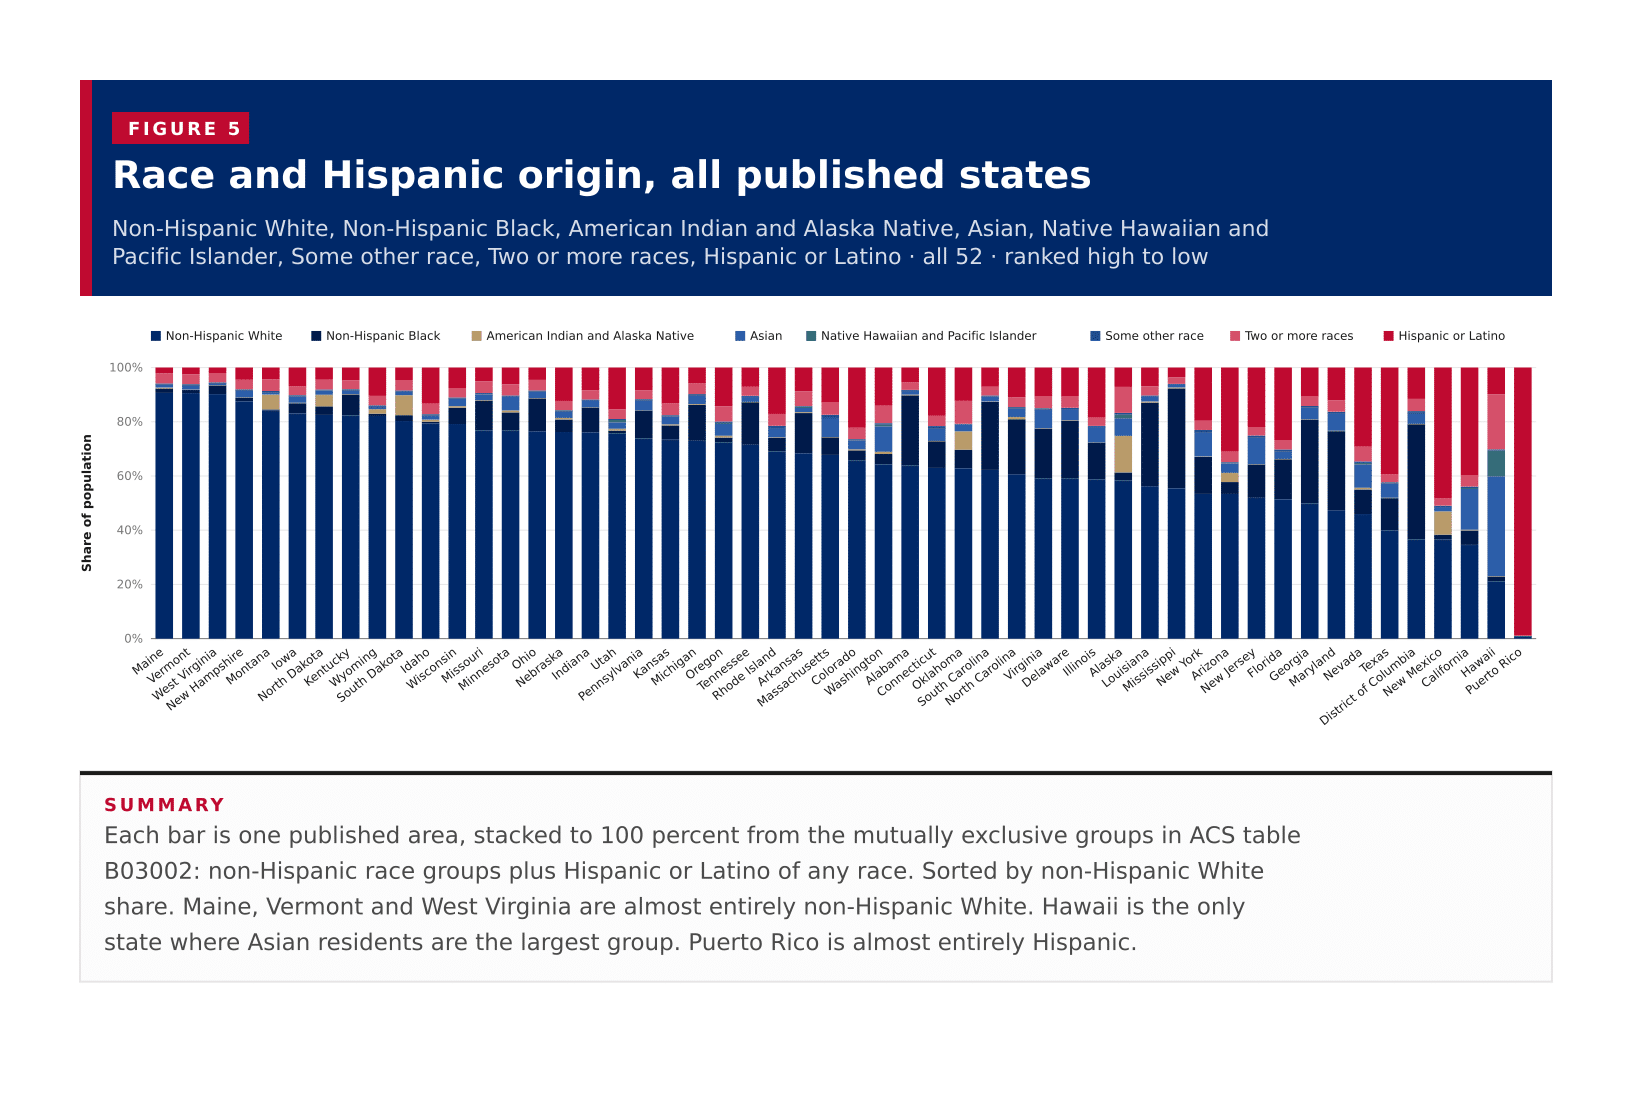
Non-Hispanic White, Non-Hispanic Black, American Indian and Alaska Native, Asian, Native Hawaiian and Pacific Islander, Some other race, Two or more races, Hispanic or Latino · all 52 · ranked high to low
Each bar is one published area, stacked to 100 percent from the mutually exclusive groups in ACS table B03002: non-Hispanic race groups plus Hispanic or Latino of any race. Sorted by non-Hispanic White share. Maine, Vermont and West Virginia are almost entirely non-Hispanic White. Hawaii is the only state where Asian residents are the largest group. Puerto Rico is almost entirely Hispanic.
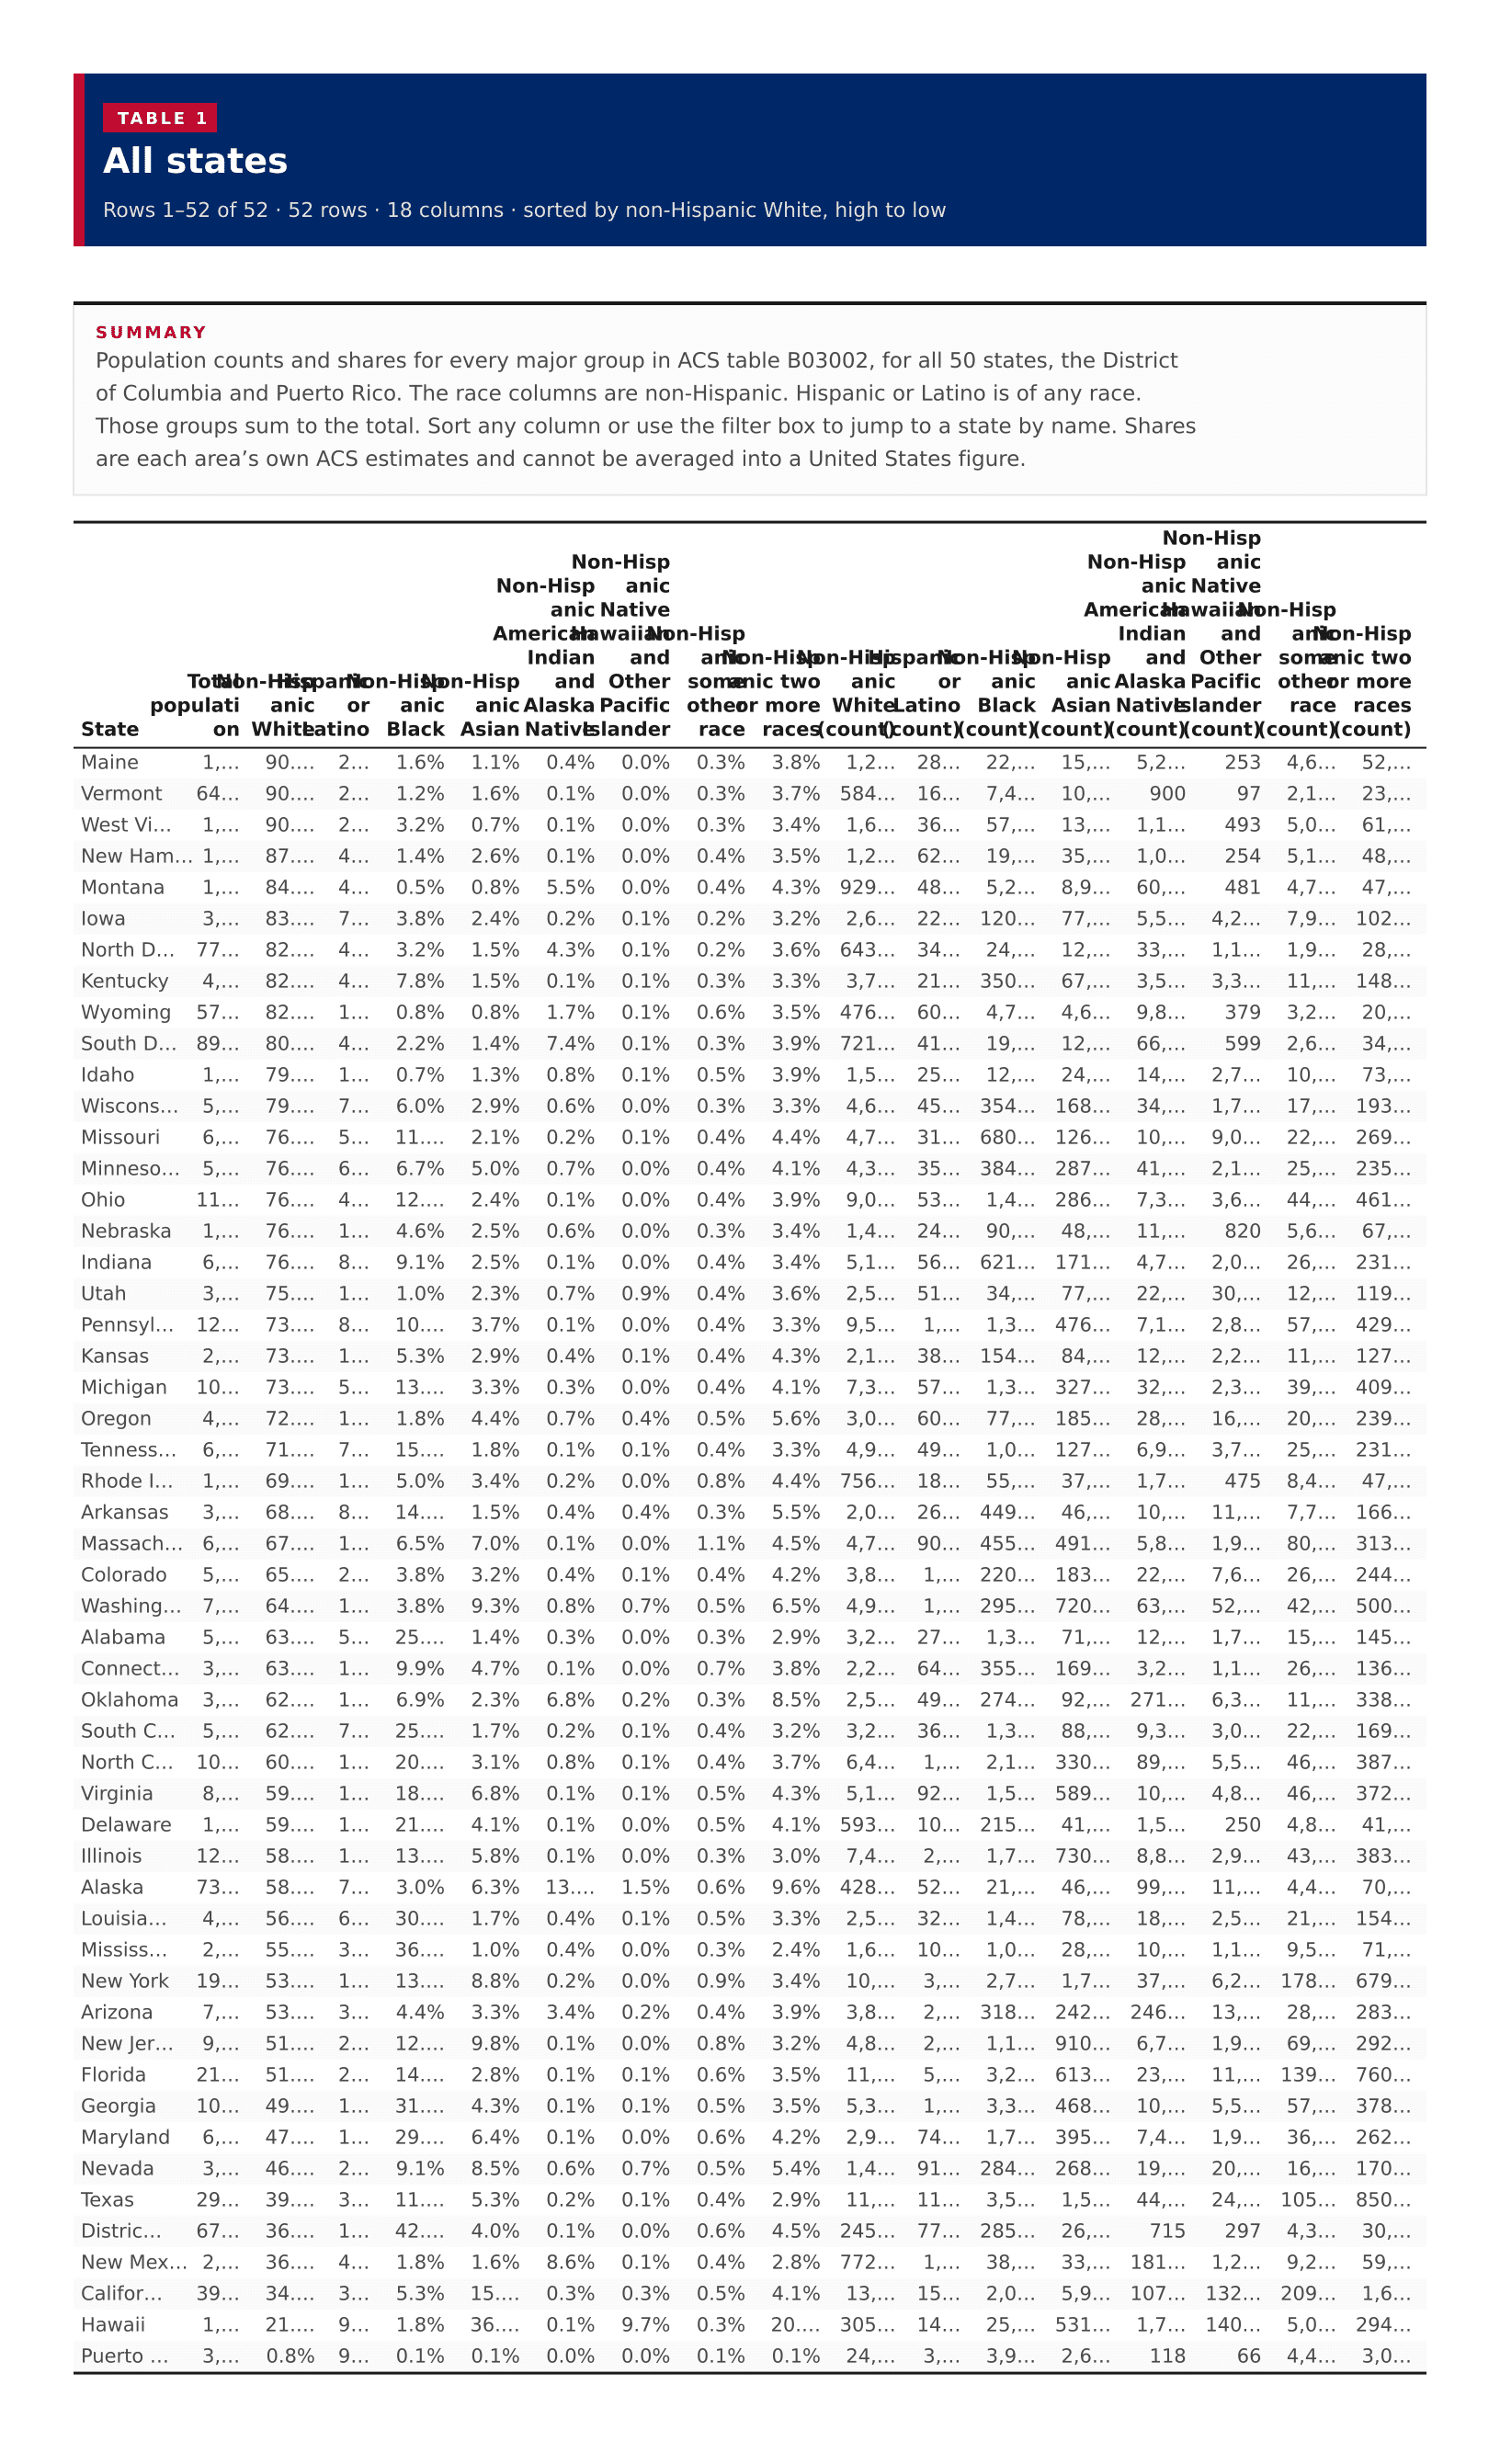
52 rows · 18 columns · sorted by non-Hispanic White, high to low
Population counts and shares for every major group in ACS table B03002, for all 50 states, the District of Columbia and Puerto Rico. The race columns are non-Hispanic. Hispanic or Latino is of any race. Those groups sum to the total. Sort any column or use the filter box to jump to a state by name. Shares are each area’s own ACS estimates and cannot be averaged into a United States figure.
| ? | ? | ? | ? | ? | ? | ? | ? | ? | ? | ? | ? | ? | ? | ? | ? | ? | |
|---|---|---|---|---|---|---|---|---|---|---|---|---|---|---|---|---|---|
| Maine | 1,377,400 | 90.6% | 2.1% | 1.6% | 1.1% | 0.4% | 0.0% | 0.3% | 3.8% | 1,248,450 | 28,609 | 22,477 | 15,115 | 5,260 | 253 | 4,638 | 52,598 |
| Vermont | 645,254 | 90.6% | 2.5% | 1.2% | 1.6% | 0.1% | 0.0% | 0.3% | 3.7% | 584,421 | 16,058 | 7,453 | 10,503 | 900 | 97 | 2,183 | 23,639 |
| West Virginia | 1,784,462 | 90.2% | 2.0% | 3.2% | 0.7% | 0.1% | 0.0% | 0.3% | 3.4% | 1,609,499 | 36,125 | 57,299 | 13,328 | 1,154 | 493 | 5,060 | 61,504 |
| New Hampshire | 1,387,834 | 87.5% | 4.5% | 1.4% | 2.6% | 0.1% | 0.0% | 0.4% | 3.5% | 1,214,784 | 62,758 | 19,214 | 35,730 | 1,078 | 254 | 5,176 | 48,840 |
| Montana | 1,105,072 | 84.1% | 4.4% | 0.5% | 0.8% | 5.5% | 0.0% | 0.4% | 4.3% | 929,206 | 48,519 | 5,243 | 8,944 | 60,745 | 481 | 4,714 | 47,220 |
| Iowa | 3,195,937 | 83.1% | 7.0% | 3.8% | 2.4% | 0.2% | 0.1% | 0.2% | 3.2% | 2,654,679 | 223,471 | 120,196 | 77,490 | 5,517 | 4,248 | 7,923 | 102,413 |
| North Dakota | 779,361 | 82.5% | 4.5% | 3.2% | 1.5% | 4.3% | 0.1% | 0.2% | 3.6% | 643,154 | 34,963 | 24,712 | 12,004 | 33,310 | 1,114 | 1,909 | 28,195 |
| Kentucky | 4,510,725 | 82.3% | 4.7% | 7.8% | 1.5% | 0.1% | 0.1% | 0.3% | 3.3% | 3,712,826 | 212,163 | 350,442 | 67,774 | 3,527 | 3,337 | 11,883 | 148,773 |
| Wyoming | 579,761 | 82.1% | 10.4% | 0.8% | 0.8% | 1.7% | 0.1% | 0.6% | 3.5% | 476,179 | 60,581 | 4,723 | 4,626 | 9,809 | 379 | 3,219 | 20,245 |
| South Dakota | 899,194 | 80.3% | 4.6% | 2.2% | 1.4% | 7.4% | 0.1% | 0.3% | 3.9% | 721,732 | 41,281 | 19,457 | 12,515 | 66,352 | 599 | 2,611 | 34,647 |
| Idaho | 1,893,296 | 79.3% | 13.3% | 0.7% | 1.3% | 0.8% | 0.1% | 0.5% | 3.9% | 1,502,167 | 252,466 | 12,995 | 24,200 | 14,776 | 2,767 | 10,377 | 73,548 |
| Wisconsin | 5,892,023 | 79.2% | 7.8% | 6.0% | 2.9% | 0.6% | 0.0% | 0.3% | 3.3% | 4,664,403 | 457,687 | 354,279 | 168,432 | 34,317 | 1,729 | 17,723 | 193,453 |
| Missouri | 6,168,181 | 76.8% | 5.1% | 11.0% | 2.1% | 0.2% | 0.1% | 0.4% | 4.4% | 4,737,581 | 311,924 | 680,587 | 126,461 | 10,720 | 9,010 | 22,430 | 269,468 |
| Minnesota | 5,713,716 | 76.7% | 6.2% | 6.7% | 5.0% | 0.7% | 0.0% | 0.4% | 4.1% | 4,383,717 | 353,608 | 384,286 | 287,321 | 41,765 | 2,118 | 25,549 | 235,352 |
| Ohio | 11,780,046 | 76.5% | 4.6% | 12.1% | 2.4% | 0.1% | 0.0% | 0.4% | 3.9% | 9,011,101 | 537,559 | 1,428,392 | 286,098 | 7,359 | 3,655 | 44,813 | 461,069 |
| Nebraska | 1,965,926 | 76.2% | 12.3% | 4.6% | 2.5% | 0.6% | 0.0% | 0.3% | 3.4% | 1,498,458 | 242,226 | 90,735 | 48,746 | 11,521 | 820 | 5,694 | 67,726 |
| Indiana | 6,811,752 | 76.1% | 8.4% | 9.1% | 2.5% | 0.1% | 0.0% | 0.4% | 3.4% | 5,184,070 | 569,410 | 621,991 | 171,292 | 4,786 | 2,073 | 26,465 | 231,665 |
| Utah | 3,331,187 | 75.7% | 15.4% | 1.0% | 2.3% | 0.7% | 0.9% | 0.4% | 3.6% | 2,521,945 | 513,013 | 34,607 | 77,221 | 22,765 | 30,359 | 12,028 | 119,249 |
| Pennsylvania | 12,986,518 | 73.8% | 8.4% | 10.3% | 3.7% | 0.1% | 0.0% | 0.4% | 3.3% | 9,585,453 | 1,087,732 | 1,339,554 | 476,888 | 7,187 | 2,816 | 57,678 | 429,210 |
| Kansas | 2,937,569 | 73.4% | 13.3% | 5.3% | 2.9% | 0.4% | 0.1% | 0.4% | 4.3% | 2,155,363 | 389,514 | 154,704 | 84,668 | 12,516 | 2,217 | 11,194 | 127,393 |
| Michigan | 10,051,595 | 73.0% | 5.7% | 13.2% | 3.3% | 0.3% | 0.0% | 0.4% | 4.1% | 7,333,936 | 576,808 | 1,329,998 | 327,211 | 32,996 | 2,322 | 39,284 | 409,040 |
| Oregon | 4,238,714 | 72.3% | 14.3% | 1.8% | 4.4% | 0.7% | 0.4% | 0.5% | 5.6% | 3,065,611 | 605,467 | 77,800 | 185,768 | 28,235 | 16,000 | 20,804 | 239,029 |
| Tennessee | 6,986,082 | 71.5% | 7.1% | 15.7% | 1.8% | 0.1% | 0.1% | 0.4% | 3.3% | 4,994,428 | 496,457 | 1,099,942 | 127,497 | 6,914 | 3,783 | 25,909 | 231,152 |
| Rhode Island | 1,095,371 | 69.1% | 17.1% | 5.0% | 3.4% | 0.2% | 0.0% | 0.8% | 4.4% | 756,498 | 187,503 | 55,222 | 37,493 | 1,721 | 475 | 8,472 | 47,987 |
| Arkansas | 3,032,651 | 68.4% | 8.8% | 14.8% | 1.5% | 0.4% | 0.4% | 0.3% | 5.5% | 2,073,216 | 265,833 | 449,926 | 46,492 | 10,800 | 11,906 | 7,784 | 166,694 |
| Massachusetts | 6,992,395 | 67.8% | 12.9% | 6.5% | 7.0% | 0.1% | 0.0% | 1.1% | 4.5% | 4,738,848 | 904,679 | 455,145 | 491,861 | 5,837 | 1,964 | 80,134 | 313,927 |
| Colorado | 5,810,774 | 65.7% | 22.2% | 3.8% | 3.2% | 0.4% | 0.1% | 0.4% | 4.2% | 3,814,910 | 1,291,078 | 220,577 | 183,336 | 22,372 | 7,682 | 26,117 | 244,702 |
| Washington | 7,740,984 | 64.3% | 14.1% | 3.8% | 9.3% | 0.8% | 0.7% | 0.5% | 6.5% | 4,975,929 | 1,089,609 | 295,487 | 720,927 | 63,389 | 52,674 | 42,271 | 500,698 |
| Alabama | 5,054,253 | 63.8% | 5.4% | 25.9% | 1.4% | 0.3% | 0.0% | 0.3% | 2.9% | 3,225,652 | 271,640 | 1,310,256 | 71,020 | 12,974 | 1,727 | 15,533 | 145,451 |
| Connecticut | 3,598,348 | 63.0% | 17.8% | 9.9% | 4.7% | 0.1% | 0.0% | 0.7% | 3.8% | 2,265,780 | 640,668 | 355,413 | 169,312 | 3,236 | 1,102 | 26,211 | 136,626 |
| Oklahoma | 3,995,260 | 62.8% | 12.3% | 6.9% | 2.3% | 6.8% | 0.2% | 0.3% | 8.5% | 2,509,923 | 490,797 | 274,899 | 92,345 | 271,284 | 6,313 | 11,236 | 338,463 |
| South Carolina | 5,212,774 | 62.2% | 7.1% | 25.1% | 1.7% | 0.2% | 0.1% | 0.4% | 3.2% | 3,243,703 | 368,900 | 1,307,687 | 88,246 | 9,365 | 3,034 | 22,698 | 169,141 |
| North Carolina | 10,584,340 | 60.6% | 10.9% | 20.3% | 3.1% | 0.8% | 0.1% | 0.4% | 3.7% | 6,419,285 | 1,158,750 | 2,147,308 | 330,720 | 89,481 | 5,548 | 46,117 | 387,131 |
| Virginia | 8,657,499 | 59.0% | 10.7% | 18.4% | 6.8% | 0.1% | 0.1% | 0.5% | 4.3% | 5,109,807 | 929,140 | 1,595,267 | 589,324 | 10,473 | 4,893 | 46,461 | 372,134 |
| Delaware | 1,005,872 | 59.0% | 10.7% | 21.4% | 4.1% | 0.1% | 0.0% | 0.5% | 4.1% | 593,548 | 107,829 | 215,204 | 41,015 | 1,504 | 250 | 4,851 | 41,671 |
| Illinois | 12,692,653 | 58.7% | 18.5% | 13.6% | 5.8% | 0.1% | 0.0% | 0.3% | 3.0% | 7,456,575 | 2,348,118 | 1,719,887 | 730,106 | 8,843 | 2,966 | 43,037 | 383,121 |
| Alaska | 733,971 | 58.3% | 7.1% | 3.0% | 6.3% | 13.5% | 1.5% | 0.6% | 9.6% | 428,104 | 52,473 | 21,801 | 46,476 | 99,068 | 11,163 | 4,499 | 70,387 |
| Louisiana | 4,621,025 | 56.2% | 6.9% | 30.8% | 1.7% | 0.4% | 0.1% | 0.5% | 3.3% | 2,598,789 | 321,022 | 1,424,797 | 78,990 | 18,875 | 2,574 | 21,268 | 154,710 |
| Mississippi | 2,951,438 | 55.4% | 3.6% | 36.9% | 1.0% | 0.4% | 0.0% | 0.3% | 2.4% | 1,636,190 | 106,126 | 1,088,106 | 28,472 | 10,332 | 1,175 | 9,507 | 71,530 |
| New York | 19,872,319 | 53.4% | 19.6% | 13.6% | 8.8% | 0.2% | 0.0% | 0.9% | 3.4% | 10,608,842 | 3,898,652 | 2,708,094 | 1,754,957 | 37,212 | 6,220 | 178,956 | 679,386 |
| Arizona | 7,268,175 | 53.4% | 31.0% | 4.4% | 3.3% | 3.4% | 0.2% | 0.4% | 3.9% | 3,878,932 | 2,255,770 | 318,894 | 242,881 | 246,825 | 13,016 | 28,464 | 283,393 |
| New Jersey | 9,267,014 | 51.9% | 21.9% | 12.3% | 9.8% | 0.1% | 0.0% | 0.8% | 3.2% | 4,813,341 | 2,032,968 | 1,138,893 | 910,968 | 6,790 | 1,955 | 69,560 | 292,539 |
| Florida | 21,928,881 | 51.4% | 26.7% | 14.8% | 2.8% | 0.1% | 0.1% | 0.6% | 3.5% | 11,266,583 | 5,865,737 | 3,248,401 | 613,745 | 23,258 | 11,168 | 139,420 | 760,569 |
| Georgia | 10,822,590 | 49.8% | 10.7% | 31.0% | 4.3% | 0.1% | 0.1% | 0.5% | 3.5% | 5,394,071 | 1,158,299 | 3,350,394 | 468,448 | 10,235 | 5,526 | 57,026 | 378,591 |
| Maryland | 6,170,738 | 47.4% | 12.1% | 29.2% | 6.4% | 0.1% | 0.0% | 0.6% | 4.2% | 2,923,706 | 744,272 | 1,799,355 | 395,663 | 7,494 | 1,944 | 36,201 | 262,103 |
| Nevada | 3,141,000 | 46.0% | 29.2% | 9.1% | 8.5% | 0.6% | 0.7% | 0.5% | 5.4% | 1,443,407 | 917,057 | 284,276 | 268,095 | 19,877 | 20,812 | 16,975 | 170,501 |
| Texas | 29,640,343 | 39.9% | 39.5% | 11.9% | 5.3% | 0.2% | 0.1% | 0.4% | 2.9% | 11,832,668 | 11,697,134 | 3,528,533 | 1,557,270 | 44,974 | 24,165 | 105,597 | 850,002 |
| District of Columbia | 672,079 | 36.6% | 11.6% | 42.5% | 4.0% | 0.1% | 0.0% | 0.6% | 4.5% | 245,760 | 77,760 | 285,926 | 26,970 | 715 | 297 | 4,301 | 30,350 |
| New Mexico | 2,114,768 | 36.5% | 48.2% | 1.8% | 1.6% | 8.6% | 0.1% | 0.4% | 2.8% | 772,482 | 1,018,321 | 38,382 | 33,725 | 181,771 | 1,248 | 9,289 | 59,550 |
| California | 39,242,785 | 34.6% | 39.8% | 5.3% | 15.1% | 0.3% | 0.3% | 0.5% | 4.1% | 13,573,226 | 15,630,830 | 2,076,395 | 5,906,995 | 107,379 | 132,838 | 209,918 | 1,605,204 |
| Hawaii | 1,445,635 | 21.1% | 9.8% | 1.8% | 36.7% | 0.1% | 9.7% | 0.3% | 20.3% | 305,329 | 142,225 | 25,998 | 531,189 | 1,745 | 140,064 | 5,035 | 294,050 |
| Puerto Rico | 3,254,885 | 0.8% | 98.8% | 0.1% | 0.1% | 0.0% | 0.0% | 0.1% | 0.1% | 24,778 | 3,215,824 | 3,917 | 2,670 | 118 | 66 | 4,421 | 3,091 |