
Figure 1
Population growth, US cities
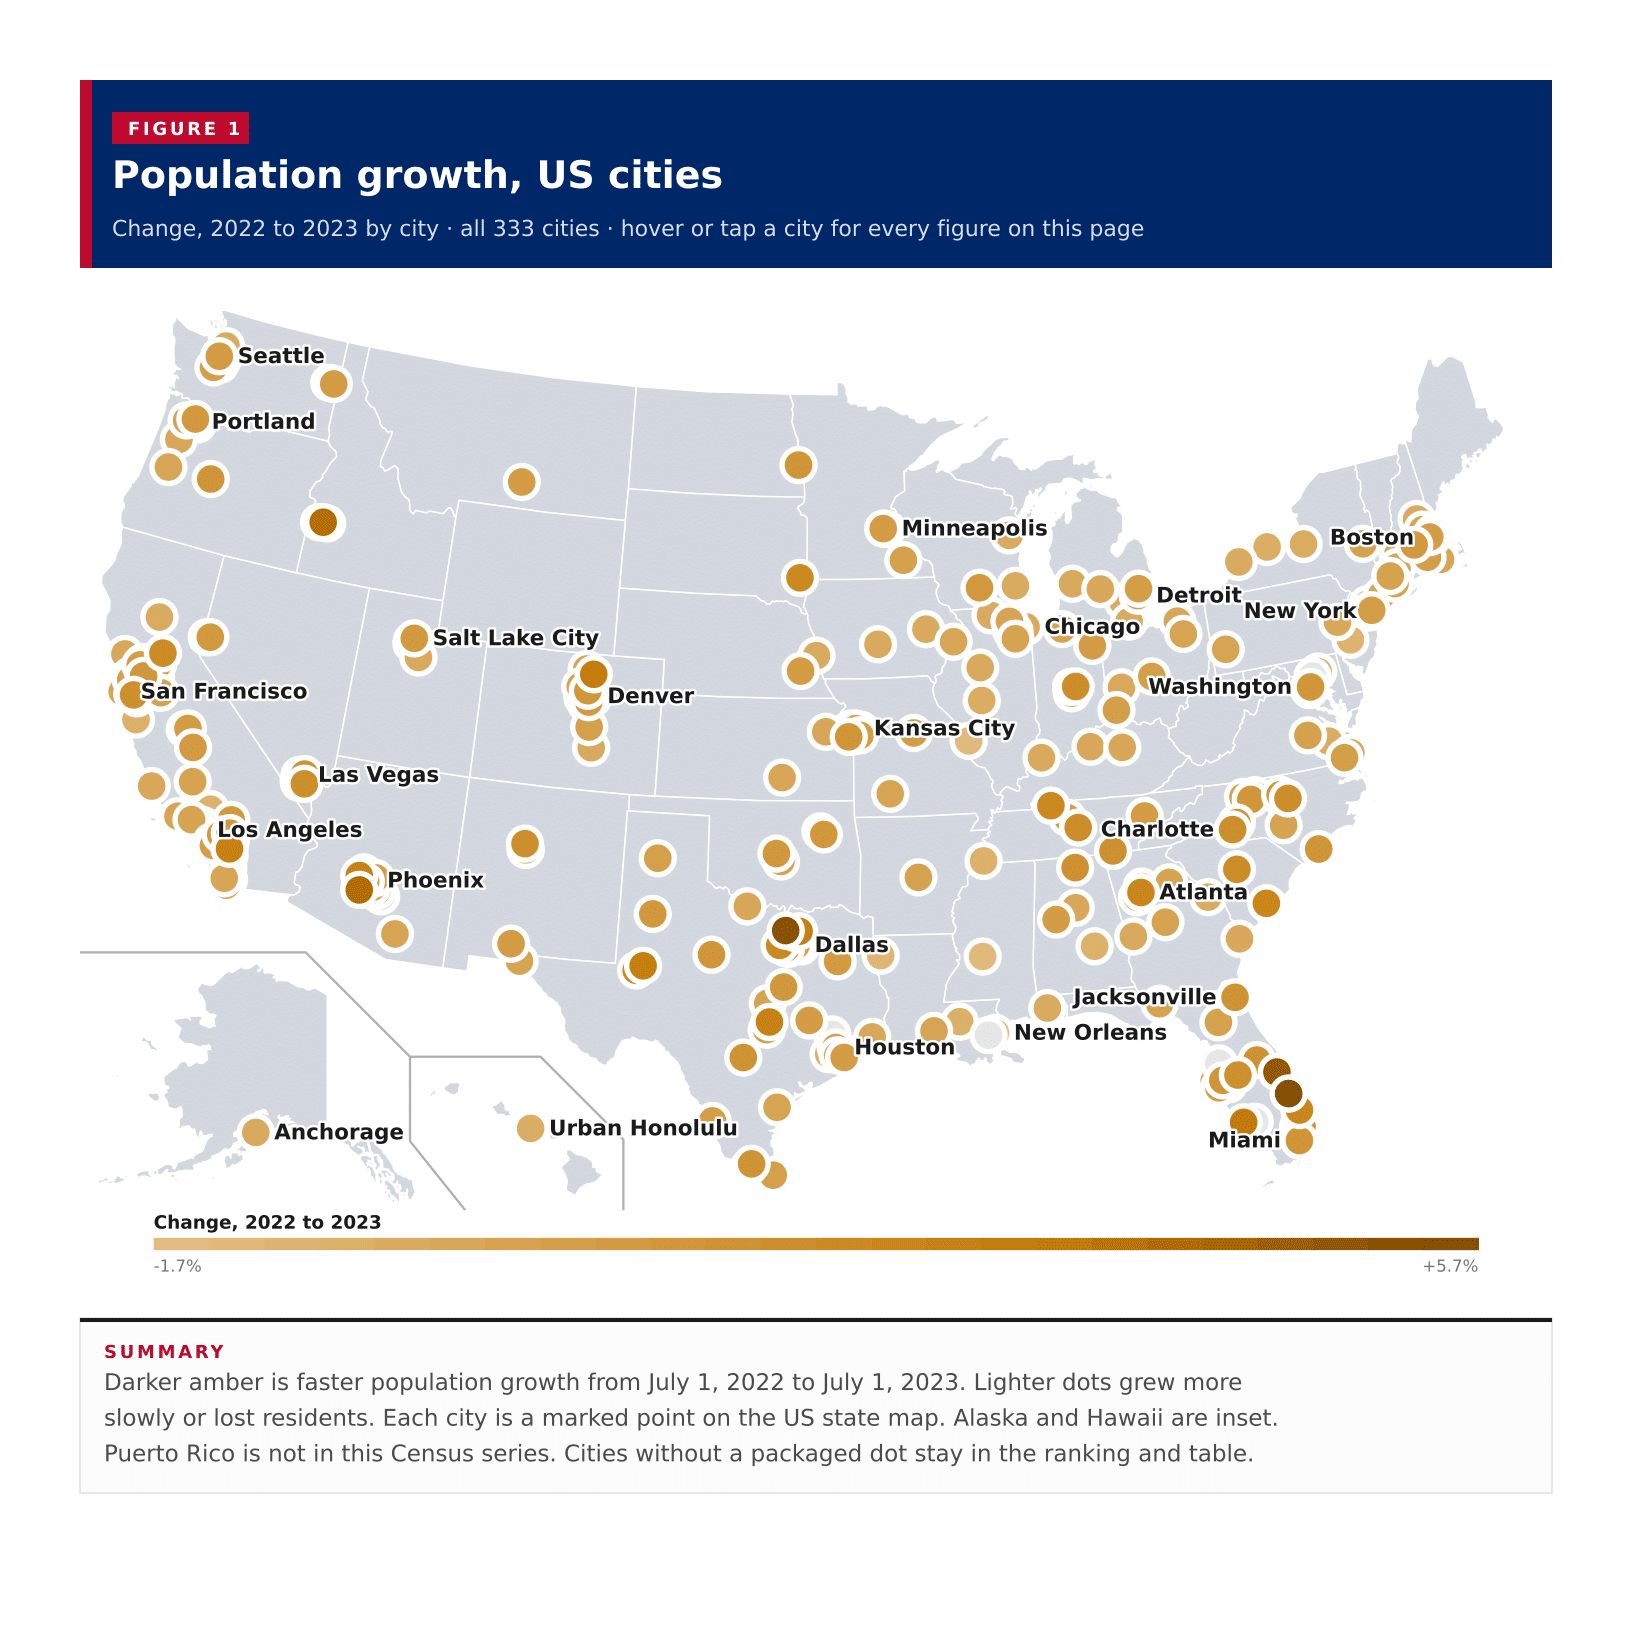
Change, 2022 to 2023 by city · all 333 cities · hover or tap a city for every figure on this page
Darker amber is faster population growth from July 1, 2022 to July 1, 2023. Lighter dots grew more slowly or lost residents. Each city is a marked point on the US state map. Alaska and Hawaii are inset. Puerto Rico is not in this Census series. Cities without a packaged dot stay in the ranking and table.
Conroe, Texas grew faster than any other US city of 100,000 or more from July 1, 2022 to July 1, 2023, adding 6,689 residents, a 6.6 percent rise, on the Census Bureau Vintage 2023 population estimates. New Braunfels, Texas grew 5.9 percent and Port St. Lucie, Florida 5.7 percent. San Antonio, Texas added the most people, 21,970, then Fort Worth, Texas 21,365. A typical city in this set grew 0.2 percent, the midpoint of the 333 incorporated places, so half grew faster and half grew more slowly or shrank. That midpoint is not a United States growth rate. 201 of the 333 cities gained residents and 132 lost them. Sandy Springs, Georgia had the steepest decline, down 1.7 percent. New York, New York lost the most residents, 77,763. These are July 1 estimates for each city, not ACS period estimates and not a national figure.
Change, 2022 to 2023 · all 333 · ranked high to low
Every incorporated place with at least 100,000 residents on the July 1, 2023 estimate, 333 in all. Conroe, Texas leads at 6.6%, then New Braunfels, Texas at 5.9% and Port St. Lucie, Florida at 5.7%. 73 cities grew at least 1 percent, including Conroe, Texas, New Braunfels, Texas, Port St. Lucie, Florida, Denton, Texas, Palm Bay, Florida, Goodyear, Arizona, Meridian, Idaho, Palm Coast, Florida, Cape Coral, Florida, Buckeye, Arizona, Greeley, Colorado and Nampa, Idaho. Sandy Springs, Georgia is lowest at -1.7%. The middle city sits at 0.2%. Percent change is (July 2023 minus July 2022) divided by the 2022 estimate.
Numeric change, 2022 to 2023 · all 333 · ranked high to low
People added or lost from July 1, 2022 to July 1, 2023, for every included city. San Antonio, Texas added 21,970, then Fort Worth, Texas 21,365. New York, New York lost 77,763. Numeric change and percent change pick different leaders: Conroe, Texas grew fastest in percent terms, San Antonio, Texas added the most people.
Change since April 2020 · all 333 · ranked high to low
Percent change from the April 1, 2020 estimates base to July 1, 2023. New Braunfels, Texas leads at 22.7%, then Conroe, Texas at 20.3% and Port St. Lucie, Florida at 19.6%. San Francisco, California is lowest at -7.4%, then St. Louis, Missouri at -6.6%. This is a three-year-plus change, not the latest annual rate.
Numeric change, 2022 to 2023 against change, 2022 to 2023 · one point per row, 333 of 333 plotted
Each point is one city of 100,000 or more, 333 in all. Percent growth and people added are related but not the same thing: the correlation coefficient is 0.45. Conroe, Texas pairs a 6.6% rise with 6,689 people, while San Antonio, Texas pairs a 1.5% rise with 21,970 people. Fast percent growth in a smaller city is not the same as a large numeric gain in a big one.
333 rows · 8 columns · sorted by change, 2022 to 2023, high to low
July 1, 2022 and July 1, 2023 resident population, the April 1, 2020 estimates base, and both percent and numeric change for every US incorporated place of 100,000 or more on Census Vintage 2023 estimates. Sort any column or use the filter box to jump to a city by name. These rates cannot be averaged into a United States figure.
| ? | ? | ? | ? | ? | ? | ? | |
|---|---|---|---|---|---|---|---|
| Conroe, Texas | +6.6% | +6,689 | +20.3% | +18,253 | 108,248 | 101,559 | 89,995 |
| New Braunfels, Texas | +5.9% | +6,229 | +22.7% | +20,550 | 110,958 | 104,729 | 90,408 |
| Port St. Lucie, Florida | +5.7% | +13,169 | +19.6% | +40,166 | 245,021 | 231,852 | 204,855 |
| Denton, Texas | +5.3% | +7,914 | +13.2% | +18,483 | 158,349 | 150,435 | 139,866 |
| Palm Bay, Florida | +4.9% | +6,393 | +13.2% | +15,814 | 135,566 | 129,173 | 119,752 |
| Goodyear, Arizona | +4.0% | +4,299 | +16.2% | +15,623 | 111,805 | 107,506 | 96,182 |
| Meridian, Idaho | +3.9% | +5,094 | +14.5% | +17,056 | 134,801 | 129,707 | 117,745 |
| Palm Coast, Florida | +3.7% | +3,658 | +14.4% | +12,865 | 102,113 | 98,455 | 89,248 |
| Cape Coral, Florida | +3.5% | +7,540 | +15.7% | +30,461 | 224,455 | 216,915 | 193,994 |
| Buckeye, Arizona | +3.2% | +3,365 | +19.0% | +17,370 | 108,909 | 105,544 | 91,539 |
| Greeley, Colorado | +3.1% | +3,364 | +3.5% | +3,815 | 112,609 | 109,245 | 108,794 |
| Nampa, Idaho | +3.1% | +3,410 | +13.9% | +13,960 | 114,268 | 110,858 | 100,308 |
| Midland, Texas | +2.9% | +3,940 | +4.4% | +5,869 | 138,397 | 134,457 | 132,528 |
| McKinney, Texas | +2.8% | +5,906 | +9.3% | +18,180 | 213,509 | 207,603 | 195,329 |
| Menifee, California | +2.8% | +3,055 | +10.6% | +10,905 | 113,433 | 110,378 | 102,528 |
| Round Rock, Texas | +2.7% | +3,479 | +9.1% | +10,896 | 130,406 | 126,927 | 119,510 |
| Surprise, Arizona | +2.7% | +4,136 | +10.6% | +15,125 | 158,285 | 154,149 | 143,160 |
| Frisco, Texas | +2.4% | +5,366 | +12.2% | +24,470 | 225,007 | 219,641 | 200,537 |
| North Charleston, South Carolina | +2.4% | +2,871 | +5.8% | +6,645 | 121,469 | 118,598 | 114,824 |
| West Palm Beach, Florida | +2.4% | +2,930 | +5.8% | +6,808 | 124,130 | 121,200 | 117,322 |
| Atlanta, Georgia | +2.4% | +12,052 | +2.4% | +12,087 | 510,823 | 498,771 | 498,736 |
| Odessa, Texas | +2.4% | +2,714 | +1.1% | +1,292 | 115,743 | 113,029 | 114,451 |
| Suffolk, Virginia | +2.3% | +2,233 | +6.7% | +6,289 | 100,659 | 98,426 | 94,370 |
| Clarksville, Tennessee | +2.2% | +3,969 | +8.4% | +13,974 | 180,716 | 176,747 | 166,742 |
| Fort Worth, Texas | +2.2% | +21,365 | +6.5% | +59,561 | 978,468 | 957,103 | 918,907 |
| Sioux Falls, South Dakota | +2.2% | +4,394 | +7.1% | +13,692 | 206,410 | 202,016 | 192,718 |
| Roseville, California | +2.0% | +3,195 | +7.7% | +11,344 | 159,135 | 155,940 | 147,791 |
| Fayetteville, Arkansas | +2.0% | +1,992 | +7.8% | +7,368 | 101,680 | 99,688 | 94,312 |
| St. George, Utah | +2.0% | +2,017 | +9.7% | +9,234 | 104,578 | 102,561 | 95,344 |
| Columbia, South Carolina | +2.0% | +2,740 | +4.1% | +5,606 | 142,416 | 139,676 | 136,810 |
| Fishers, Indiana | +1.9% | +1,944 | +5.1% | +5,048 | 104,094 | 102,150 | 99,046 |
| Raleigh, North Carolina | +1.9% | +8,872 | +3.1% | +14,428 | 482,295 | 473,423 | 467,867 |
| Murfreesboro, Tennessee | +1.9% | +3,028 | +8.3% | +12,646 | 165,430 | 162,402 | 152,784 |
| Henderson, Nevada | +1.8% | +5,992 | +6.3% | +19,984 | 337,305 | 331,313 | 317,321 |
| Rio Rancho, New Mexico | +1.8% | +1,905 | +6.4% | +6,616 | 110,660 | 108,755 | 104,044 |
| Charlotte, North Carolina | +1.7% | +15,607 | +4.2% | +36,682 | 911,311 | 895,704 | 874,629 |
| Lewisville, Texas | +1.7% | +2,277 | +6.3% | +7,877 | 133,553 | 131,276 | 125,676 |
| Santa Clara, California | +1.7% | +2,203 | +2.5% | +3,200 | 131,062 | 128,859 | 127,862 |
| Lakeland, Florida | +1.7% | +1,990 | +8.6% | +9,635 | 122,264 | 120,274 | 112,629 |
| Chattanooga, Tennessee | +1.6% | +2,992 | +3.3% | +5,973 | 187,030 | 184,038 | 181,057 |
| Huntsville, Alabama | +1.6% | +3,534 | +4.9% | +10,444 | 225,564 | 222,030 | 215,120 |
| North Las Vegas, Nevada | +1.6% | +4,367 | +9.7% | +25,246 | 284,771 | 280,404 | 259,525 |
| Orlando, Florida | +1.5% | +4,883 | +4.2% | +12,979 | 320,742 | 315,859 | 307,763 |
| San Antonio, Texas | +1.5% | +21,970 | +4.3% | +60,989 | 1,495,295 | 1,473,325 | 1,434,306 |
| Jacksonville, Florida | +1.4% | +14,066 | +3.8% | +36,225 | 985,843 | 971,777 | 949,618 |
| Edinburg, Texas | +1.4% | +1,500 | +5.5% | +5,534 | 105,799 | 104,299 | 100,265 |
| McAllen, Texas | +1.4% | +2,011 | +3.1% | +4,399 | 146,593 | 144,582 | 142,194 |
| Fargo, North Dakota | +1.3% | +1,744 | +5.7% | +7,236 | 133,188 | 131,444 | 125,952 |
| Miami, Florida | +1.3% | +5,910 | +3.1% | +13,664 | 455,924 | 450,014 | 442,260 |
| Concord, North Carolina | +1.3% | +1,426 | +4.6% | +4,812 | 110,119 | 108,693 | 105,307 |
| Wilmington, North Carolina | +1.3% | +1,578 | +6.3% | +7,238 | 122,698 | 121,120 | 115,460 |
| Bend, Oregon | +1.3% | +1,338 | +5.4% | +5,347 | 104,557 | 103,219 | 99,210 |
| Olathe, Kansas | +1.3% | +1,884 | +4.4% | +6,176 | 147,461 | 145,577 | 141,285 |
| Yuma, Arizona | +1.3% | +1,269 | +3.7% | +3,573 | 100,858 | 99,589 | 97,285 |
| Tampa, Florida | +1.3% | +5,039 | +4.9% | +18,702 | 403,364 | 398,325 | 384,662 |
| Abilene, Texas | +1.3% | +1,598 | +3.1% | +3,863 | 129,043 | 127,445 | 125,180 |
| Durham, North Carolina | +1.2% | +3,599 | +4.4% | +12,524 | 296,186 | 292,587 | 283,662 |
| Pompano Beach, Florida | +1.2% | +1,345 | +1.4% | +1,564 | 113,619 | 112,274 | 112,055 |
| Washington, District of Columbia | +1.2% | +8,023 | -1.5% | -10,576 | 678,972 | 670,949 | 689,548 |
| High Point, North Carolina | +1.2% | +1,369 | +2.4% | +2,765 | 116,926 | 115,557 | 114,161 |
| San Bernardino, California | +1.2% | +2,617 | +0.7% | +1,655 | 223,728 | 221,111 | 222,073 |
| Thornton, Colorado | +1.2% | +1,675 | +2.2% | +3,059 | 144,922 | 143,247 | 141,863 |
| Coral Springs, Florida | +1.2% | +1,549 | +0.4% | +510 | 134,906 | 133,357 | 134,396 |
| Antioch, California | +1.1% | +1,316 | +1.6% | +1,791 | 117,096 | 115,780 | 115,305 |
| Broken Arrow, Oklahoma | +1.1% | +1,327 | +5.0% | +5,641 | 119,194 | 117,867 | 113,553 |
| Waco, Texas | +1.1% | +1,578 | +3.3% | +4,694 | 144,816 | 143,238 | 140,122 |
| Oklahoma City, Oklahoma | +1.1% | +7,589 | +3.2% | +21,676 | 702,767 | 695,178 | 681,091 |
| Ontario, California | +1.1% | +1,957 | +4.1% | +7,192 | 182,457 | 180,500 | 175,265 |
| Lubbock, Texas | +1.1% | +2,795 | +3.8% | +9,699 | 266,878 | 264,083 | 257,179 |
| Charleston, South Carolina | +1.1% | +1,624 | +3.3% | +4,959 | 155,369 | 153,745 | 150,410 |
| Davie, Florida | +1.1% | +1,126 | +2.0% | +2,095 | 107,799 | 106,673 | 105,704 |
| Victorville, California | +1.0% | +1,439 | +3.0% | +4,065 | 138,869 | 137,430 | 134,804 |
| Madison, Wisconsin | +1.0% | +2,891 | +2.1% | +5,661 | 280,305 | 277,414 | 274,644 |
| Vancouver, Washington | +1.0% | +1,942 | +2.9% | +5,554 | 196,442 | 194,500 | 190,888 |
| Worcester, Massachusetts | +0.9% | +1,945 | +0.5% | +1,102 | 207,621 | 205,676 | 206,519 |
| Sparks, Nevada | +0.9% | +1,030 | +1.7% | +1,860 | 110,323 | 109,293 | 108,463 |
| Arlington, Texas | +0.9% | +3,684 | +1.1% | +4,166 | 398,431 | 394,747 | 394,265 |
| Salt Lake City, Utah | +0.9% | +1,916 | +4.9% | +9,885 | 209,593 | 207,677 | 199,708 |
| Visalia, California | +0.9% | +1,284 | +2.4% | +3,428 | 144,998 | 143,714 | 141,570 |
| Tyler, Texas | +0.9% | +975 | +4.1% | +4,345 | 110,327 | 109,352 | 105,982 |
| Centennial, Colorado | +0.9% | +939 | -1.4% | -1,542 | 106,883 | 105,944 | 108,425 |
| Nashville-Davidson metropolitan government (balance), Tennessee | +0.8% | +5,658 | -0.2% | -1,666 | 687,788 | 682,130 | 689,454 |
| Miramar, Florida | +0.8% | +1,127 | +2.7% | +3,609 | 138,319 | 137,192 | 134,710 |
| Lincoln, Nebraska | +0.8% | +2,377 | +1.2% | +3,619 | 294,757 | 292,380 | 291,138 |
| Las Cruces, New Mexico | +0.8% | +920 | +3.2% | +3,510 | 114,892 | 113,972 | 111,382 |
| Hollywood, Florida | +0.8% | +1,229 | +0.5% | +824 | 153,859 | 152,630 | 153,035 |
| Spokane Valley, Washington | +0.8% | +858 | +5.1% | +5,252 | 108,235 | 107,377 | 102,983 |
| Seattle, Washington | +0.8% | +5,944 | +2.5% | +18,060 | 755,078 | 749,134 | 737,018 |
| Clovis, California | +0.8% | +953 | +4.7% | +5,672 | 125,826 | 124,873 | 120,154 |
| Lee's Summit, Missouri | +0.7% | +775 | +3.0% | +3,061 | 104,184 | 103,409 | 101,123 |
| Billings, Montana | +0.7% | +888 | +3.2% | +3,714 | 120,864 | 119,976 | 117,150 |
| Pembroke Pines, Florida | +0.7% | +1,255 | 0.0% | -61 | 171,119 | 169,864 | 171,180 |
| Minneapolis, Minnesota | +0.7% | +3,112 | -1.1% | -4,873 | 425,115 | 422,003 | 429,988 |
| College Station, Texas | +0.7% | +912 | +3.9% | +4,668 | 125,192 | 124,280 | 120,524 |
| Columbia, Missouri | +0.7% | +938 | +2.6% | +3,286 | 129,330 | 128,392 | 126,044 |
| League City, Texas | +0.7% | +841 | +1.7% | +1,972 | 116,320 | 115,479 | 114,348 |
| Las Vegas, Nevada | +0.7% | +4,738 | +2.5% | +16,046 | 660,929 | 656,191 | 644,883 |
| Fort Wayne, Indiana | +0.7% | +1,927 | +2.3% | +6,085 | 269,994 | 268,067 | 263,909 |
| Knoxville, Tennessee | +0.7% | +1,414 | +3.9% | +7,480 | 198,162 | 196,748 | 190,682 |
| Glendale, Arizona | +0.7% | +1,794 | +2.2% | +5,452 | 253,855 | 252,061 | 248,403 |
| St. Petersburg, Florida | +0.7% | +1,831 | +2.0% | +5,199 | 263,553 | 261,722 | 258,354 |
| Tuscaloosa, Alabama | +0.7% | +763 | +11.8% | +11,710 | 111,338 | 110,575 | 99,628 |
| Cambridge, Massachusetts | +0.7% | +794 | -0.2% | -181 | 118,214 | 117,420 | 118,395 |
| Fairfield, California | +0.7% | +811 | +0.7% | +894 | 120,768 | 119,957 | 119,874 |
| Jersey City, New Jersey | +0.7% | +1,885 | -0.4% | -1,094 | 291,657 | 289,772 | 292,751 |
| Providence, Rhode Island | +0.6% | +1,225 | -0.1% | -139 | 190,792 | 189,567 | 190,931 |
| Sterling Heights, Michigan | +0.6% | +830 | -0.8% | -1,032 | 133,306 | 132,476 | 134,338 |
| Fort Lauderdale, Florida | +0.6% | +1,137 | +0.8% | +1,478 | 184,255 | 183,118 | 182,777 |
| Laredo, Texas | +0.6% | +1,575 | +0.9% | +2,394 | 257,602 | 256,027 | 255,208 |
| Scottsdale, Arizona | +0.6% | +1,422 | +1.3% | +3,054 | 244,394 | 242,972 | 241,340 |
| Elizabeth, New Jersey | +0.6% | +784 | -1.1% | -1,483 | 135,829 | 135,045 | 137,312 |
| Irvine, California | +0.6% | +1,801 | +2.3% | +6,946 | 314,621 | 312,820 | 307,675 |
| Chesapeake, Virginia | +0.6% | +1,427 | +1.8% | +4,517 | 253,886 | 252,459 | 249,369 |
| Vacaville, California | +0.6% | +570 | +0.1% | +140 | 102,526 | 101,956 | 102,386 |
| Cincinnati, Ohio | +0.5% | +1,692 | +0.5% | +1,530 | 311,097 | 309,405 | 309,567 |
| Columbus, Ohio | +0.5% | +4,937 | +0.8% | +7,236 | 913,175 | 908,238 | 905,939 |
| Fontana, California | +0.5% | +1,148 | +3.4% | +7,063 | 215,465 | 214,317 | 208,402 |
| Pearland, Texas | +0.5% | +675 | +1.5% | +1,923 | 127,736 | 127,061 | 125,813 |
| Tacoma, Washington | +0.5% | +1,175 | +1.7% | +3,721 | 222,906 | 221,731 | 219,185 |
| Amarillo, Texas | +0.5% | +1,042 | +1.0% | +2,030 | 202,408 | 201,366 | 200,378 |
| Houston, Texas | +0.5% | +11,669 | +0.6% | +13,324 | 2,314,157 | 2,302,488 | 2,300,833 |
| Reno, Nevada | +0.5% | +1,368 | +4.1% | +10,769 | 274,915 | 273,547 | 264,146 |
| Hialeah, Florida | +0.5% | +1,095 | -0.8% | -1,823 | 221,300 | 220,205 | 223,123 |
| Greensboro, North Carolina | +0.5% | +1,491 | +1.0% | +3,114 | 302,296 | 300,805 | 299,182 |
| Winston-Salem, North Carolina | +0.5% | +1,229 | +1.4% | +3,417 | 252,975 | 251,746 | 249,558 |
| Peoria, Arizona | +0.5% | +964 | +4.1% | +7,759 | 198,750 | 197,786 | 190,991 |
| Brownsville, Texas | +0.5% | +922 | +1.8% | +3,439 | 190,158 | 189,236 | 186,719 |
| Colorado Springs, Colorado | +0.5% | +2,360 | +2.0% | +9,643 | 488,664 | 486,304 | 479,021 |
| Austin, Texas | +0.5% | +4,464 | +1.9% | +17,989 | 979,882 | 975,418 | 961,893 |
| Oakland, California | +0.4% | +1,936 | -0.9% | -4,165 | 436,504 | 434,568 | 440,669 |
| Denver, Colorado | +0.4% | +3,124 | +0.1% | +1,053 | 716,577 | 713,453 | 715,524 |
| Dallas, Texas | +0.4% | +5,510 | -0.1% | -1,314 | 1,302,868 | 1,297,358 | 1,304,182 |
| Rochester, Minnesota | +0.4% | +517 | +0.8% | +1,021 | 122,413 | 121,896 | 121,392 |
| Hillsboro, Oregon | +0.4% | +449 | +1.2% | +1,291 | 107,730 | 107,281 | 106,439 |
| Renton, Washington | +0.4% | +424 | -2.2% | -2,348 | 104,491 | 104,067 | 106,839 |
| Richmond, Virginia | +0.4% | +880 | +1.2% | +2,699 | 229,247 | 228,367 | 226,548 |
| Phoenix, Arizona | +0.4% | +6,171 | +2.6% | +41,855 | 1,650,070 | 1,643,899 | 1,608,215 |
| Gainesville, Florida | +0.4% | +536 | +3.3% | +4,675 | 145,812 | 145,276 | 141,137 |
| Norman, Oklahoma | +0.4% | +467 | +1.6% | +2,059 | 130,046 | 129,579 | 127,987 |
| Lynn, Massachusetts | +0.4% | +362 | 0.0% | -23 | 101,241 | 100,879 | 101,264 |
| Moreno Valley, California | +0.4% | +744 | +1.8% | +3,752 | 212,392 | 211,648 | 208,640 |
| Waterbury, Connecticut | +0.4% | +402 | +0.5% | +535 | 114,990 | 114,588 | 114,455 |
| Albany, New York | +0.3% | +344 | +2.0% | +1,989 | 101,228 | 100,884 | 99,239 |
| Little Rock, Arkansas | +0.3% | +666 | +0.6% | +1,278 | 203,842 | 203,176 | 202,564 |
| Aurora, Colorado | +0.3% | +1,258 | +2.3% | +8,727 | 395,052 | 393,794 | 386,325 |
| Kansas City, Missouri | +0.3% | +1,575 | +0.5% | +2,726 | 510,704 | 509,129 | 507,978 |
| Grand Prairie, Texas | +0.3% | +595 | +3.1% | +5,995 | 202,134 | 201,539 | 196,139 |
| Detroit, Michigan | +0.3% | +1,852 | -1.0% | -6,257 | 633,218 | 631,366 | 639,475 |
| New Haven, Connecticut | +0.3% | +387 | +1.0% | +1,293 | 135,319 | 134,932 | 134,026 |
| Corona, California | +0.3% | +435 | +2.0% | +3,083 | 160,238 | 159,803 | 157,155 |
| Bakersfield, California | +0.3% | +1,112 | +2.2% | +8,933 | 413,381 | 412,269 | 404,448 |
| Boulder, Colorado | +0.3% | +278 | -2.2% | -2,356 | 105,898 | 105,620 | 108,254 |
| Modesto, California | +0.3% | +571 | +0.2% | +428 | 218,915 | 218,344 | 218,487 |
| South Bend, Indiana | +0.3% | +269 | 0.0% | -41 | 103,395 | 103,126 | 103,436 |
| Killeen, Texas | +0.3% | +412 | +4.2% | +6,500 | 159,643 | 159,231 | 153,143 |
| Tallahassee, Florida | +0.2% | +503 | +3.1% | +6,041 | 202,221 | 201,718 | 196,180 |
| Macon-Bibb County, Georgia | +0.2% | +386 | -0.5% | -835 | 156,512 | 156,126 | 157,347 |
| Elk Grove, California | +0.2% | +435 | +1.3% | +2,306 | 178,444 | 178,009 | 176,138 |
| Orange, California | +0.2% | +334 | -1.1% | -1,567 | 138,337 | 138,003 | 139,904 |
| Joliet, Illinois | +0.2% | +333 | +0.1% | +96 | 150,489 | 150,156 | 150,393 |
| Simi Valley, California | +0.2% | +264 | -1.0% | -1,254 | 125,113 | 124,849 | 126,367 |
| Berkeley, California | +0.2% | +247 | -4.3% | -5,364 | 118,962 | 118,715 | 124,326 |
| Sacramento, California | +0.2% | +1,087 | +0.3% | +1,459 | 526,384 | 525,297 | 524,925 |
| Fayetteville, North Carolina | +0.2% | +428 | +0.6% | +1,276 | 209,749 | 209,321 | 208,473 |
| Jurupa Valley, California | +0.2% | +208 | +2.2% | +2,269 | 107,321 | 107,113 | 105,052 |
| Sunnyvale, California | +0.2% | +285 | -2.4% | -3,660 | 151,967 | 151,682 | 155,627 |
| El Paso, Texas | +0.2% | +1,170 | +0.0% | +96 | 678,958 | 677,788 | 678,862 |
| Athens-Clarke County unified government (balance), Georgia | +0.2% | +214 | +1.0% | +1,266 | 128,628 | 128,414 | 127,362 |
| Tempe, Arizona | +0.2% | +314 | +3.1% | +5,621 | 189,834 | 189,520 | 184,213 |
| Carmel, Indiana | +0.2% | +168 | +2.6% | +2,544 | 102,296 | 102,128 | 99,752 |
| Elgin, Illinois | +0.2% | +179 | -1.3% | -1,500 | 113,310 | 113,131 | 114,810 |
| Fort Collins, Colorado | +0.2% | +262 | +0.3% | +550 | 170,376 | 170,114 | 169,826 |
| Plano, Texas | +0.2% | +440 | +1.7% | +4,725 | 290,190 | 289,750 | 285,465 |
| Pittsburgh, Pennsylvania | +0.2% | +456 | +0.1% | +300 | 303,255 | 302,799 | 302,955 |
| San Francisco, California | +0.2% | +1,214 | -7.4% | -64,962 | 808,988 | 807,774 | 873,950 |
| Naperville, Illinois | +0.1% | +221 | +0.5% | +694 | 150,245 | 150,024 | 149,551 |
| San Buenaventura (Ventura), California | +0.1% | +158 | -1.5% | -1,680 | 109,058 | 108,900 | 110,738 |
| Hesperia, California | +0.1% | +144 | +0.8% | +795 | 100,633 | 100,489 | 99,838 |
| Corpus Christi, Texas | +0.1% | +448 | -0.4% | -1,268 | 316,595 | 316,147 | 317,863 |
| Tucson, Arizona | +0.1% | +739 | +0.8% | +4,581 | 547,239 | 546,500 | 542,658 |
| Newark, New Jersey | +0.1% | +408 | -2.1% | -6,593 | 304,960 | 304,552 | 311,553 |
| Akron, Ohio | +0.1% | +229 | -0.9% | -1,717 | 188,701 | 188,472 | 190,418 |
| Alexandria, Virginia | +0.1% | +185 | -2.7% | -4,234 | 155,230 | 155,045 | 159,464 |
| Miami Gardens, Florida | +0.1% | +131 | -0.8% | -919 | 110,717 | 110,586 | 111,636 |
| Stamford, Connecticut | +0.1% | +142 | +0.6% | +775 | 136,226 | 136,084 | 135,451 |
| Lafayette, Louisiana | +0.1% | +124 | +0.1% | +67 | 121,467 | 121,343 | 121,400 |
| Springfield, Missouri | +0.1% | +160 | +0.6% | +1,018 | 170,188 | 170,028 | 169,170 |
| Lowell, Massachusetts | +0.1% | +105 | -1.1% | -1,257 | 114,296 | 114,191 | 115,553 |
| Westminster, Colorado | +0.1% | +104 | -1.5% | -1,726 | 114,875 | 114,771 | 116,601 |
| Boston, Massachusetts | +0.1% | +590 | -3.7% | -24,784 | 653,833 | 653,243 | 678,617 |
| Fresno, California | +0.1% | +463 | +0.6% | +3,468 | 545,716 | 545,253 | 542,248 |
| Cary, North Carolina | +0.1% | +143 | +3.0% | +5,226 | 180,010 | 179,867 | 174,784 |
| San Diego, California | +0.1% | +942 | +0.1% | +1,348 | 1,388,320 | 1,387,378 | 1,386,972 |
| Irving, Texas | +0.1% | +164 | -0.9% | -2,318 | 254,373 | 254,209 | 256,691 |
| New Bedford, Massachusetts | +0.1% | +62 | -0.4% | -393 | 100,695 | 100,633 | 101,088 |
| Gilbert, Arizona | +0.1% | +156 | +2.8% | +7,480 | 275,411 | 275,255 | 267,931 |
| Allen, Texas | +0.0% | +45 | +6.7% | +6,974 | 111,620 | 111,575 | 104,646 |
| Tulsa, Oklahoma | +0.0% | +146 | -0.3% | -1,250 | 411,894 | 411,748 | 413,144 |
| Davenport, Iowa | +0.0% | +15 | -1.3% | -1,373 | 100,354 | 100,339 | 101,727 |
| Eugene, Oregon | +0.0% | +26 | +0.4% | +674 | 177,899 | 177,873 | 177,225 |
| Wichita, Kansas | +0.0% | +56 | -0.4% | -1,428 | 396,119 | 396,063 | 397,547 |
| Brockton, Massachusetts | 0.0% | -1 | -0.7% | -769 | 104,890 | 104,891 | 105,659 |
| Wichita Falls, Texas | 0.0% | -8 | +0.4% | +403 | 102,691 | 102,699 | 102,288 |
| Paterson, New Jersey | 0.0% | -18 | -2.1% | -3,308 | 156,452 | 156,470 | 159,760 |
| Arvada, Colorado | 0.0% | -16 | -2.4% | -2,929 | 121,414 | 121,430 | 124,343 |
| Topeka, Kansas | 0.0% | -24 | -0.9% | -1,135 | 125,475 | 125,499 | 126,610 |
| Lakewood, Colorado | 0.0% | -40 | 0.0% | -12 | 155,961 | 156,001 | 155,973 |
| Santa Ana, California | 0.0% | -109 | 0.0% | -18 | 310,539 | 310,648 | 310,557 |
| Lexington-Fayette urban county, Kentucky | 0.0% | -127 | -0.7% | -2,410 | 320,154 | 320,281 | 322,564 |
| Cleveland, Ohio | 0.0% | -150 | -2.7% | -9,940 | 362,656 | 362,806 | 372,596 |
| Riverside, California | 0.0% | -133 | +1.2% | +3,843 | 318,858 | 318,991 | 315,015 |
| Fremont, California | 0.0% | -97 | -1.9% | -4,286 | 226,208 | 226,305 | 230,494 |
| Bridgeport, Connecticut | 0.0% | -66 | -0.4% | -614 | 148,028 | 148,094 | 148,642 |
| Los Angeles, California | 0.0% | -1,868 | -2.0% | -77,927 | 3,820,914 | 3,822,782 | 3,898,841 |
| Salem, Oregon | -0.1% | -91 | +1.1% | +1,954 | 177,432 | 177,523 | 175,478 |
| Beaumont, Texas | -0.1% | -87 | -2.6% | -2,943 | 112,193 | 112,280 | 115,136 |
| West Covina, California | -0.1% | -86 | -3.5% | -3,886 | 105,617 | 105,703 | 109,503 |
| Santa Maria, California | -0.1% | -101 | +0.3% | +290 | 109,987 | 110,088 | 109,697 |
| South Fulton, Georgia | -0.1% | -110 | +2.7% | +2,870 | 110,920 | 111,030 | 108,050 |
| Louisville/Jefferson County metro government (balance), Kentucky | -0.1% | -649 | -1.4% | -8,995 | 622,981 | 623,630 | 631,976 |
| Mesa, Arizona | -0.1% | -616 | +1.5% | +7,352 | 511,648 | 512,264 | 504,296 |
| Birmingham, Alabama | -0.1% | -243 | -2.0% | -4,013 | 196,644 | 196,887 | 200,657 |
| Indianapolis city (balance), Indiana | -0.1% | -1,104 | -0.9% | -8,355 | 879,293 | 880,397 | 887,648 |
| Independence, Missouri | -0.1% | -157 | -1.6% | -2,001 | 120,922 | 121,079 | 122,923 |
| Santa Rosa, California | -0.1% | -233 | -1.3% | -2,278 | 175,845 | 176,078 | 178,123 |
| Clearwater, Florida | -0.1% | -155 | -0.5% | -578 | 116,850 | 117,005 | 117,428 |
| Lansing, Michigan | -0.1% | -158 | -0.5% | -546 | 112,115 | 112,273 | 112,661 |
| Hartford, Connecticut | -0.2% | -182 | -1.1% | -1,350 | 119,669 | 119,851 | 121,019 |
| Savannah, Georgia | -0.2% | -232 | 0.0% | -26 | 147,748 | 147,980 | 147,774 |
| Temecula, California | -0.2% | -178 | +0.6% | +688 | 110,682 | 110,860 | 109,994 |
| Allentown, Pennsylvania | -0.2% | -208 | -0.8% | -975 | 124,880 | 125,088 | 125,855 |
| Murrieta, California | -0.2% | -198 | +0.8% | +924 | 111,878 | 112,076 | 110,954 |
| Chula Vista, California | -0.2% | -490 | -0.4% | -1,166 | 274,333 | 274,823 | 275,499 |
| Albuquerque, New Mexico | -0.2% | -1,094 | -0.8% | -4,310 | 560,274 | 561,368 | 564,584 |
| Kansas City, Kansas | -0.2% | -305 | -2.3% | -3,676 | 152,933 | 153,238 | 156,609 |
| St. Paul, Minnesota | -0.2% | -616 | -2.5% | -7,696 | 303,820 | 304,436 | 311,516 |
| Aurora, Illinois | -0.2% | -368 | -1.6% | -2,967 | 177,563 | 177,931 | 180,530 |
| Quincy, Massachusetts | -0.2% | -217 | 0.0% | -17 | 101,597 | 101,814 | 101,614 |
| Springfield, Massachusetts | -0.2% | -335 | -1.4% | -2,257 | 153,672 | 154,007 | 155,929 |
| Chandler, Arizona | -0.2% | -611 | +1.5% | +4,156 | 280,167 | 280,778 | 276,011 |
| Mesquite, Texas | -0.2% | -329 | -1.9% | -2,908 | 147,317 | 147,646 | 150,225 |
| Dayton, Ohio | -0.2% | -316 | -1.5% | -2,113 | 135,512 | 135,828 | 137,625 |
| San Mateo, California | -0.2% | -240 | -4.1% | -4,338 | 101,327 | 101,567 | 105,665 |
| San Jose, California | -0.2% | -2,427 | -4.3% | -43,586 | 969,655 | 972,082 | 1,013,241 |
| Manchester, New Hampshire | -0.3% | -293 | -0.2% | -178 | 115,474 | 115,767 | 115,652 |
| Evansville, Indiana | -0.3% | -312 | -1.7% | -1,960 | 115,332 | 115,644 | 117,292 |
| Columbus, Georgia | -0.3% | -555 | -2.4% | -5,042 | 201,877 | 202,432 | 206,919 |
| Peoria, Illinois | -0.3% | -317 | -2.4% | -2,714 | 110,460 | 110,777 | 113,174 |
| Grand Rapids, Michigan | -0.3% | -584 | -1.1% | -2,282 | 196,608 | 197,192 | 198,890 |
| Provo, Utah | -0.3% | -346 | -1.6% | -1,827 | 113,343 | 113,689 | 115,170 |
| Pueblo, Colorado | -0.3% | -341 | -0.7% | -794 | 111,077 | 111,418 | 111,871 |
| Chicago, Illinois | -0.3% | -8,208 | -3.0% | -81,900 | 2,664,452 | 2,672,660 | 2,746,352 |
| Overland Park, Kansas | -0.3% | -616 | -0.1% | -160 | 197,089 | 197,705 | 197,249 |
| Virginia Beach, Virginia | -0.3% | -1,420 | -1.3% | -5,827 | 453,649 | 455,069 | 459,476 |
| Des Moines, Iowa | -0.3% | -667 | -1.7% | -3,743 | 210,381 | 211,048 | 214,124 |
| Anchorage, Alaska | -0.3% | -908 | -1.8% | -5,169 | 286,075 | 286,983 | 291,244 |
| Cedar Rapids, Iowa | -0.3% | -434 | -1.3% | -1,770 | 135,958 | 136,392 | 137,728 |
| Rancho Cucamonga, California | -0.3% | -584 | -0.1% | -220 | 174,405 | 174,989 | 174,625 |
| Warren, Michigan | -0.3% | -470 | -2.0% | -2,742 | 136,655 | 137,125 | 139,397 |
| Green Bay, Wisconsin | -0.4% | -377 | -1.5% | -1,627 | 105,744 | 106,121 | 107,371 |
| Rockford, Illinois | -0.4% | -526 | -1.9% | -2,804 | 146,120 | 146,646 | 148,924 |
| Yonkers, New York | -0.4% | -749 | -1.9% | -3,927 | 207,657 | 208,406 | 211,584 |
| Everett, Washington | -0.4% | -404 | +0.5% | +574 | 111,180 | 111,584 | 110,606 |
| Omaha, Nebraska | -0.4% | -1,797 | -1.7% | -8,535 | 483,335 | 485,132 | 491,870 |
| Mobile, Alabama | -0.4% | -695 | -2.4% | -4,448 | 182,595 | 183,290 | 187,043 |
| Toledo, Ohio | -0.4% | -1,046 | -2.1% | -5,576 | 265,304 | 266,350 | 270,880 |
| Buffalo, New York | -0.4% | -1,084 | -1.3% | -3,612 | 274,678 | 275,762 | 278,290 |
| Milwaukee, Wisconsin | -0.4% | -2,247 | -2.9% | -16,508 | 561,385 | 563,632 | 577,893 |
| Stockton, California | -0.4% | -1,288 | -0.4% | -1,263 | 319,543 | 320,831 | 320,806 |
| Spokane, Washington | -0.4% | -958 | +0.2% | +469 | 229,447 | 230,405 | 228,978 |
| Rialto, California | -0.4% | -462 | -0.6% | -656 | 103,391 | 103,853 | 104,047 |
| Hayward, California | -0.4% | -696 | -4.5% | -7,272 | 155,675 | 156,371 | 162,947 |
| Chico, California | -0.4% | -457 | -1.9% | -1,976 | 101,301 | 101,758 | 103,277 |
| Ann Arbor, Michigan | -0.5% | -543 | -3.6% | -4,494 | 119,381 | 119,924 | 123,875 |
| Augusta-Richmond County consolidated government (balance), Georgia | -0.5% | -921 | -0.6% | -1,193 | 200,884 | 201,805 | 202,077 |
| Syracuse, New York | -0.5% | -670 | -2.1% | -3,055 | 145,560 | 146,230 | 148,615 |
| Springfield, Illinois | -0.5% | -527 | -1.7% | -1,892 | 112,544 | 113,071 | 114,436 |
| Newport News, Virginia | -0.5% | -862 | -1.7% | -3,127 | 183,118 | 183,980 | 186,245 |
| Urban Honolulu, Hawaii | -0.5% | -1,886 | -2.6% | -9,185 | 341,778 | 343,664 | 350,963 |
| Hampton, Virginia | -0.6% | -760 | 0.0% | -59 | 137,098 | 137,858 | 137,157 |
| Boise City, Idaho | -0.6% | -1,306 | -0.1% | -298 | 235,421 | 236,727 | 235,719 |
| Pomona, California | -0.6% | -831 | -3.9% | -5,968 | 145,502 | 146,333 | 151,470 |
| Rochester, New York | -0.6% | -1,272 | -1.9% | -4,040 | 207,274 | 208,546 | 211,314 |
| Escondido, California | -0.6% | -912 | -2.0% | -2,955 | 148,122 | 149,034 | 151,077 |
| Carrollton, Texas | -0.6% | -866 | -0.4% | -517 | 132,918 | 133,784 | 133,435 |
| Concord, California | -0.6% | -797 | -2.5% | -3,101 | 122,315 | 123,112 | 125,416 |
| Portland, Oregon | -0.7% | -4,170 | -3.4% | -22,023 | 630,498 | 634,668 | 652,521 |
| Anaheim, California | -0.7% | -2,265 | -1.8% | -6,304 | 340,512 | 342,777 | 346,816 |
| Pasadena, Texas | -0.7% | -991 | -3.4% | -5,181 | 146,716 | 147,707 | 151,897 |
| Baltimore, Maryland | -0.7% | -3,868 | -3.5% | -20,451 | 565,239 | 569,107 | 585,690 |
| Carlsbad, California | -0.7% | -780 | -1.1% | -1,242 | 113,495 | 114,275 | 114,737 |
| Garden Grove, California | -0.7% | -1,164 | -2.2% | -3,746 | 168,234 | 169,398 | 171,980 |
| Pasadena, California | -0.7% | -932 | -3.7% | -5,163 | 133,560 | 134,492 | 138,723 |
| Norfolk, Virginia | -0.7% | -1,628 | -3.0% | -7,073 | 230,930 | 232,558 | 238,003 |
| Vallejo, California | -0.7% | -879 | -2.6% | -3,278 | 122,807 | 123,686 | 126,085 |
| Burbank, California | -0.7% | -752 | -4.3% | -4,577 | 102,755 | 103,507 | 107,332 |
| Richmond, California | -0.7% | -838 | -1.9% | -2,218 | 114,106 | 114,944 | 116,324 |
| Baton Rouge, Louisiana | -0.8% | -1,671 | -3.2% | -7,343 | 219,573 | 221,244 | 226,916 |
| Salinas, California | -0.8% | -1,214 | -2.5% | -4,034 | 159,506 | 160,720 | 163,540 |
| Long Beach, California | -0.8% | -3,463 | -3.7% | -17,304 | 449,468 | 452,931 | 466,772 |
| Bellevue, Washington | -0.8% | -1,171 | -0.2% | -293 | 151,574 | 152,745 | 151,867 |
| Gresham, Oregon | -0.8% | -859 | -3.1% | -3,564 | 110,685 | 111,544 | 114,249 |
| Kent, Washington | -0.8% | -1,051 | -2.4% | -3,232 | 133,378 | 134,429 | 136,610 |
| Oceanside, California | -0.8% | -1,388 | -2.3% | -4,039 | 170,020 | 171,408 | 174,059 |
| Fullerton, California | -0.8% | -1,140 | -3.1% | -4,389 | 139,250 | 140,390 | 143,639 |
| Sugar Land, Texas | -0.8% | -899 | -2.3% | -2,511 | 108,515 | 109,414 | 111,026 |
| Memphis, Tennessee | -0.8% | -5,201 | -2.6% | -16,786 | 618,639 | 623,840 | 635,425 |
| Montgomery, Alabama | -0.8% | -1,657 | -2.6% | -5,304 | 195,287 | 196,944 | 200,591 |
| Oxnard, California | -0.9% | -1,705 | -1.8% | -3,583 | 198,488 | 200,193 | 202,071 |
| Thousand Oaks, California | -0.9% | -1,066 | -2.8% | -3,504 | 123,463 | 124,529 | 126,967 |
| New York, New York | -0.9% | -77,763 | -6.2% | -546,164 | 8,258,035 | 8,335,798 | 8,804,199 |
| Lancaster, California | -0.9% | -1,579 | -4.2% | -7,272 | 166,236 | 167,815 | 173,508 |
| Inglewood, California | -0.9% | -982 | -4.5% | -4,900 | 102,865 | 103,847 | 107,765 |
| Garland, Texas | -0.9% | -2,325 | -1.1% | -2,651 | 243,470 | 245,795 | 246,121 |
| Palmdale, California | -1.0% | -1,571 | -4.7% | -8,009 | 161,404 | 162,975 | 169,413 |
| Dearborn, Michigan | -1.0% | -1,071 | -3.8% | -4,150 | 105,811 | 106,882 | 109,961 |
| El Cajon, California | -1.0% | -1,051 | -3.0% | -3,196 | 102,991 | 104,042 | 106,187 |
| Downey, California | -1.0% | -1,116 | -4.8% | -5,538 | 108,816 | 109,932 | 114,354 |
| Philadelphia, Pennsylvania | -1.0% | -16,294 | -3.3% | -53,251 | 1,550,542 | 1,566,836 | 1,603,793 |
| Huntington Beach, California | -1.1% | -2,066 | -3.3% | -6,592 | 192,129 | 194,195 | 198,721 |
| Richardson, Texas | -1.1% | -1,263 | -1.7% | -2,029 | 117,435 | 118,698 | 119,464 |
| Costa Mesa, California | -1.1% | -1,194 | -3.2% | -3,569 | 108,354 | 109,548 | 111,923 |
| Glendale, California | -1.1% | -2,125 | -4.8% | -9,473 | 187,050 | 189,175 | 196,523 |
| Shreveport, Louisiana | -1.2% | -2,127 | -5.1% | -9,642 | 177,959 | 180,086 | 187,601 |
| Torrance, California | -1.2% | -1,677 | -5.3% | -7,731 | 139,224 | 140,901 | 146,955 |
| El Monte, California | -1.2% | -1,258 | -5.2% | -5,651 | 103,794 | 105,052 | 109,445 |
| Santa Clarita, California | -1.4% | -3,095 | -3.8% | -8,776 | 224,028 | 227,123 | 232,804 |
| West Jordan, Utah | -1.4% | -1,689 | -1.8% | -2,055 | 114,908 | 116,597 | 116,963 |
| Jackson, Mississippi | -1.5% | -2,174 | -6.5% | -9,994 | 143,709 | 145,883 | 153,703 |
| St. Louis, Missouri | -1.6% | -4,439 | -6.6% | -19,811 | 281,754 | 286,193 | 301,565 |
| West Valley City, Utah | -1.6% | -2,125 | -4.1% | -5,768 | 134,470 | 136,595 | 140,238 |
| New Orleans, Louisiana | -1.6% | -5,781 | -5.2% | -19,861 | 364,136 | 369,917 | 383,997 |
| Sandy Springs, Georgia | -1.7% | -1,841 | -2.1% | -2,274 | 105,793 | 107,634 | 108,067 |
Figure 1
Figure 2

Figure 3

Figure 4

Figure 5
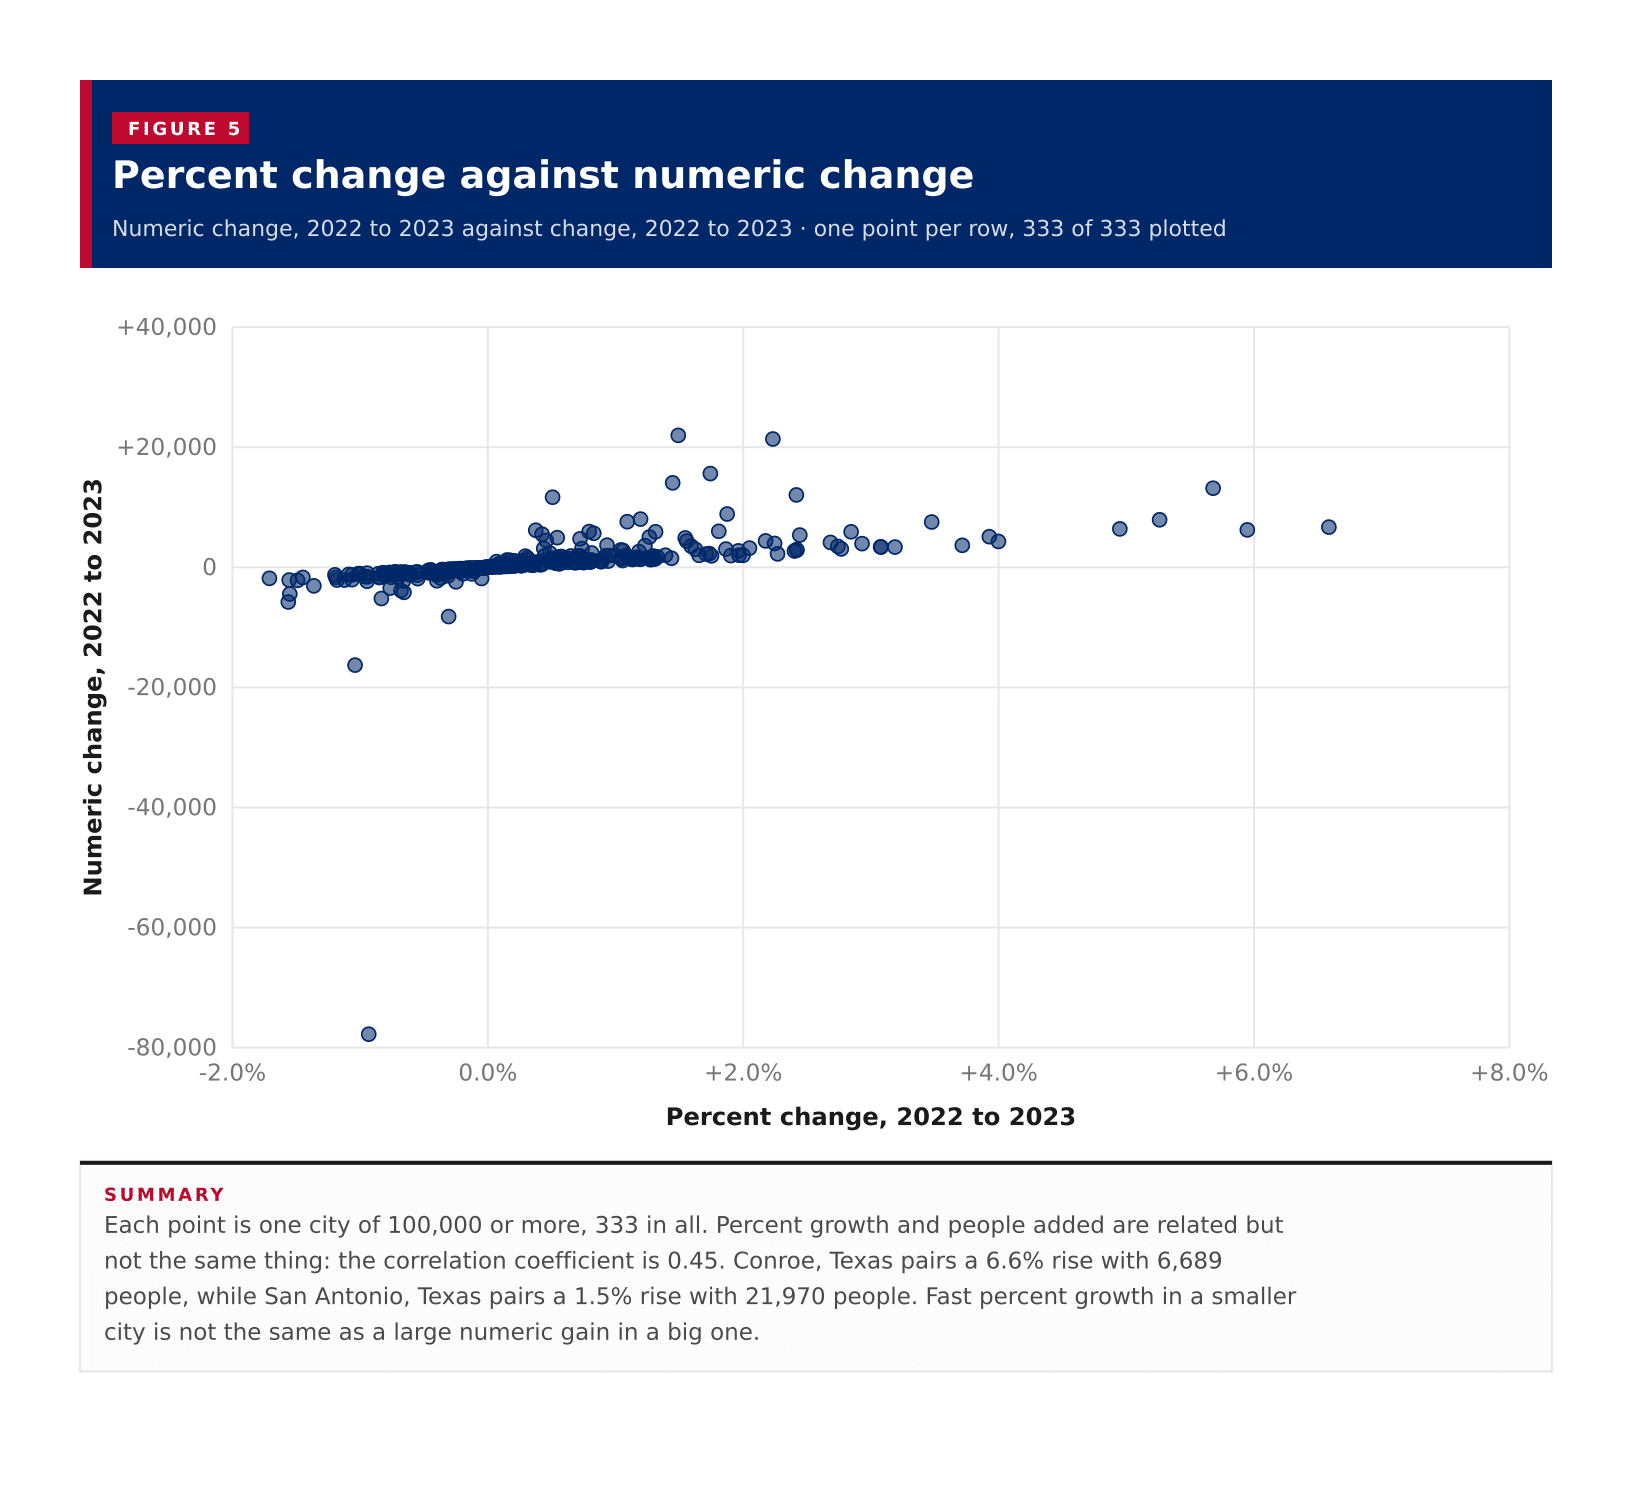
Table 1
