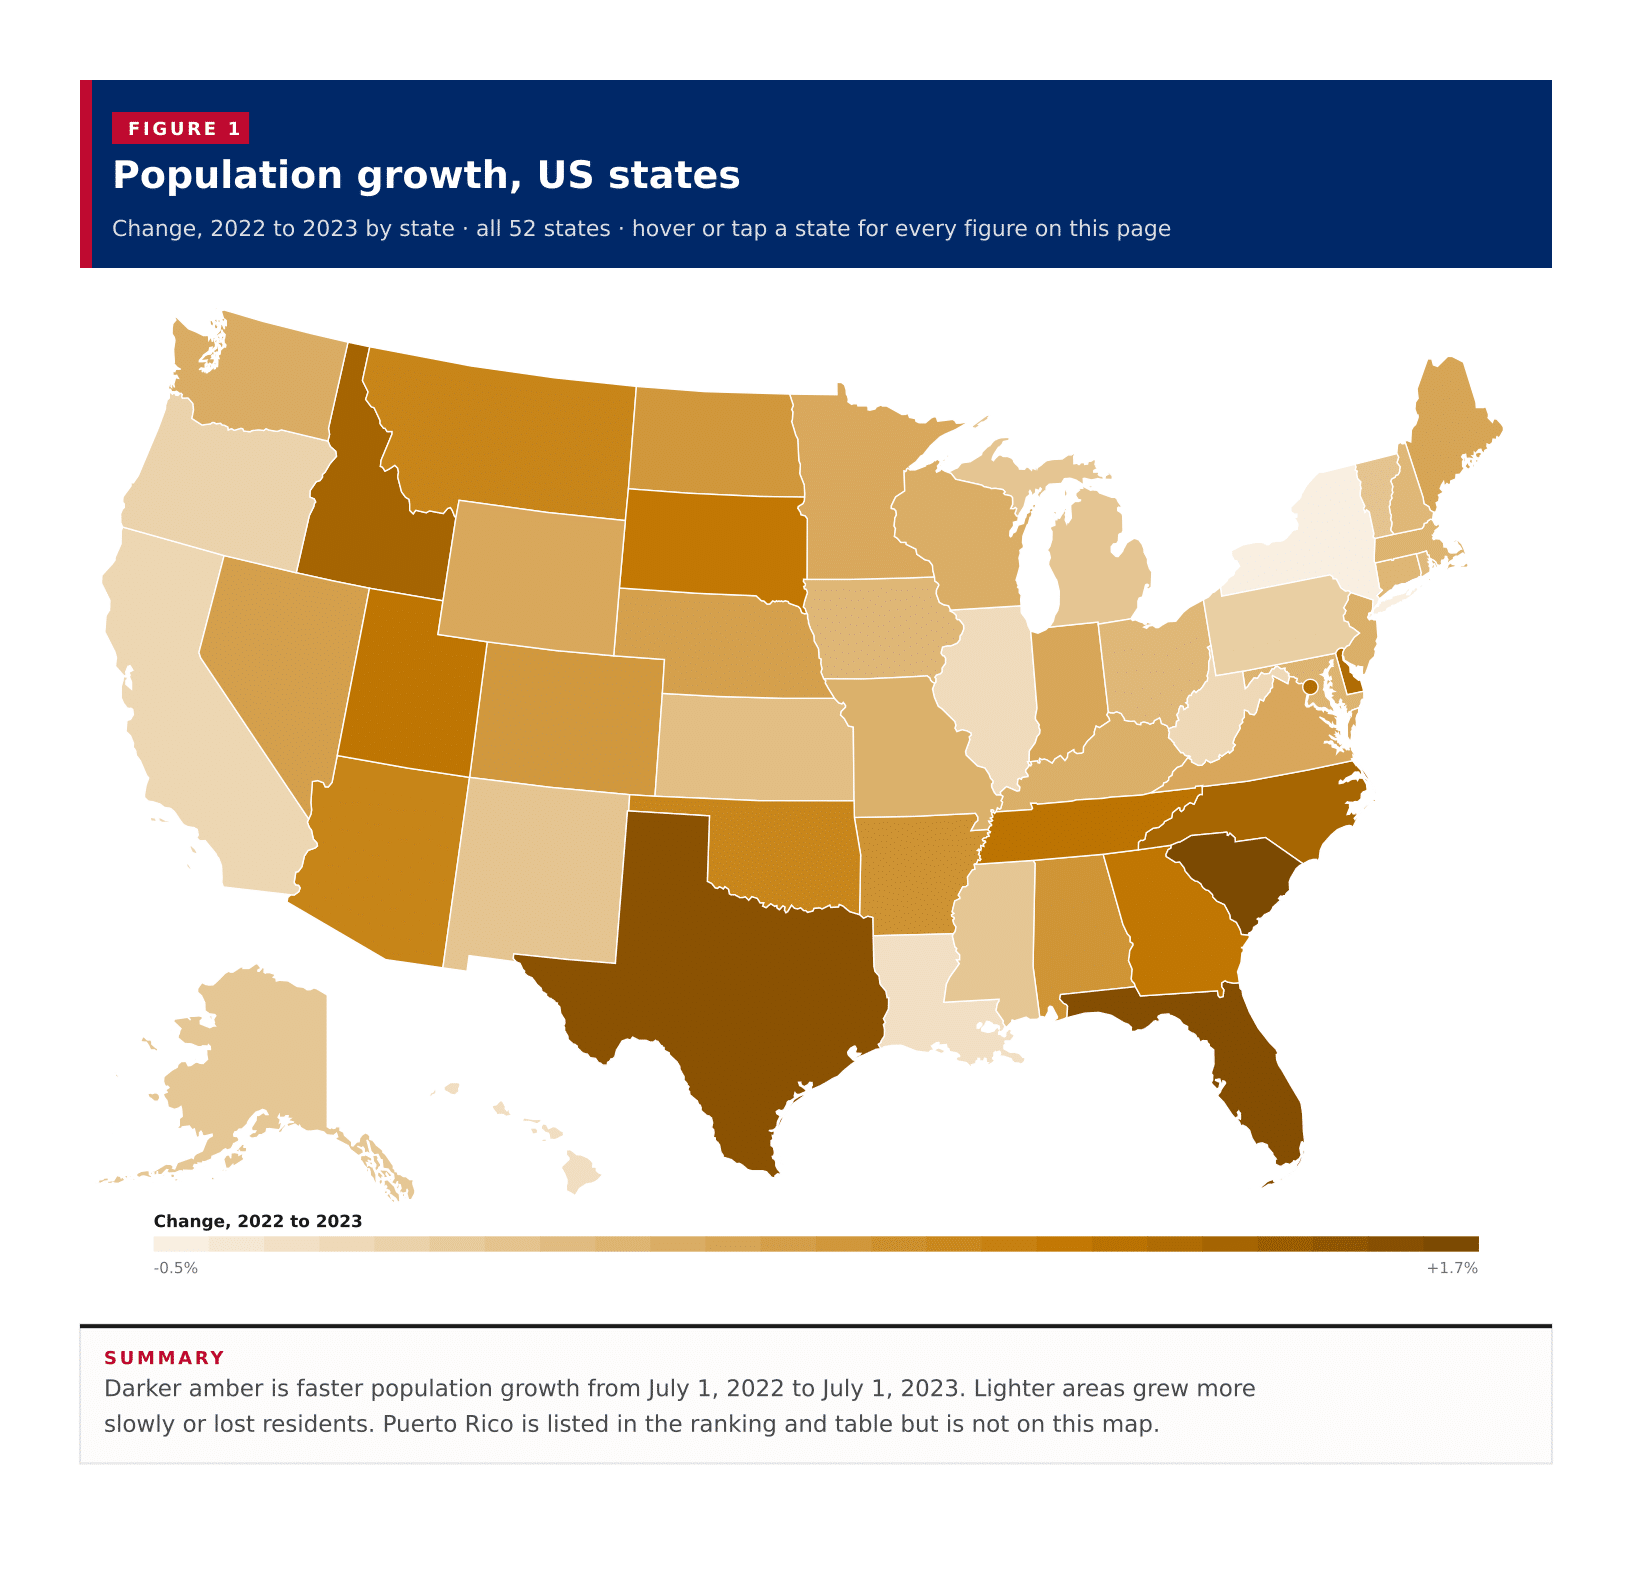
Darker amber is faster population growth from July 1, 2022 to July 1, 2023. Lighter areas grew more slowly or lost residents. Puerto Rico is listed in the ranking and table but is not on this map.
South Carolina grew faster than any other published area from July 1, 2022 to July 1, 2023, adding 90,600 residents, a 1.7 percent rise, on the Census Bureau Vintage 2023 population estimates. Florida grew 1.6 percent and Texas 1.6 percent, and Texas added the most people, 473,453. A typical published area grew 0.4 percent, the midpoint of the 50 states, the District of Columbia and Puerto Rico. Forty-three of the 52 areas gained residents and nine lost them. New York had the steepest decline, down 0.5 percent, or 101,984 people. These are July 1 resident population estimates for each area, not ACS period estimates and not a national growth rate.
In short
1.7%South Carolinafastest percent growth, July 2022 to July 2023
+473,453Texaslargest numeric gain
0.4%typical published areathe middle of the 52 rates, not a national figure
43areas that gained residents9 lost residents over the same year
-0.5%New Yorksteepest decline among published areas
Figure 1
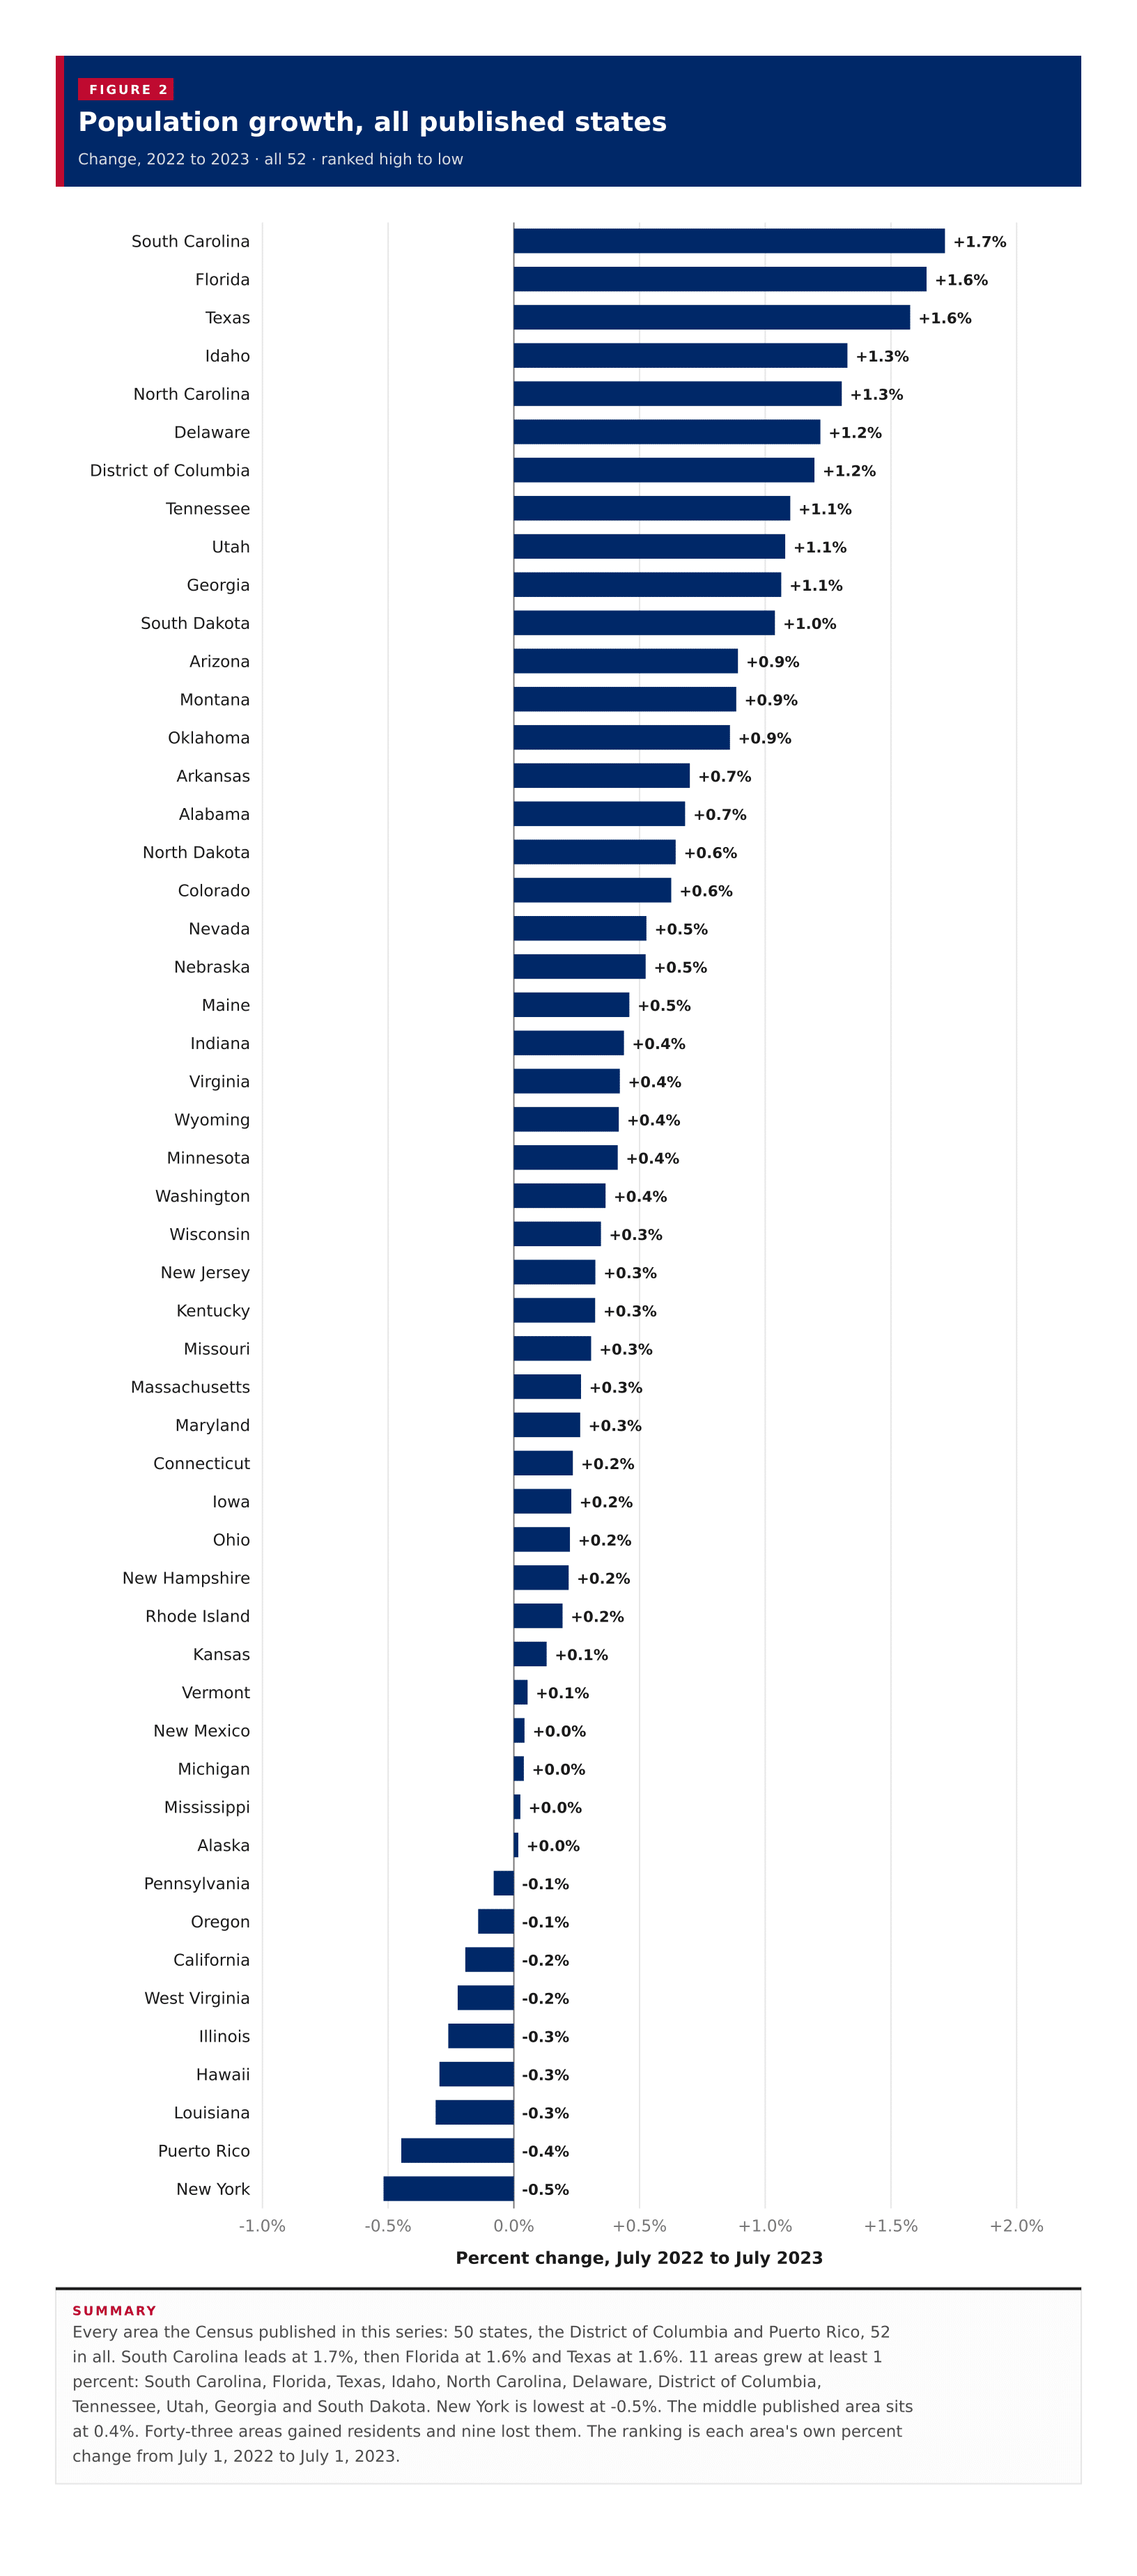
Population growth, all published states
Change, 2022 to 2023 · all 52 · ranked high to low
Every area the Census published in this series: 50 states, the District of Columbia and Puerto Rico, 52 in all. South Carolina leads at 1.7%, then Florida at 1.6% and Texas at 1.6%. 11 areas grew at least 1 percent: South Carolina, Florida, Texas, Idaho, North Carolina, Delaware, District of Columbia, Tennessee, Utah, Georgia and South Dakota. New York is lowest at -0.5%. The middle published area sits at 0.4%. Forty-three areas gained residents and nine lost them. The ranking is each area's own percent change from July 1, 2022 to July 1, 2023.
Figure 2
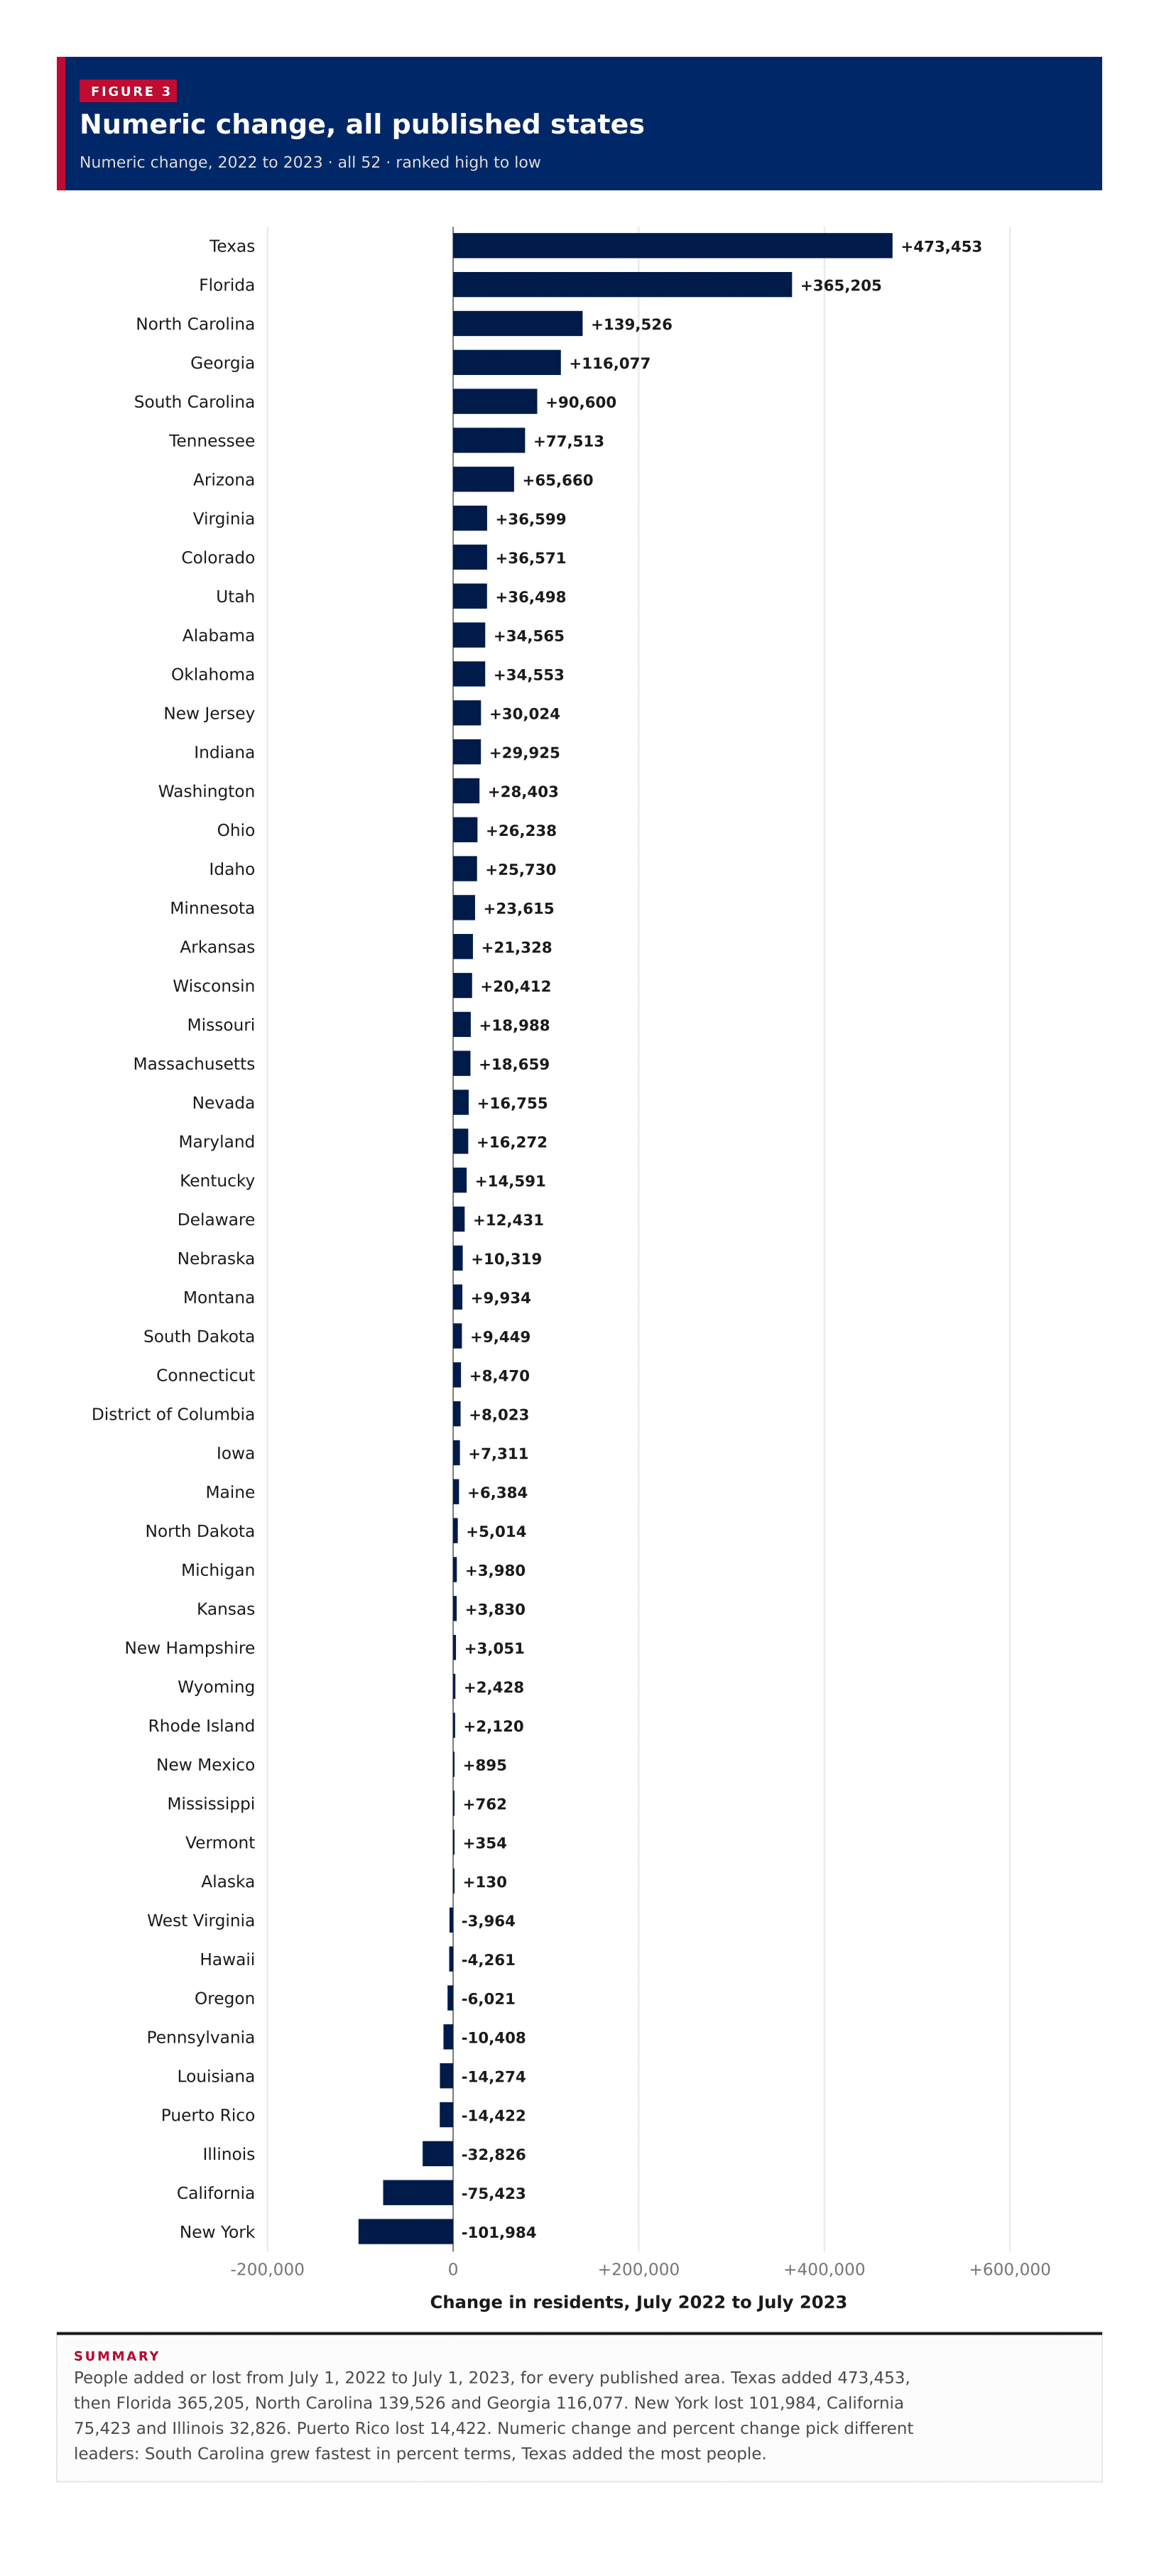
Numeric change, all published states
Numeric change, 2022 to 2023 · all 52 · ranked high to low
People added or lost from July 1, 2022 to July 1, 2023, for every published area. Texas added 473,453, then Florida 365,205, North Carolina 139,526 and Georgia 116,077. New York lost 101,984, California 75,423 and Illinois 32,826. Puerto Rico lost 14,422. Numeric change and percent change pick different leaders: South Carolina grew fastest in percent terms, Texas added the most people.
Figure 3
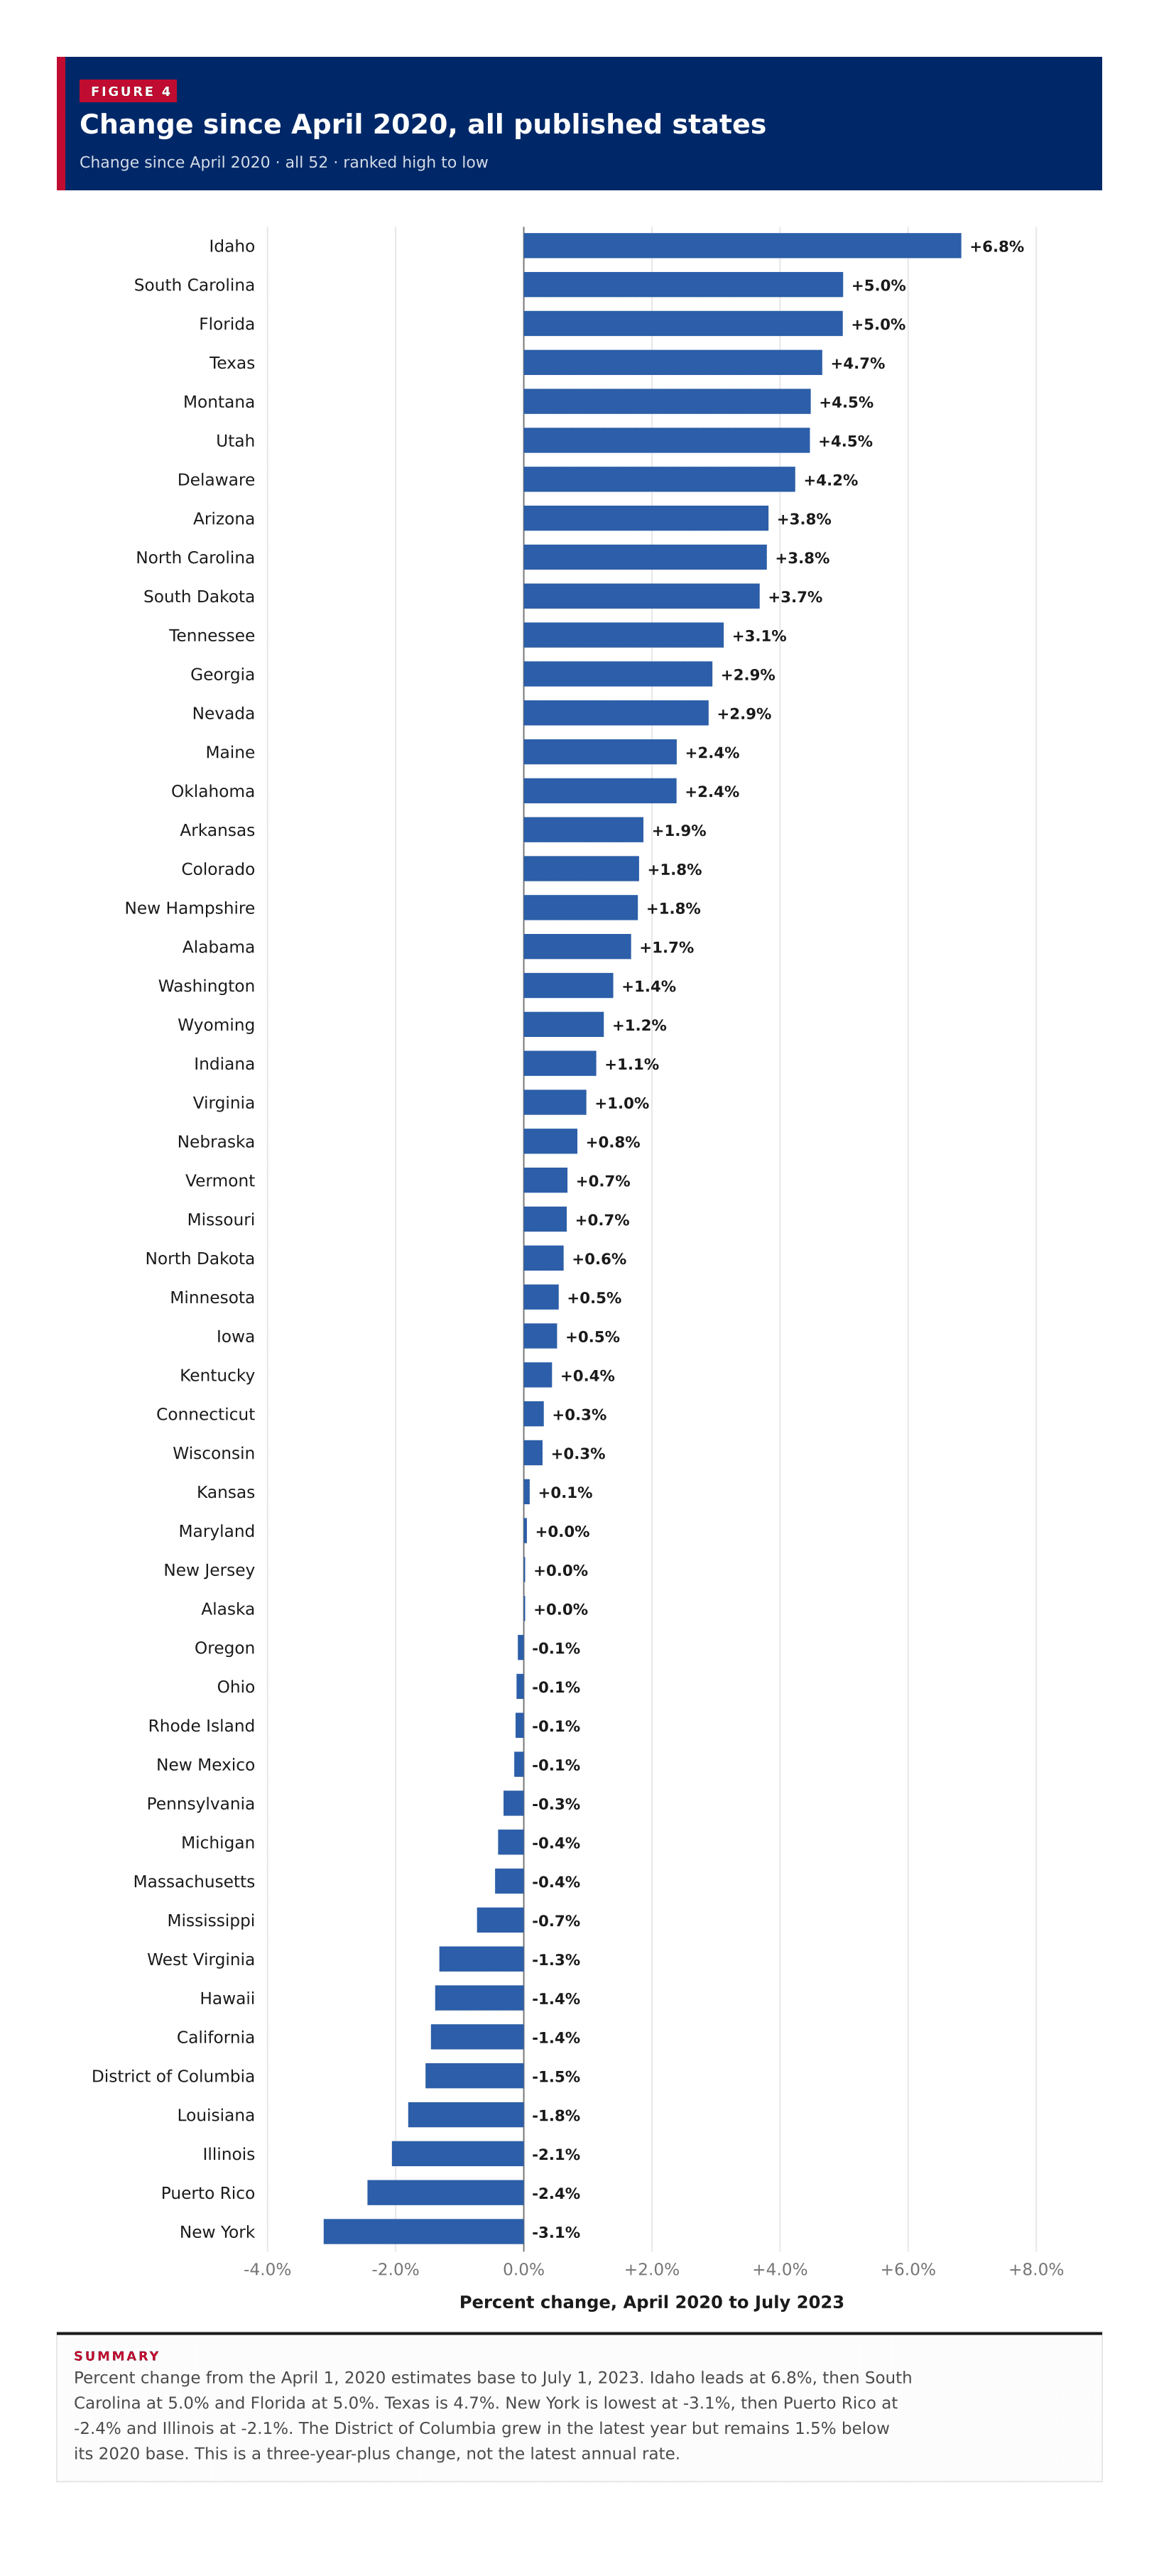
Change since April 2020, all published states
Change since April 2020 · all 52 · ranked high to low
Percent change from the April 1, 2020 estimates base to July 1, 2023. Idaho leads at 6.8%, then South Carolina at 5.0% and Florida at 5.0%. Texas is 4.7%. New York is lowest at -3.1%, then Puerto Rico at -2.4% and Illinois at -2.1%. The District of Columbia grew in the latest year but remains 1.5% below its 2020 base. This is a three-year-plus change, not the latest annual rate.
Figure 4
Percent change against numeric change
Numeric change, 2022 to 2023 against change, 2022 to 2023 · one point per row, 52 of 52 plotted
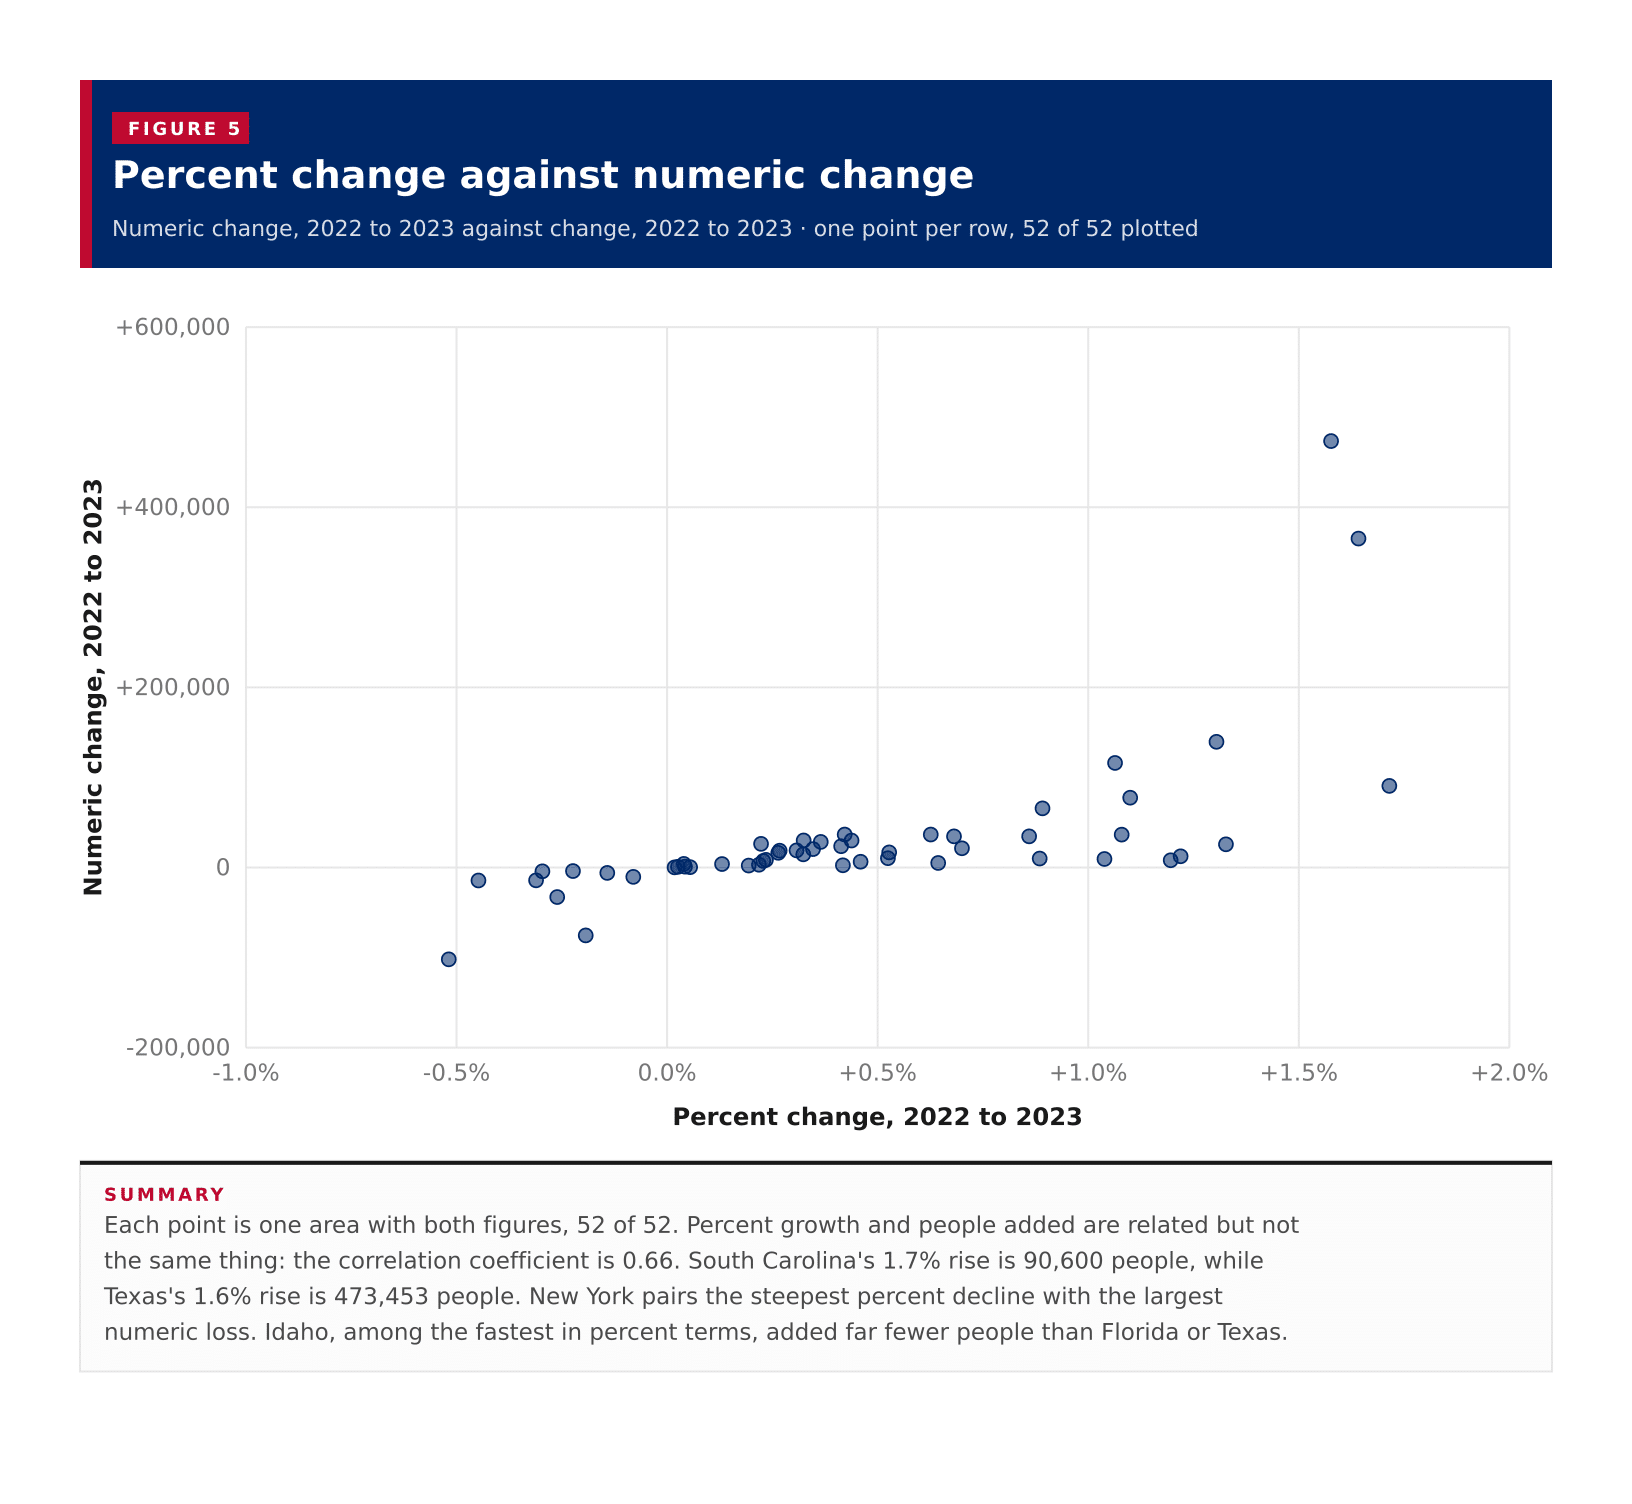
Each point is one area with both figures, 52 of 52. Percent growth and people added are related but not the same thing: the correlation coefficient is 0.66. South Carolina's 1.7% rise is 90,600 people, while Texas's 1.6% rise is 473,453 people. New York pairs the steepest percent decline with the largest numeric loss. Idaho, among the fastest in percent terms, added far fewer people than Florida or Texas.
Table 1
All states
52 rows · 8 columns · sorted by change, 2022 to 2023, high to low
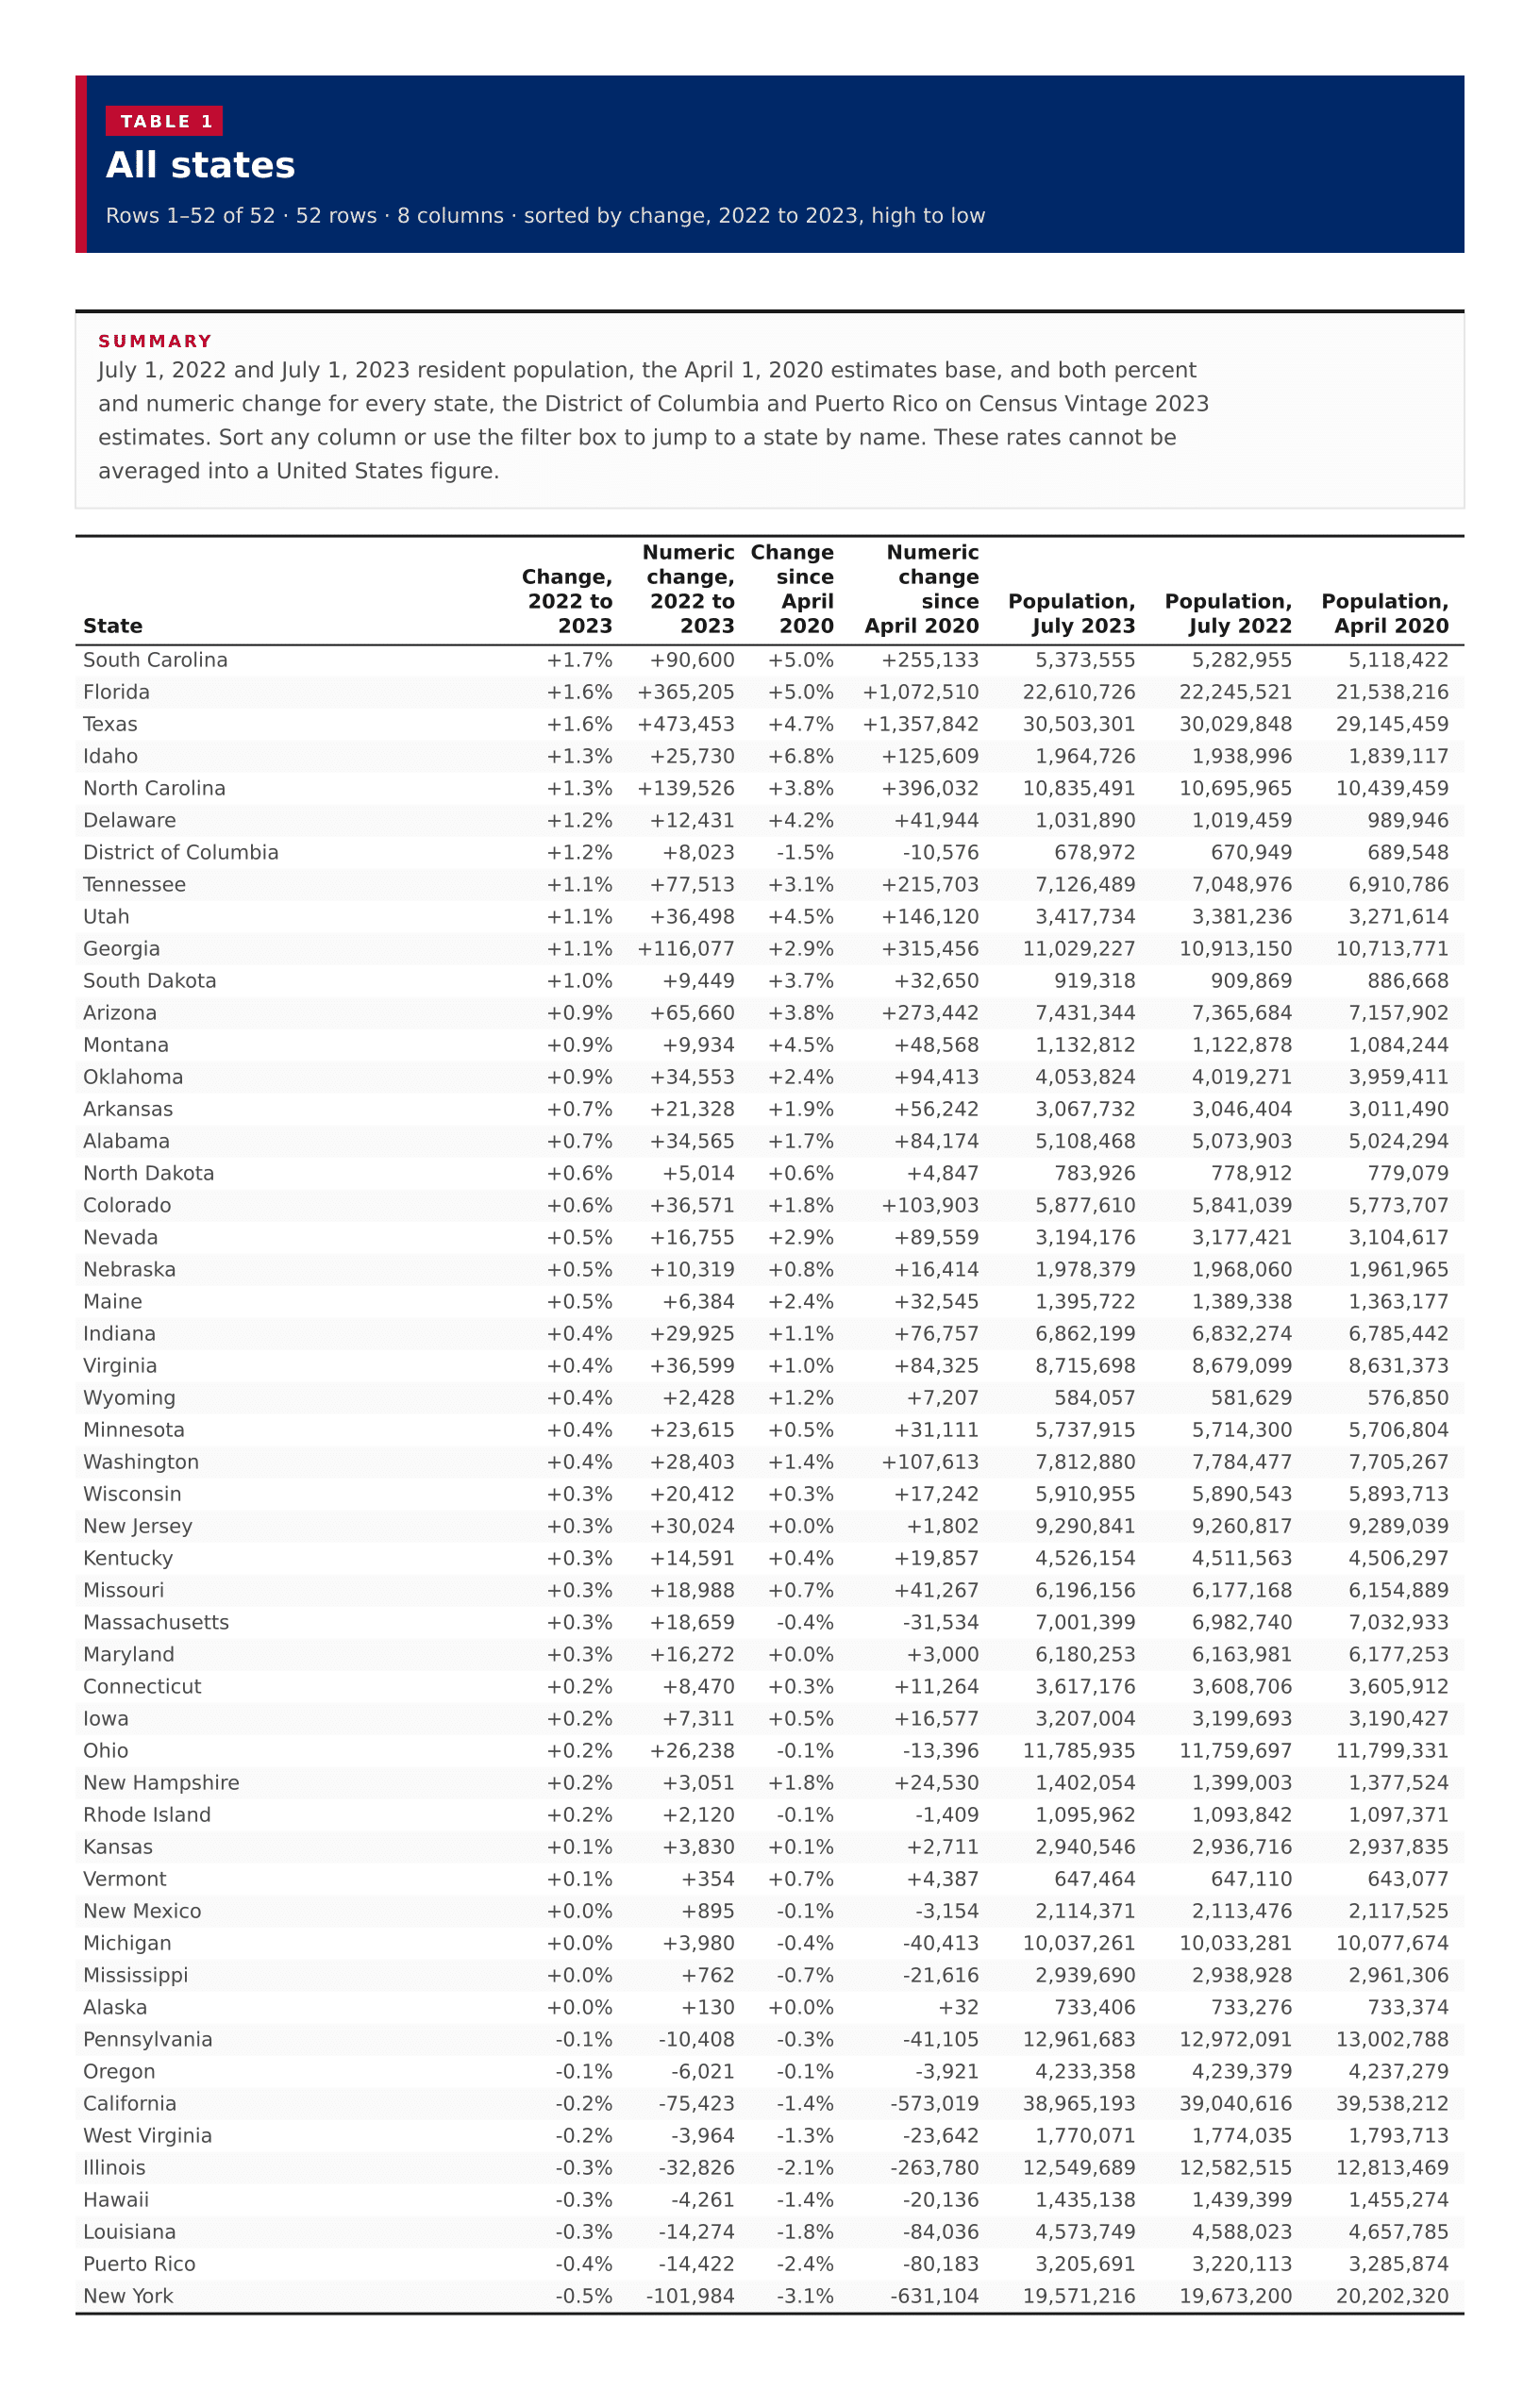
July 1, 2022 and July 1, 2023 resident population, the April 1, 2020 estimates base, and both percent and numeric change for every state, the District of Columbia and Puerto Rico on Census Vintage 2023 estimates. Sort any column or use the filter box to jump to a state by name. These rates cannot be averaged into a United States figure.
The American Community Survey 2023 five-year tables, including B01003 Total Population, are a period estimate for 2019 to 2023. They do not publish a population-change rate. This page uses the Census Population Estimates Program (Vintage 2023) instead.
Resident population is estimated as of July 1 each year. The 2020 column is the April 1, 2020 estimates base, the starting point for this vintage, not the July 1, 2020 estimate.
Percent change from 2022 to 2023 is (July 1, 2023 minus July 1, 2022) divided by the 2022 estimate. Percent change since 2020 uses the April 1, 2020 estimates base as the denominator.
These are administrative estimates, not an ACS sample, so the Census does not publish a sampling margin of error on this series.
A typical published area is the midpoint of the 52 percent-change figures. That midpoint is not a United States growth rate, and the 52 rows cannot be averaged or summed into the national estimate. Puerto Rico is included here.
The District of Columbia grew in the latest year and is still below its April 2020 estimates base. Puerto Rico declined in both the latest year and since 2020.
The Census published 50 states, the District of Columbia and Puerto Rico. None of the estimates were suppressed.
Puerto Rico is in the ranking and table. Alaska and Hawaii appear on the ranking; on the map they are shown in inset.
Newer Population Estimates vintages were not on the Census API when this page was built. Each new vintage revises the whole series back to 2020, so these figures should not be mixed with a later vintage.