Population density by US state

Summary

Population density, US states

People per square mile by state · all 52 states · hover or tap a state for every figure on this page

52 items
View100%
DownloadPDFImageCSV
StatesDistrict of Columbia
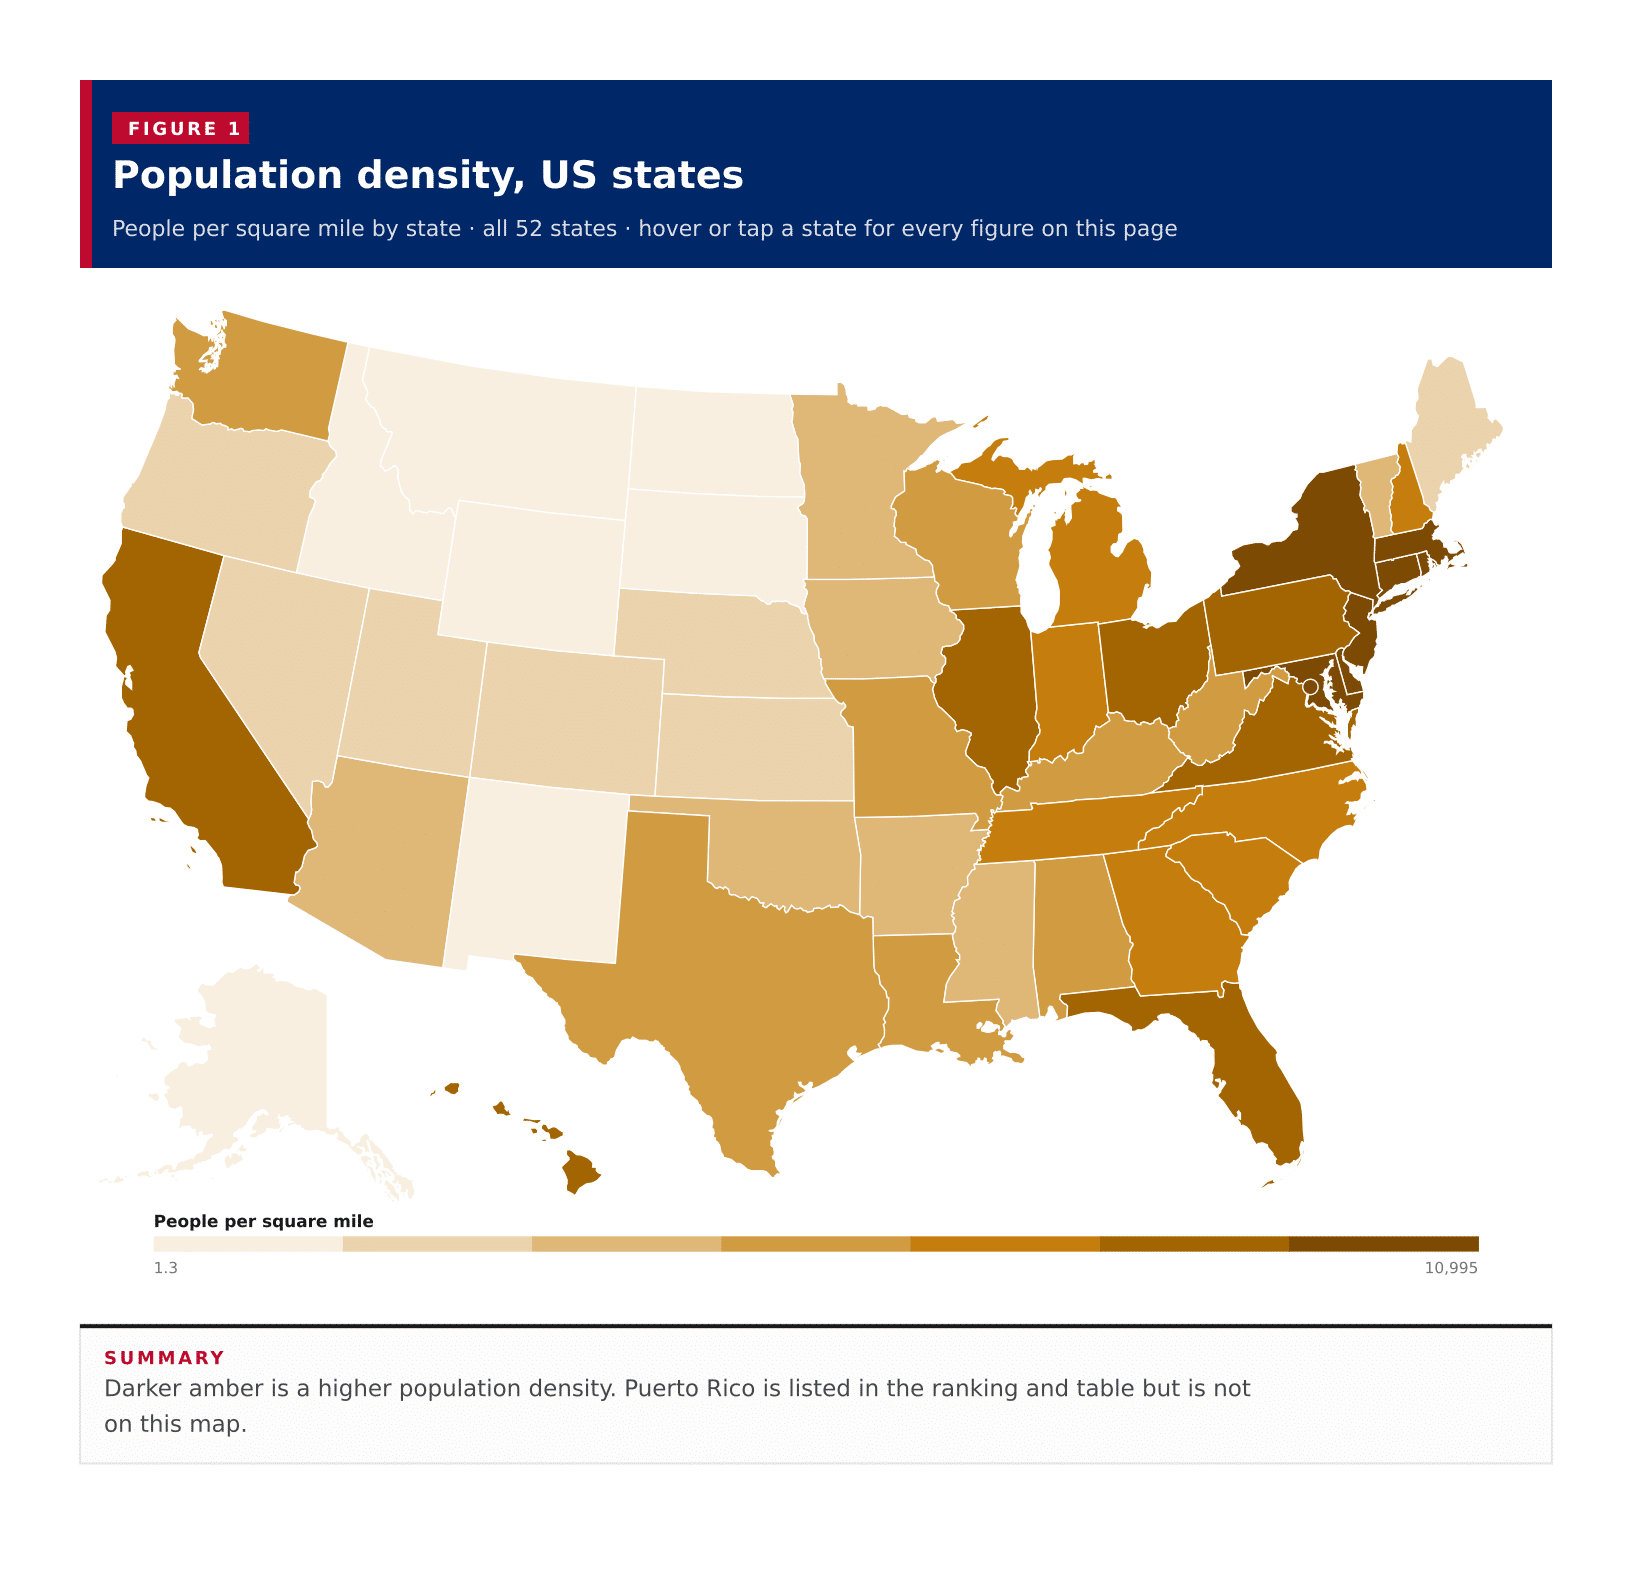
Population density, US statesDarker amber is a higher population density. Puerto Rico is listed in the ranking and table but is not on this map.Alabama · People per square mile: 99.8 · Population: 5,054,253 · Land area (sq mi): 50,651.0Alaska · People per square mile: 1.3 · Population: 733,971 · Land area (sq mi): 571,241.6Arizona · People per square mile: 63.9 · Population: 7,268,175 · Land area (sq mi): 113,655.4Arkansas · People per square mile: 58.3 · Population: 3,032,651 · Land area (sq mi): 51,991.9California · People per square mile: 251.8 · Population: 39,242,785 · Land area (sq mi): 155,859.2Colorado · People per square mile: 56.1 · Population: 5,810,774 · Land area (sq mi): 103,637.1Connecticut · People per square mile: 743.1 · Population: 3,598,348 · Land area (sq mi): 4,842.5Delaware · People per square mile: 516.2 · Population: 1,005,872 · Land area (sq mi): 1,948.5Florida · People per square mile: 408.7 · Population: 21,928,881 · Land area (sq mi): 53,654.8Georgia · People per square mile: 187.5 · Population: 10,822,590 · Land area (sq mi): 57,716.8Hawaii · People per square mile: 225.1 · Population: 1,445,635 · Land area (sq mi): 6,422.6Idaho · People per square mile: 22.9 · Population: 1,893,296 · Land area (sq mi): 82,645.4Illinois · People per square mile: 228.6 · Population: 12,692,653 · Land area (sq mi): 55,513.1Indiana · People per square mile: 190.1 · Population: 6,811,752 · Land area (sq mi): 35,825.1Iowa · People per square mile: 57.2 · Population: 3,195,937 · Land area (sq mi): 55,853.7Kansas · People per square mile: 35.9 · Population: 2,937,569 · Land area (sq mi): 81,758.6Kentucky · People per square mile: 114.2 · Population: 4,510,725 · Land area (sq mi): 39,485.4Louisiana · People per square mile: 106.9 · Population: 4,621,025 · Land area (sq mi): 43,212.9Maine · People per square mile: 44.7 · Population: 1,377,400 · Land area (sq mi): 30,845.1Maryland · People per square mile: 635.4 · Population: 6,170,738 · Land area (sq mi): 9,710.9Massachusetts · People per square mile: 896.4 · Population: 6,992,395 · Land area (sq mi): 7,801.0Michigan · People per square mile: 177.6 · Population: 10,051,595 · Land area (sq mi): 56,611.0Minnesota · People per square mile: 71.8 · Population: 5,713,716 · Land area (sq mi): 79,631.6Mississippi · People per square mile: 62.9 · Population: 2,951,438 · Land area (sq mi): 46,924.6Missouri · People per square mile: 89.7 · Population: 6,168,181 · Land area (sq mi): 68,746.4Montana · People per square mile: 7.6 · Population: 1,105,072 · Land area (sq mi): 145,550.3Nebraska · People per square mile: 25.6 · Population: 1,965,926 · Land area (sq mi): 76,815.0Nevada · People per square mile: 28.6 · Population: 3,141,000 · Land area (sq mi): 109,860.4New Hampshire · People per square mile: 155 · Population: 1,387,834 · Land area (sq mi): 8,953.8New Jersey · People per square mile: 1,260 · Population: 9,267,014 · Land area (sq mi): 7,354.9New Mexico · People per square mile: 17.4 · Population: 2,114,768 · Land area (sq mi): 121,312.7New York · People per square mile: 421.7 · Population: 19,872,319 · Land area (sq mi): 47,123.4North Carolina · People per square mile: 217.7 · Population: 10,584,340 · Land area (sq mi): 48,624.2North Dakota · People per square mile: 11.3 · Population: 779,361 · Land area (sq mi): 68,994.3Ohio · People per square mile: 288.3 · Population: 11,780,046 · Land area (sq mi): 40,858.9Oklahoma · People per square mile: 58.2 · Population: 3,995,260 · Land area (sq mi): 68,596.7Oregon · People per square mile: 44.2 · Population: 4,238,714 · Land area (sq mi): 95,996.7Pennsylvania · People per square mile: 290.3 · Population: 12,986,518 · Land area (sq mi): 44,742.1Rhode Island · People per square mile: 1,059.5 · Population: 1,095,371 · Land area (sq mi): 1,033.9South Carolina · People per square mile: 173.4 · Population: 5,212,774 · Land area (sq mi): 30,064.1South Dakota · People per square mile: 11.9 · Population: 899,194 · Land area (sq mi): 75,807.9Tennessee · People per square mile: 169.5 · Population: 6,986,082 · Land area (sq mi): 41,224.3Texas · People per square mile: 113.5 · Population: 29,640,343 · Land area (sq mi): 261,258.6Utah · People per square mile: 40.3 · Population: 3,331,187 · Land area (sq mi): 82,595.7Vermont · People per square mile: 70 · Population: 645,254 · Land area (sq mi): 9,217.3Virginia · People per square mile: 219.3 · Population: 8,657,499 · Land area (sq mi): 39,481.4Washington · People per square mile: 116.5 · Population: 7,740,984 · Land area (sq mi): 66,455.4West Virginia · People per square mile: 74.2 · Population: 1,784,462 · Land area (sq mi): 24,041.2Wisconsin · People per square mile: 108.8 · Population: 5,892,023 · Land area (sq mi): 54,168.0Wyoming · People per square mile: 6 · Population: 579,761 · Land area (sq mi): 97,088.6District of Columbia · People per square mile: 10,995 · Population: 672,079 · Land area (sq mi): 61.1District of Columbia · People per square mile: 10,995 · Population: 672,079 · Land area (sq mi): 61.1People per square mile1.310,995
Summary

Darker amber is a higher population density. Puerto Rico is listed in the ranking and table but is not on this map.

A typical published area has 111.1 people per square mile, the midpoint of the 50 states, the District of Columbia and Puerto Rico on the 2023 ACS five-year estimates. That midpoint is not an average: the District of Columbia alone, at 10,995 people per square mile, sits far above every state. New Jersey leads the 50 states at 1,260, then Rhode Island at 1,059.5. Puerto Rico, which this table also returns, sits at 950.5. Alaska is the most open at 1.3 people per square mile. Three areas reach 1,000 people per square mile. Density is ACS 2023 five-year population divided by Census gazetteer land area, so water is not in the denominator.

In short

111.1typical published areapeople per square mile, the middle area, not an average
10,995District of Columbiahighest density
1,260New Jerseyhighest of the 50 states
1.3Alaskalowest density
3areas at or above 1,000 per sq miDistrict of Columbia, New Jersey and Rhode Island
Figure 1

Population density, all published states

People per square mile · all 52 · ranked high to low

52 items
View100%
DownloadPDFImageCSV
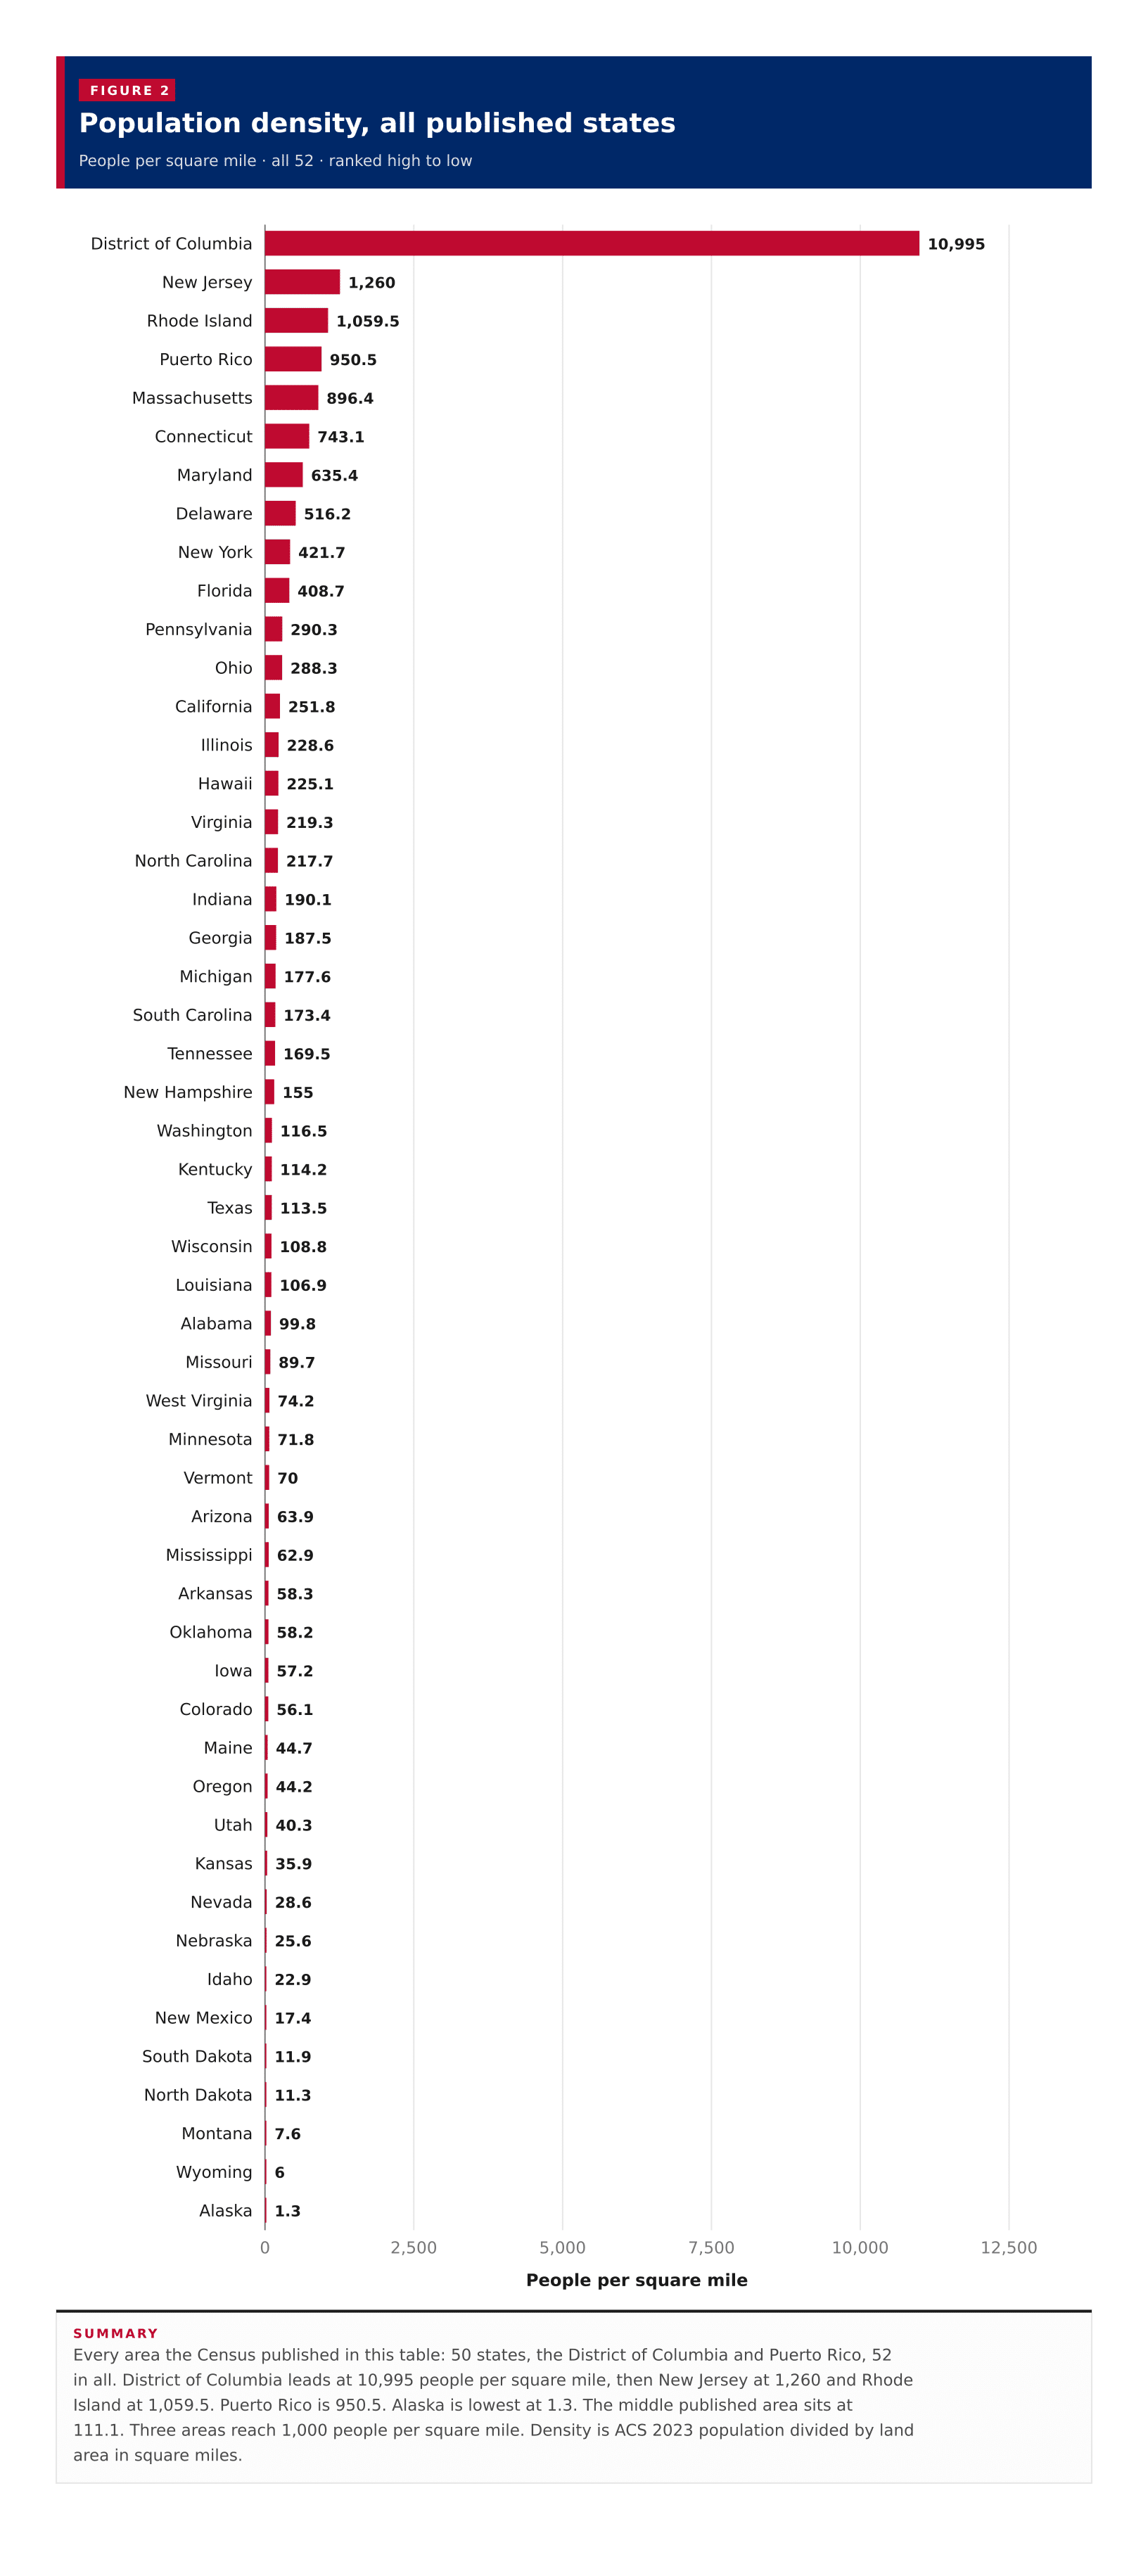
Population density, all published statesEvery area the Census published in this table: 50 states, the District of Columbia and Puerto Rico, 52 in all. District of Columbia leads at 10,995 people per square mile, then New Jersey at 1,260 and Rhode Island at 1,059.5. Puerto Rico is 950.5. Alaska is lowest at 1.3. The middle published area sits at 111.1. Three areas reach 1,000 people per square mile. Density is ACS 2023 population divided by land area in square miles.02,5005,0007,50010,00012,500People per square mile10,995District of Columbia1,260New Jersey1,059.5Rhode Island950.5Puerto Rico896.4Massachusetts743.1Connecticut635.4Maryland516.2Delaware421.7New York408.7Florida290.3Pennsylvania288.3Ohio251.8California228.6Illinois225.1Hawaii219.3Virginia217.7North Carolina190.1Indiana187.5Georgia177.6Michigan173.4South Carolina169.5Tennessee155New Hampshire116.5Washington114.2Kentucky113.5Texas108.8Wisconsin106.9Louisiana99.8Alabama89.7Missouri74.2West Virginia71.8Minnesota70Vermont63.9Arizona62.9Mississippi58.3Arkansas58.2Oklahoma57.2Iowa56.1Colorado44.7Maine44.2Oregon40.3Utah35.9Kansas28.6Nevada25.6Nebraska22.9Idaho17.4New Mexico11.9South Dakota11.3North Dakota7.6Montana6Wyoming1.3Alaska
Summary

Every area the Census published in this table: 50 states, the District of Columbia and Puerto Rico, 52 in all. District of Columbia leads at 10,995 people per square mile, then New Jersey at 1,260 and Rhode Island at 1,059.5. Puerto Rico is 950.5. Alaska is lowest at 1.3. The middle published area sits at 111.1. Three areas reach 1,000 people per square mile. Density is ACS 2023 population divided by land area in square miles.

Figure 2

Population, all published states

Population · all 52 · ranked high to low

52 items
View100%
DownloadPDFImageCSV
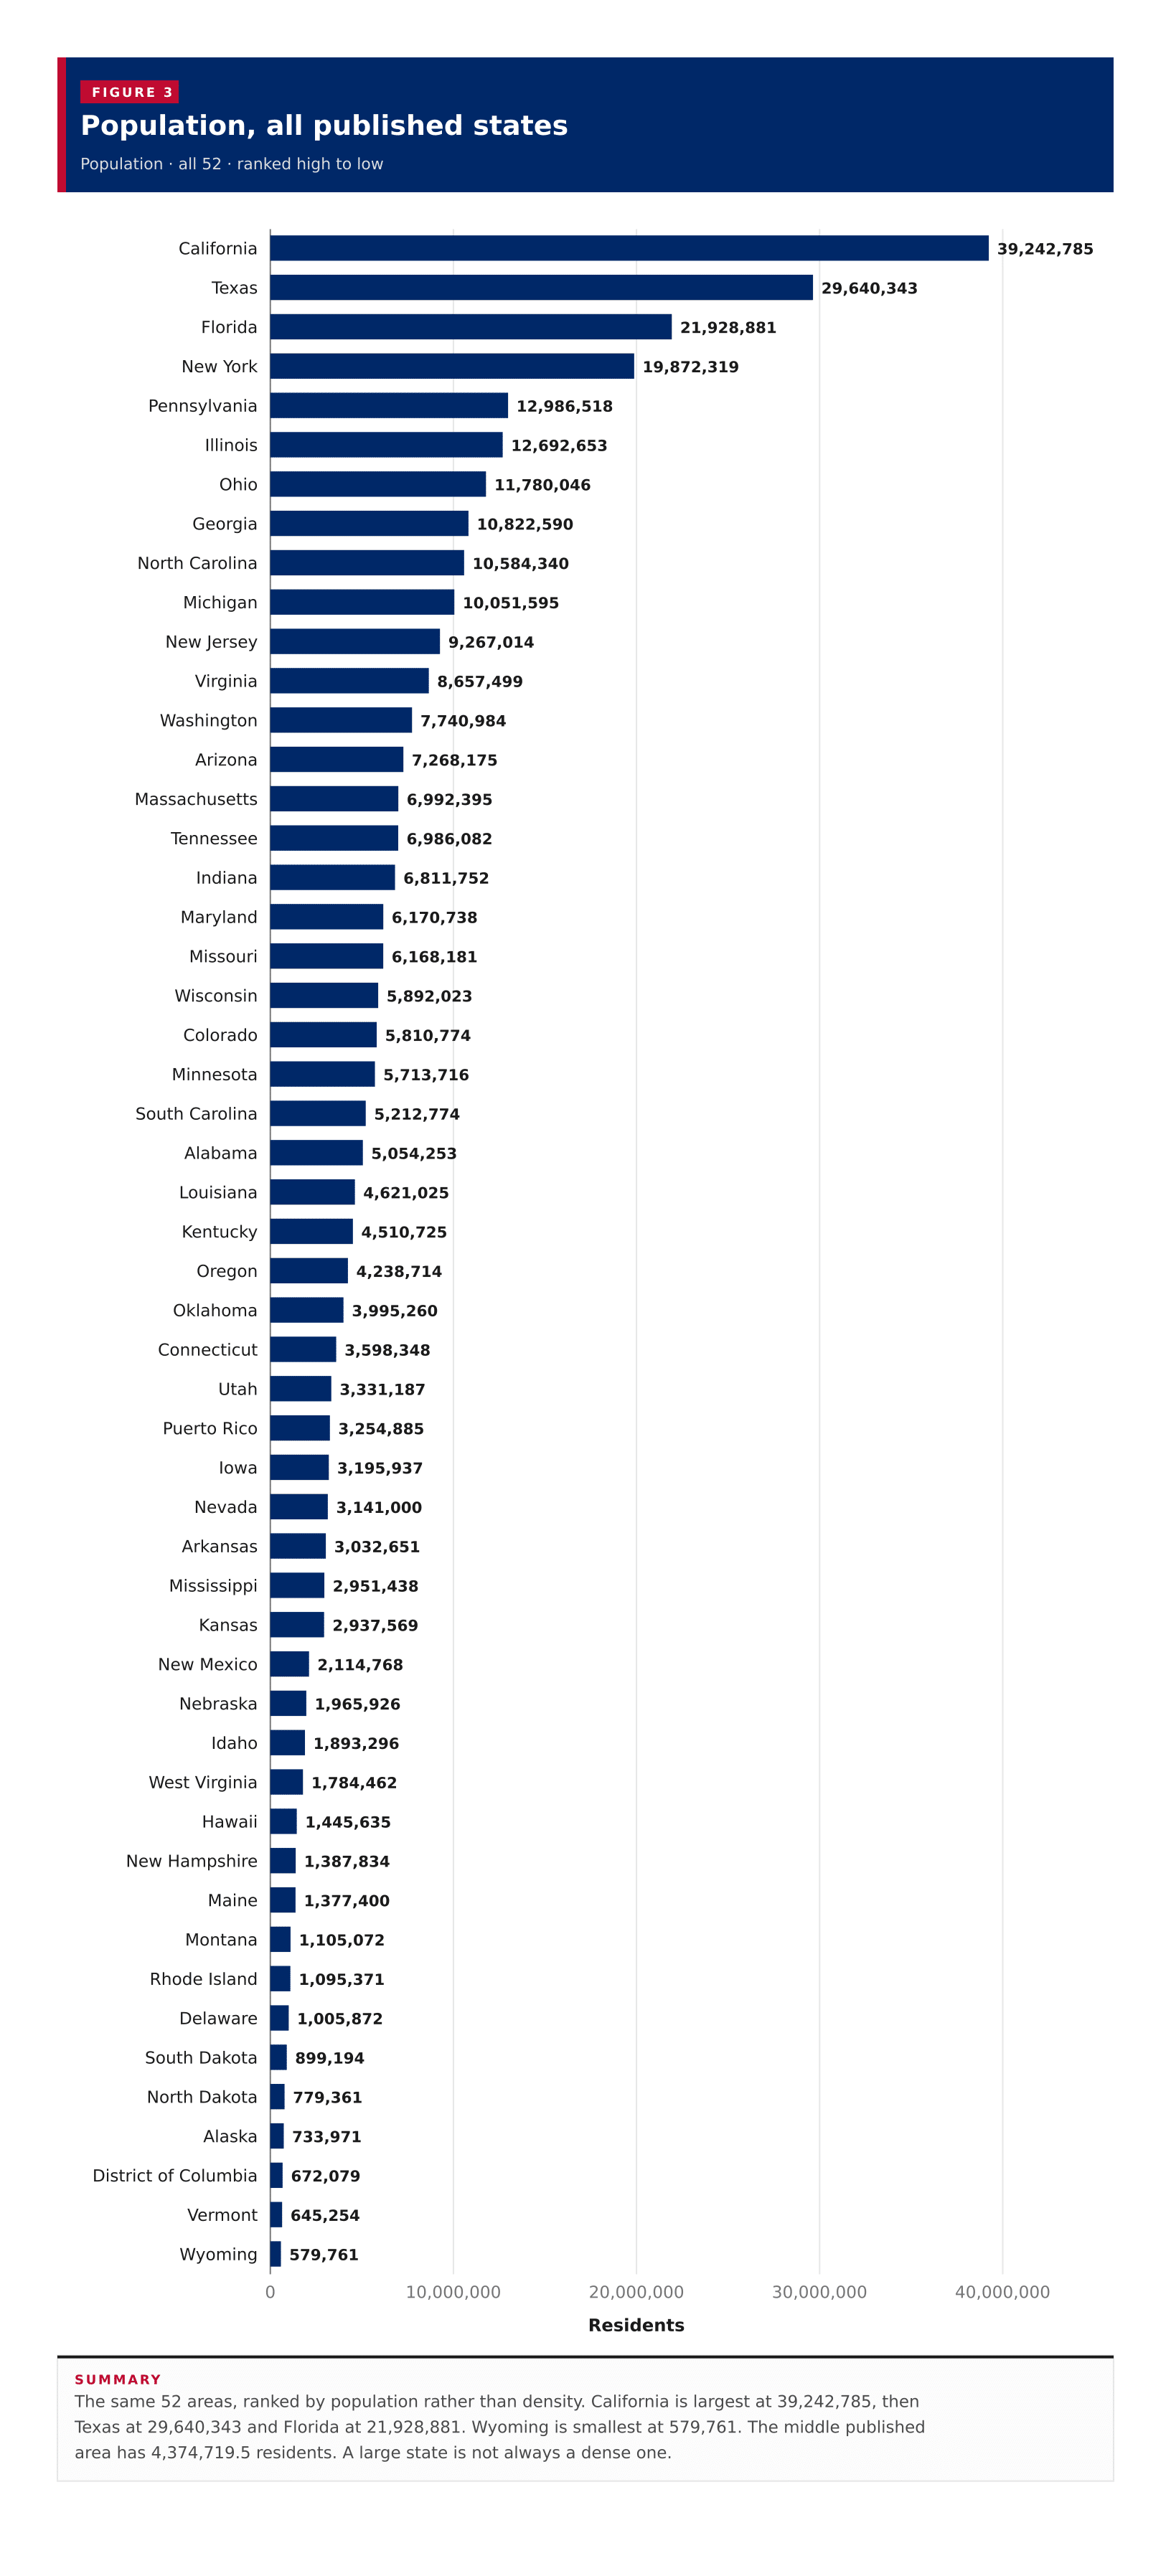
Population, all published statesThe same 52 areas, ranked by population rather than density. California is largest at 39,242,785, then Texas at 29,640,343 and Florida at 21,928,881. Wyoming is smallest at 579,761. The middle published area has 4,374,719.5 residents. A large state is not always a dense one.010,000,00020,000,00030,000,00040,000,000Residents39,242,785California29,640,343Texas21,928,881Florida19,872,319New York12,986,518Pennsylvania12,692,653Illinois11,780,046Ohio10,822,590Georgia10,584,340North Carolina10,051,595Michigan9,267,014New Jersey8,657,499Virginia7,740,984Washington7,268,175Arizona6,992,395Massachusetts6,986,082Tennessee6,811,752Indiana6,170,738Maryland6,168,181Missouri5,892,023Wisconsin5,810,774Colorado5,713,716Minnesota5,212,774South Carolina5,054,253Alabama4,621,025Louisiana4,510,725Kentucky4,238,714Oregon3,995,260Oklahoma3,598,348Connecticut3,331,187Utah3,254,885Puerto Rico3,195,937Iowa3,141,000Nevada3,032,651Arkansas2,951,438Mississippi2,937,569Kansas2,114,768New Mexico1,965,926Nebraska1,893,296Idaho1,784,462West Virginia1,445,635Hawaii1,387,834New Hampshire1,377,400Maine1,105,072Montana1,095,371Rhode Island1,005,872Delaware899,194South Dakota779,361North Dakota733,971Alaska672,079District of Columbia645,254Vermont579,761Wyoming
Summary

The same 52 areas, ranked by population rather than density. California is largest at 39,242,785, then Texas at 29,640,343 and Florida at 21,928,881. Wyoming is smallest at 579,761. The middle published area has 4,374,719.5 residents. A large state is not always a dense one.

Figure 3

Population against density

People per square mile against population · one point per row, 52 of 52 plotted

52 items
View100%
DownloadPDFImageCSV
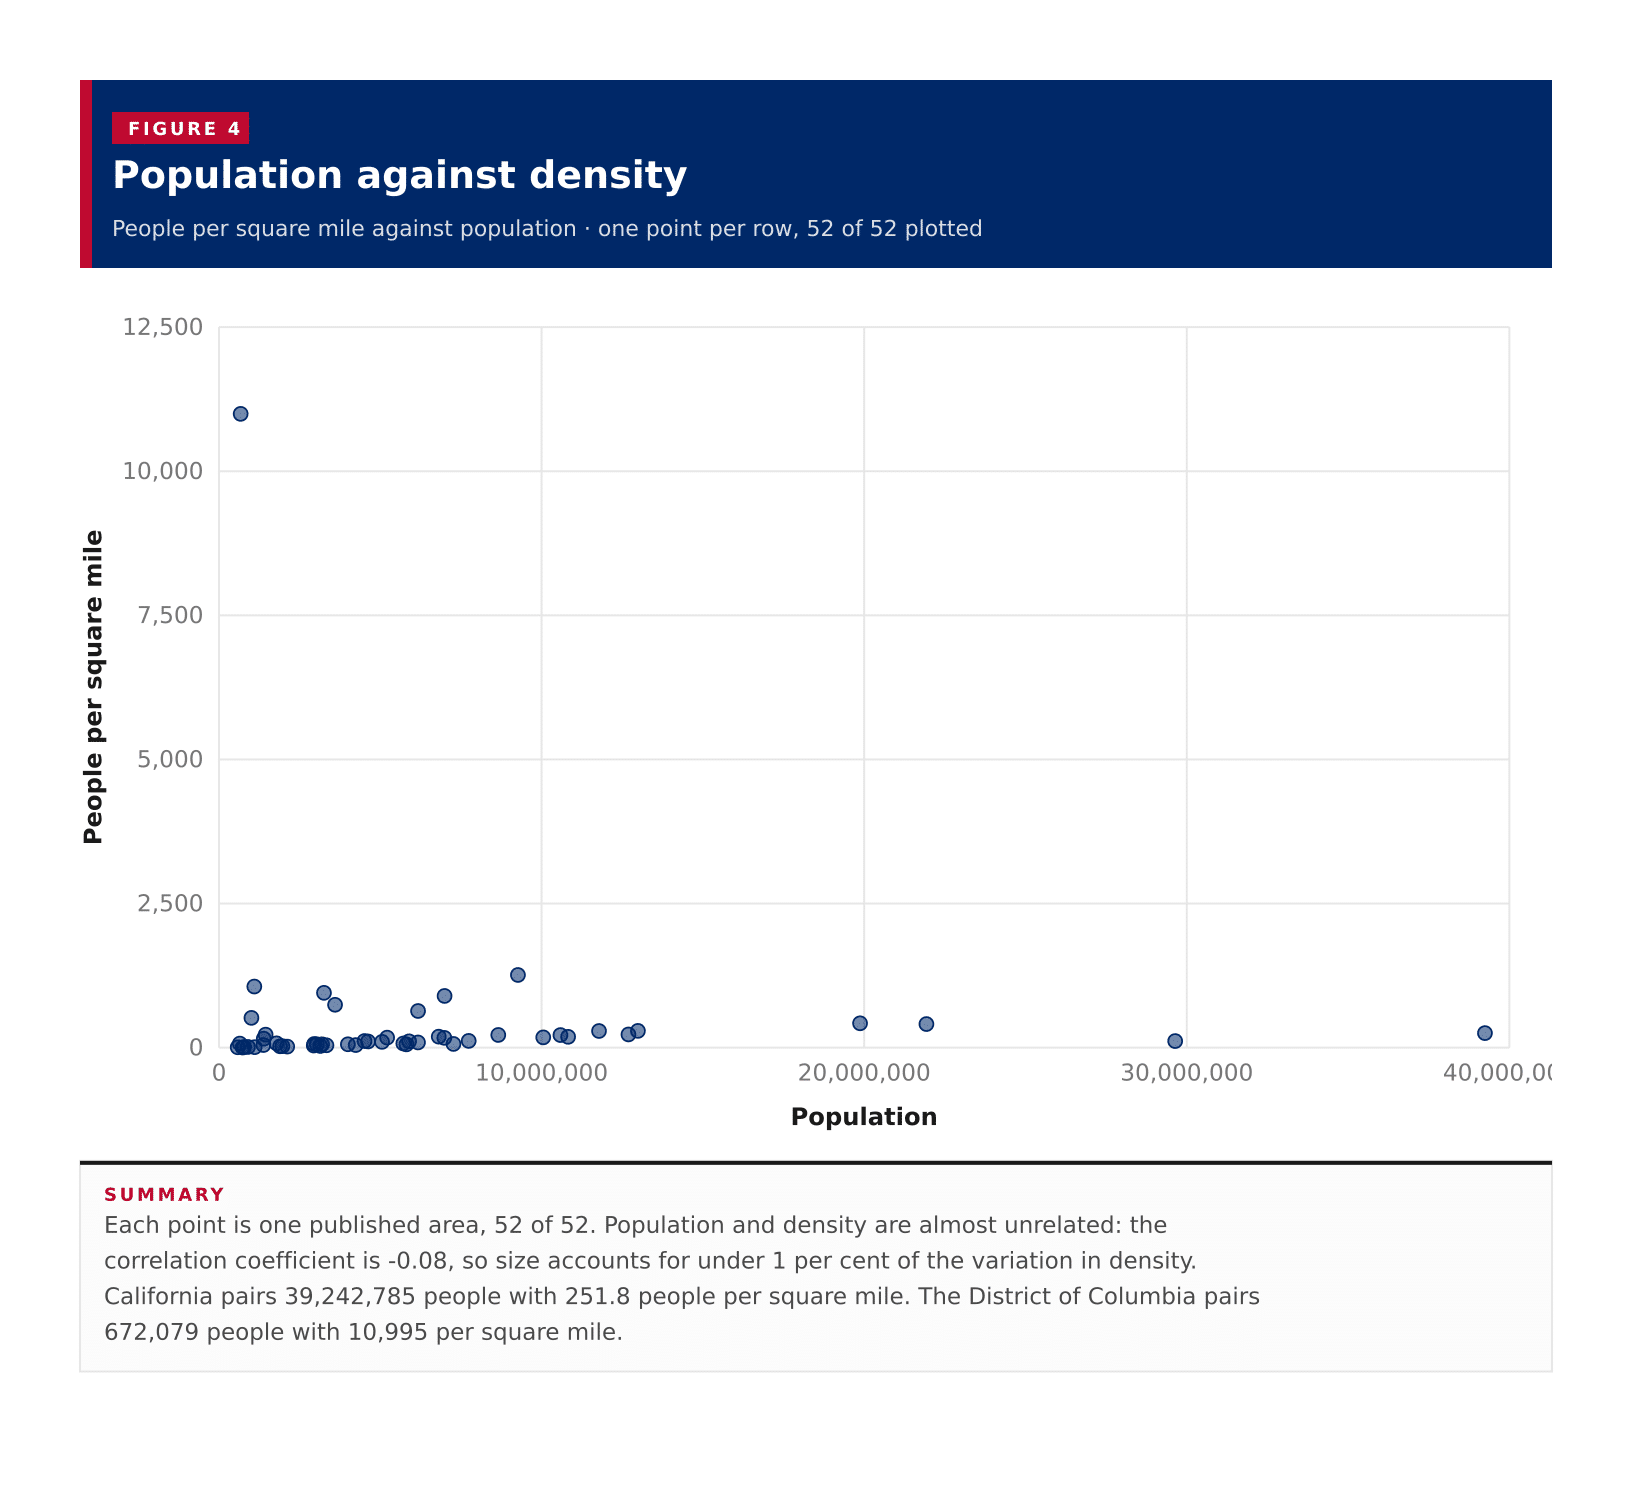
Population against densityEach point is one published area, 52 of 52. Population and density are almost unrelated: the correlation coefficient is -0.08, so size accounts for under 1 per cent of the variation in density. California pairs 39,242,785 people with 251.8 people per square mile. The District of Columbia pairs 672,079 people with 10,995 per square mile.02,5005,0007,50010,00012,500010,000,00020,000,00030,000,00040,000,000People per square milePopulation
Summary

Each point is one published area, 52 of 52. Population and density are almost unrelated: the correlation coefficient is -0.08, so size accounts for under 1 per cent of the variation in density. California pairs 39,242,785 people with 251.8 people per square mile. The District of Columbia pairs 672,079 people with 10,995 per square mile.

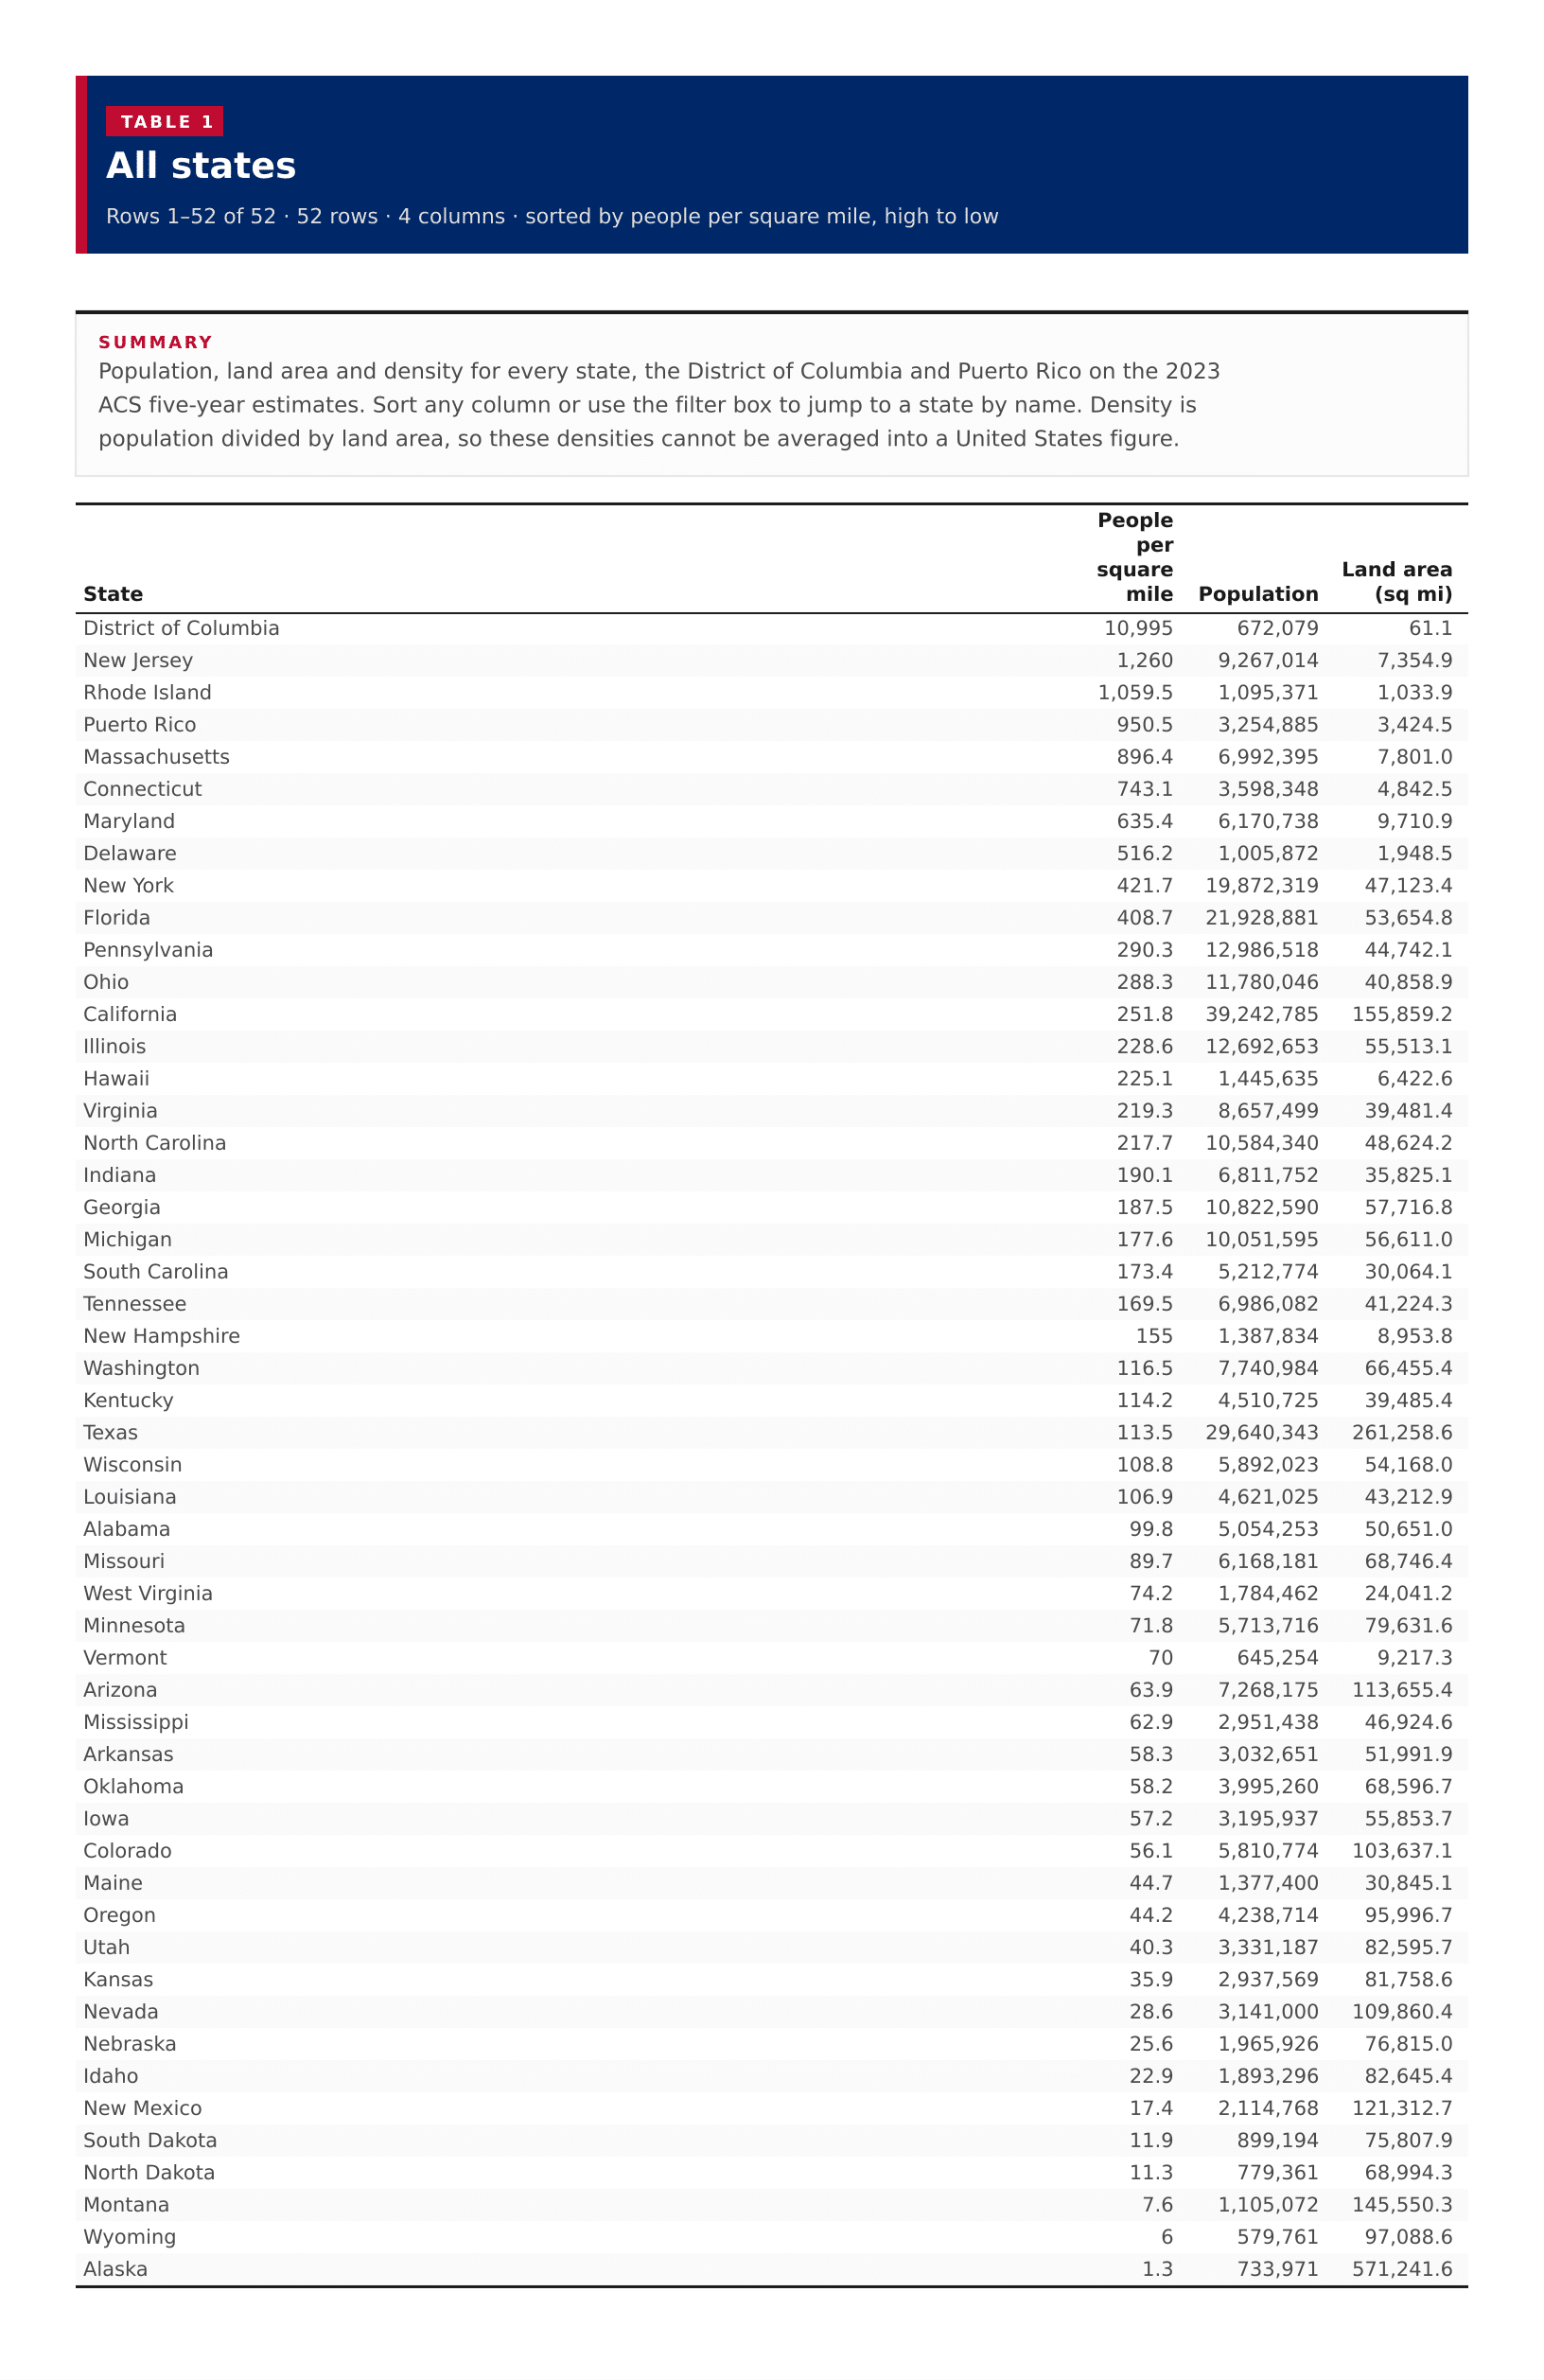
Table 1

All states

52 rows · 4 columns · sorted by people per square mile, high to low

52 rows
View100%
DownloadPDFImageCSV
Summary

Population, land area and density for every state, the District of Columbia and Puerto Rico on the 2023 ACS five-year estimates. Sort any column or use the filter box to jump to a state by name. Density is population divided by land area, so these densities cannot be averaged into a United States figure.

All states
???
District of Columbia10,995672,07961.1
New Jersey1,2609,267,0147,354.9
Rhode Island1,059.51,095,3711,033.9
Puerto Rico950.53,254,8853,424.5
Massachusetts896.46,992,3957,801.0
Connecticut743.13,598,3484,842.5
Maryland635.46,170,7389,710.9
Delaware516.21,005,8721,948.5
New York421.719,872,31947,123.4
Florida408.721,928,88153,654.8
Pennsylvania290.312,986,51844,742.1
Ohio288.311,780,04640,858.9
California251.839,242,785155,859.2
Illinois228.612,692,65355,513.1
Hawaii225.11,445,6356,422.6
Virginia219.38,657,49939,481.4
North Carolina217.710,584,34048,624.2
Indiana190.16,811,75235,825.1
Georgia187.510,822,59057,716.8
Michigan177.610,051,59556,611.0
South Carolina173.45,212,77430,064.1
Tennessee169.56,986,08241,224.3
New Hampshire1551,387,8348,953.8
Washington116.57,740,98466,455.4
Kentucky114.24,510,72539,485.4
Texas113.529,640,343261,258.6
Wisconsin108.85,892,02354,168.0
Louisiana106.94,621,02543,212.9
Alabama99.85,054,25350,651.0
Missouri89.76,168,18168,746.4
West Virginia74.21,784,46224,041.2
Minnesota71.85,713,71679,631.6
Vermont70645,2549,217.3
Arizona63.97,268,175113,655.4
Mississippi62.92,951,43846,924.6
Arkansas58.33,032,65151,991.9
Oklahoma58.23,995,26068,596.7
Iowa57.23,195,93755,853.7
Colorado56.15,810,774103,637.1
Maine44.71,377,40030,845.1
Oregon44.24,238,71495,996.7
Utah40.33,331,18782,595.7
Kansas35.92,937,56981,758.6
Nevada28.63,141,000109,860.4
Nebraska25.61,965,92676,815.0
Idaho22.91,893,29682,645.4
New Mexico17.42,114,768121,312.7
South Dakota11.9899,19475,807.9
North Dakota11.3779,36168,994.3
Montana7.61,105,072145,550.3
Wyoming6579,76197,088.6
Alaska1.3733,971571,241.6

Image files

Download all

Figure 1

Population density, US states

Figure 1: Population density, US states
DownloadPDFImageCSV

Figure 2

Population density, all published states

Figure 2: Population density, all published states
DownloadPDFImageCSV

Figure 3

Population, all published states

Figure 3: Population, all published states
DownloadPDFImageCSV

About this data

  • Density is ACS 2023 five-year population divided by land area from the 2024 Census National States Gazetteer, in people per square mile. Water area is not in the denominator.
  • The 2023 Gazetteer files did not include a national states file, so land area is taken from the 2024 National States Gazetteer. State land area is a Census measurement, not an ACS estimate.
  • The Census published 50 states, the District of Columbia and Puerto Rico. ACS table B01003 does not publish a population margin of error for these areas: the estimates are controlled, so a sampling error is not applicable. Those cells are omitted rather than shown as a Census sentinel.
  • A state density cannot be averaged into a national figure. The midpoint of the 52 areas is not the density of the United States.
  • The map covers the 48 contiguous states, with Alaska and Hawaii inset. Puerto Rico stays in the ranking and table.