Population by US state

Summary

Total population, US states

Population by state · all 52 states · hover or tap a state for every figure on this page

52 items
View100%
DownloadPDFImageCSV
StatesCalifornia
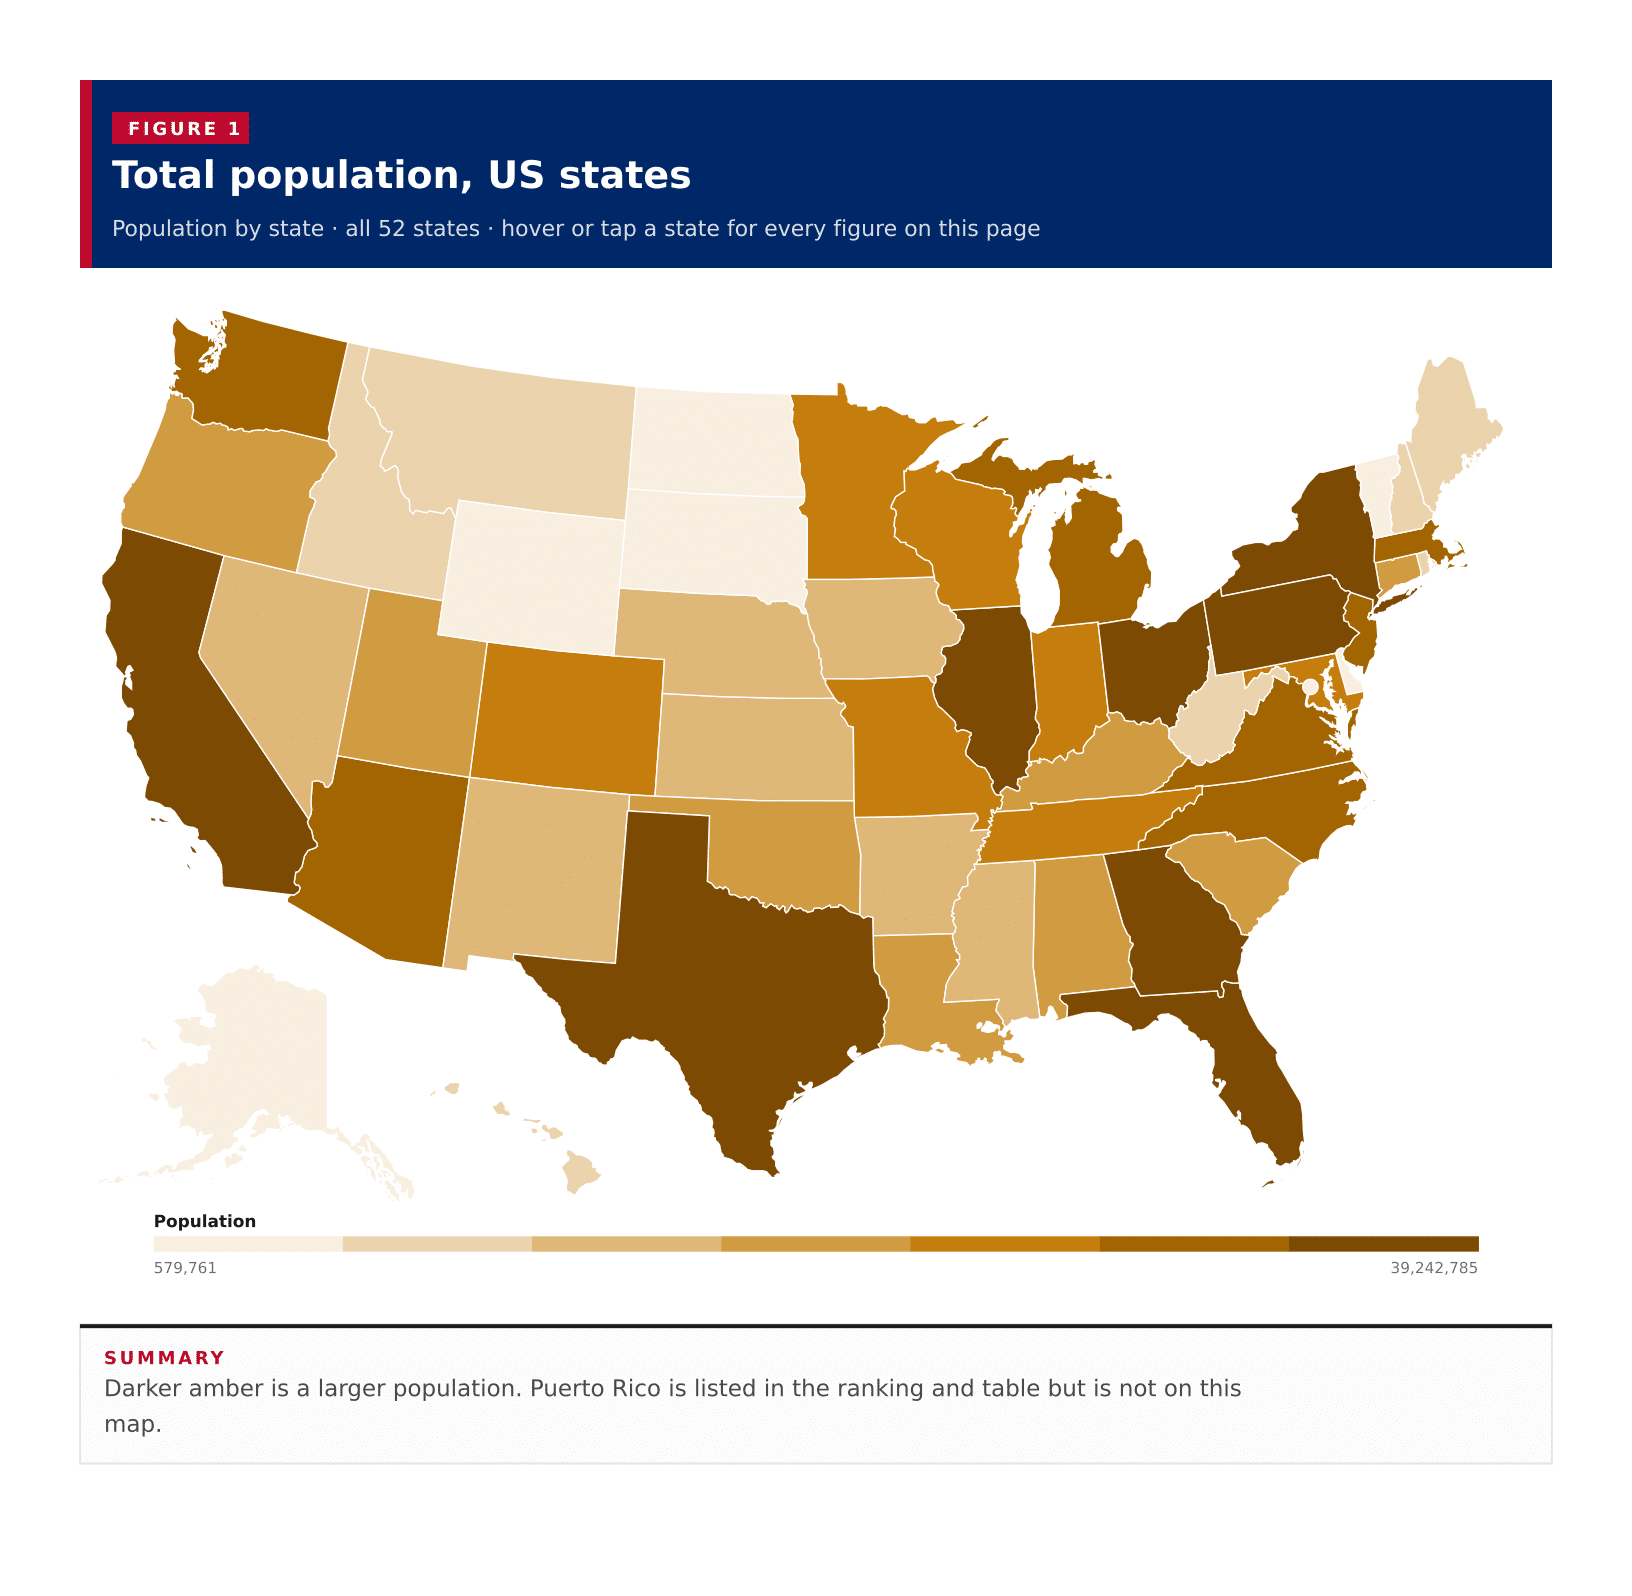
Total population, US statesDarker amber is a larger population. Puerto Rico is listed in the ranking and table but is not on this map.Alabama · Population: 5,054,253Alaska · Population: 733,971Arizona · Population: 7,268,175Arkansas · Population: 3,032,651California · Population: 39,242,785Colorado · Population: 5,810,774Connecticut · Population: 3,598,348Delaware · Population: 1,005,872Florida · Population: 21,928,881Georgia · Population: 10,822,590Hawaii · Population: 1,445,635Idaho · Population: 1,893,296Illinois · Population: 12,692,653Indiana · Population: 6,811,752Iowa · Population: 3,195,937Kansas · Population: 2,937,569Kentucky · Population: 4,510,725Louisiana · Population: 4,621,025Maine · Population: 1,377,400Maryland · Population: 6,170,738Massachusetts · Population: 6,992,395Michigan · Population: 10,051,595Minnesota · Population: 5,713,716Mississippi · Population: 2,951,438Missouri · Population: 6,168,181Montana · Population: 1,105,072Nebraska · Population: 1,965,926Nevada · Population: 3,141,000New Hampshire · Population: 1,387,834New Jersey · Population: 9,267,014New Mexico · Population: 2,114,768New York · Population: 19,872,319North Carolina · Population: 10,584,340North Dakota · Population: 779,361Ohio · Population: 11,780,046Oklahoma · Population: 3,995,260Oregon · Population: 4,238,714Pennsylvania · Population: 12,986,518Rhode Island · Population: 1,095,371South Carolina · Population: 5,212,774South Dakota · Population: 899,194Tennessee · Population: 6,986,082Texas · Population: 29,640,343Utah · Population: 3,331,187Vermont · Population: 645,254Virginia · Population: 8,657,499Washington · Population: 7,740,984West Virginia · Population: 1,784,462Wisconsin · Population: 5,892,023Wyoming · Population: 579,761District of Columbia · Population: 672,079District of Columbia · Population: 672,079Population579,76139,242,785
Summary

Darker amber is a larger population. Puerto Rico is listed in the ranking and table but is not on this map.

California is the most populous published area on the 2023 ACS five-year estimates, with 39,242,785 residents, about 9.6 million ahead of Texas at 29,640,343. Florida and New York come next, and those four areas together hold about a third of the combined ACS population of the 50 states, the District of Columbia and Puerto Rico. A typical published area has about 4.4 million residents, the midpoint of the 52 figures. Wyoming is the smallest of the 50 states at 579,761, just under Vermont and the District of Columbia. Puerto Rico, which this table also returns, has 3,254,885 residents, between Utah and Iowa. These are ACS period estimates for each area, not a national census count.

In short

39,242,785Californiamost populous published area
29,640,343Texassecond, 9.6 million behind California
579,761Wyomingleast populous of the 50 states
4.4 milliontypical published areathe middle of the 52 figures, not an average
4areas above 19 millionCalifornia, Texas, Florida and New York
Figure 1

Total population, all published states

Population · all 52 · ranked high to low

52 items
View100%
DownloadPDFImageCSV
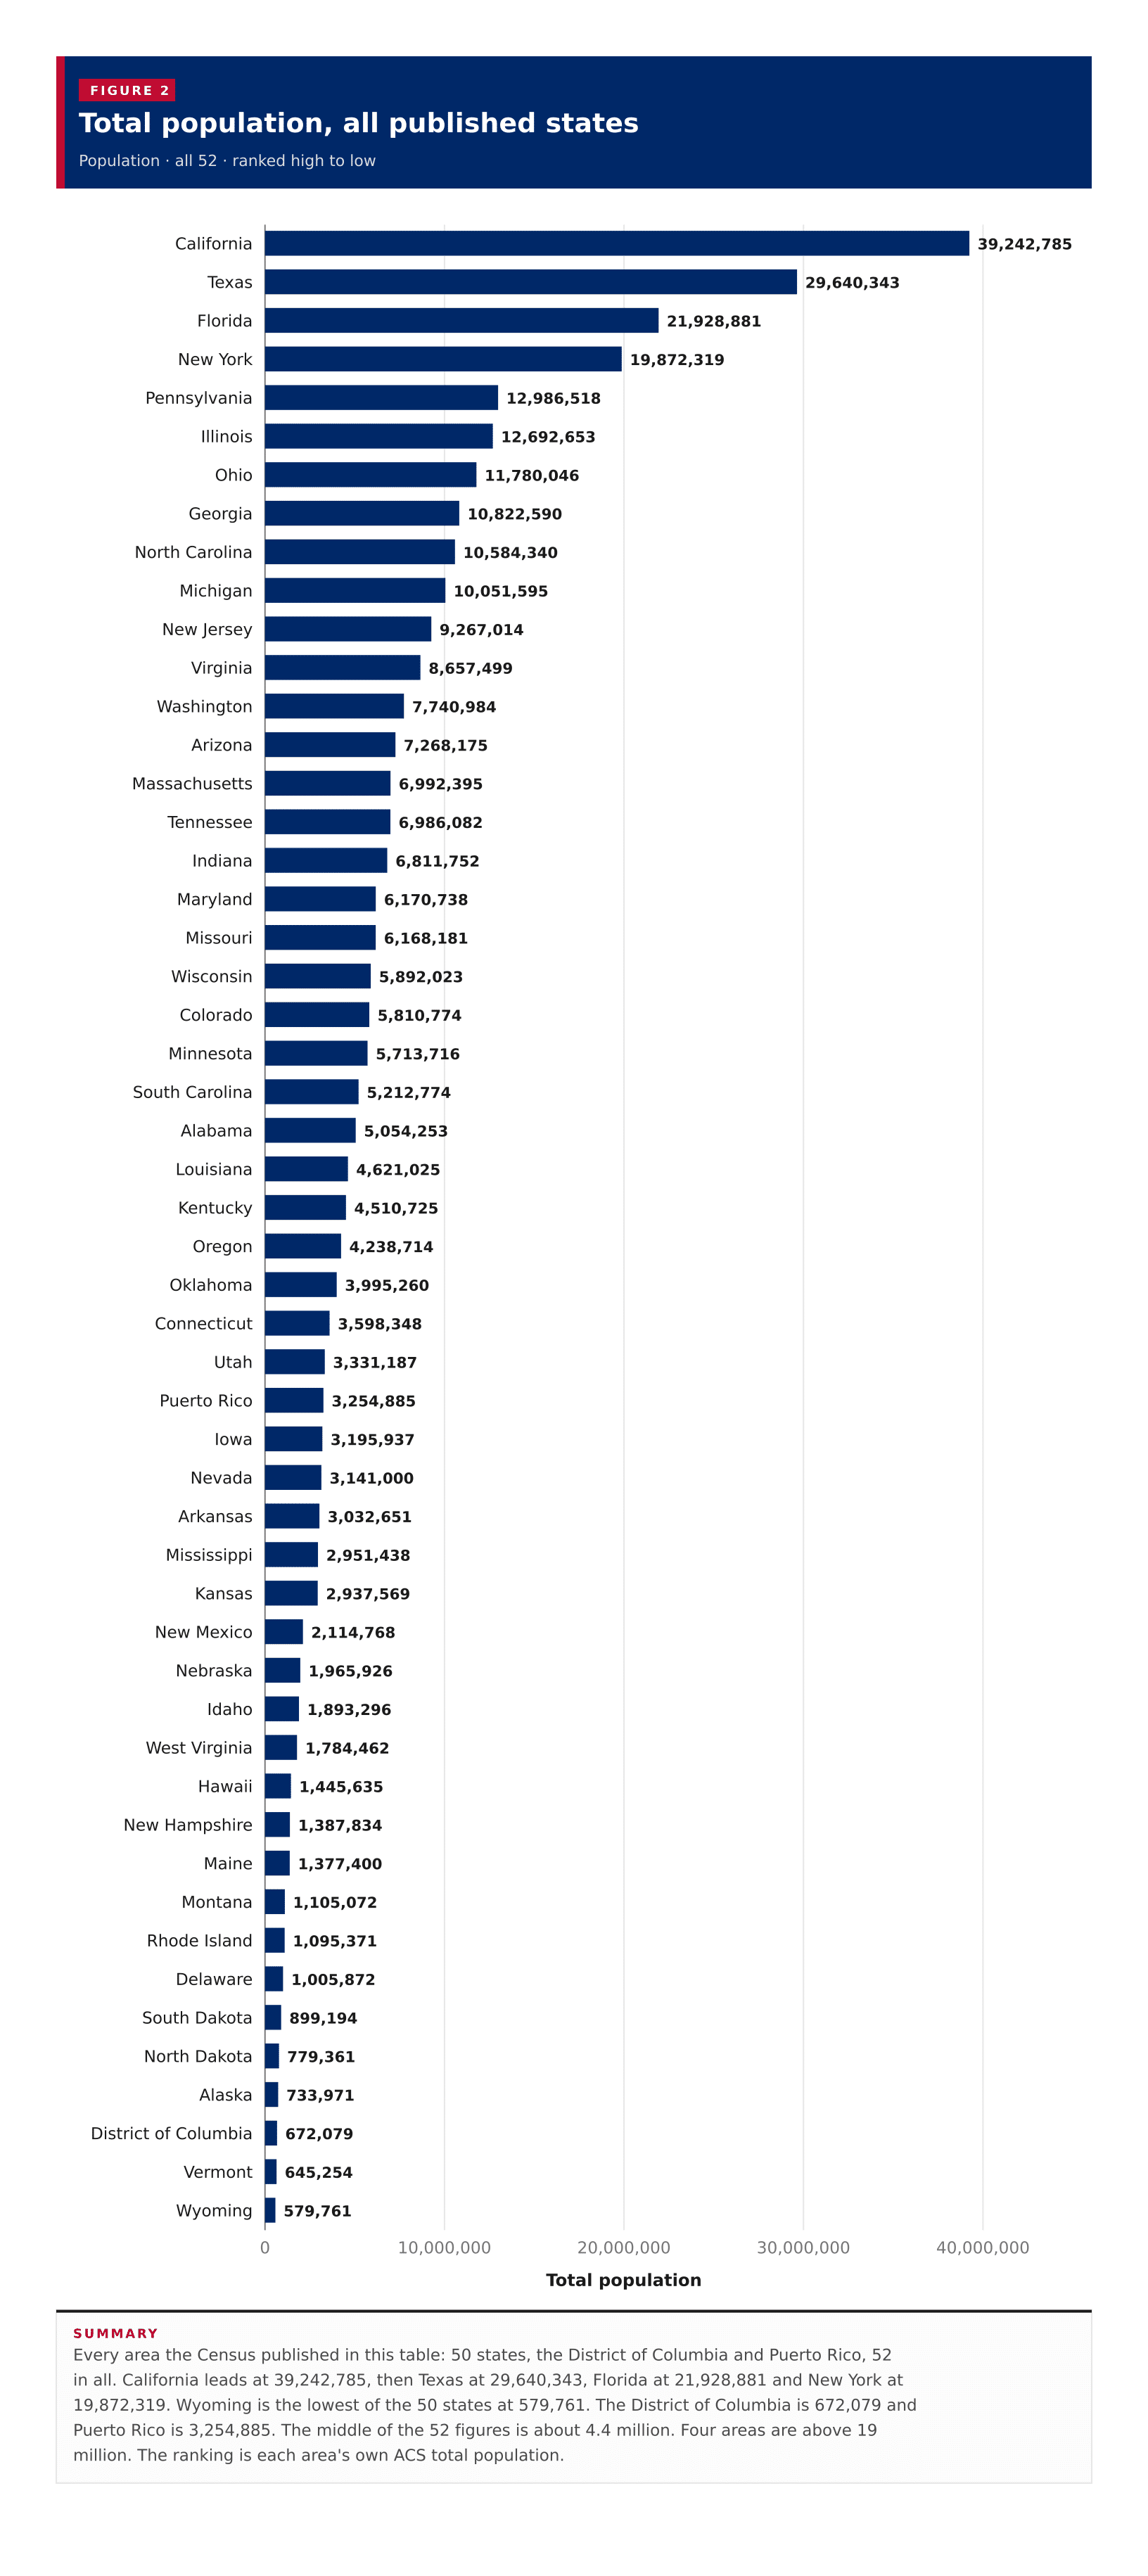
Total population, all published statesEvery area the Census published in this table: 50 states, the District of Columbia and Puerto Rico, 52 in all. California leads at 39,242,785, then Texas at 29,640,343, Florida at 21,928,881 and New York at 19,872,319. Wyoming is the lowest of the 50 states at 579,761. The District of Columbia is 672,079 and Puerto Rico is 3,254,885. The middle of the 52 figures is about 4.4 million. Four areas are above 19 million. The ranking is each area's own ACS total population.010,000,00020,000,00030,000,00040,000,000Total population39,242,785California29,640,343Texas21,928,881Florida19,872,319New York12,986,518Pennsylvania12,692,653Illinois11,780,046Ohio10,822,590Georgia10,584,340North Carolina10,051,595Michigan9,267,014New Jersey8,657,499Virginia7,740,984Washington7,268,175Arizona6,992,395Massachusetts6,986,082Tennessee6,811,752Indiana6,170,738Maryland6,168,181Missouri5,892,023Wisconsin5,810,774Colorado5,713,716Minnesota5,212,774South Carolina5,054,253Alabama4,621,025Louisiana4,510,725Kentucky4,238,714Oregon3,995,260Oklahoma3,598,348Connecticut3,331,187Utah3,254,885Puerto Rico3,195,937Iowa3,141,000Nevada3,032,651Arkansas2,951,438Mississippi2,937,569Kansas2,114,768New Mexico1,965,926Nebraska1,893,296Idaho1,784,462West Virginia1,445,635Hawaii1,387,834New Hampshire1,377,400Maine1,105,072Montana1,095,371Rhode Island1,005,872Delaware899,194South Dakota779,361North Dakota733,971Alaska672,079District of Columbia645,254Vermont579,761Wyoming
Summary

Every area the Census published in this table: 50 states, the District of Columbia and Puerto Rico, 52 in all. California leads at 39,242,785, then Texas at 29,640,343, Florida at 21,928,881 and New York at 19,872,319. Wyoming is the lowest of the 50 states at 579,761. The District of Columbia is 672,079 and Puerto Rico is 3,254,885. The middle of the 52 figures is about 4.4 million. Four areas are above 19 million. The ranking is each area's own ACS total population.

Table 1

All states

52 rows · 2 columns · sorted by population, high to low

52 rows
View100%
DownloadPDFImageCSV
Summary

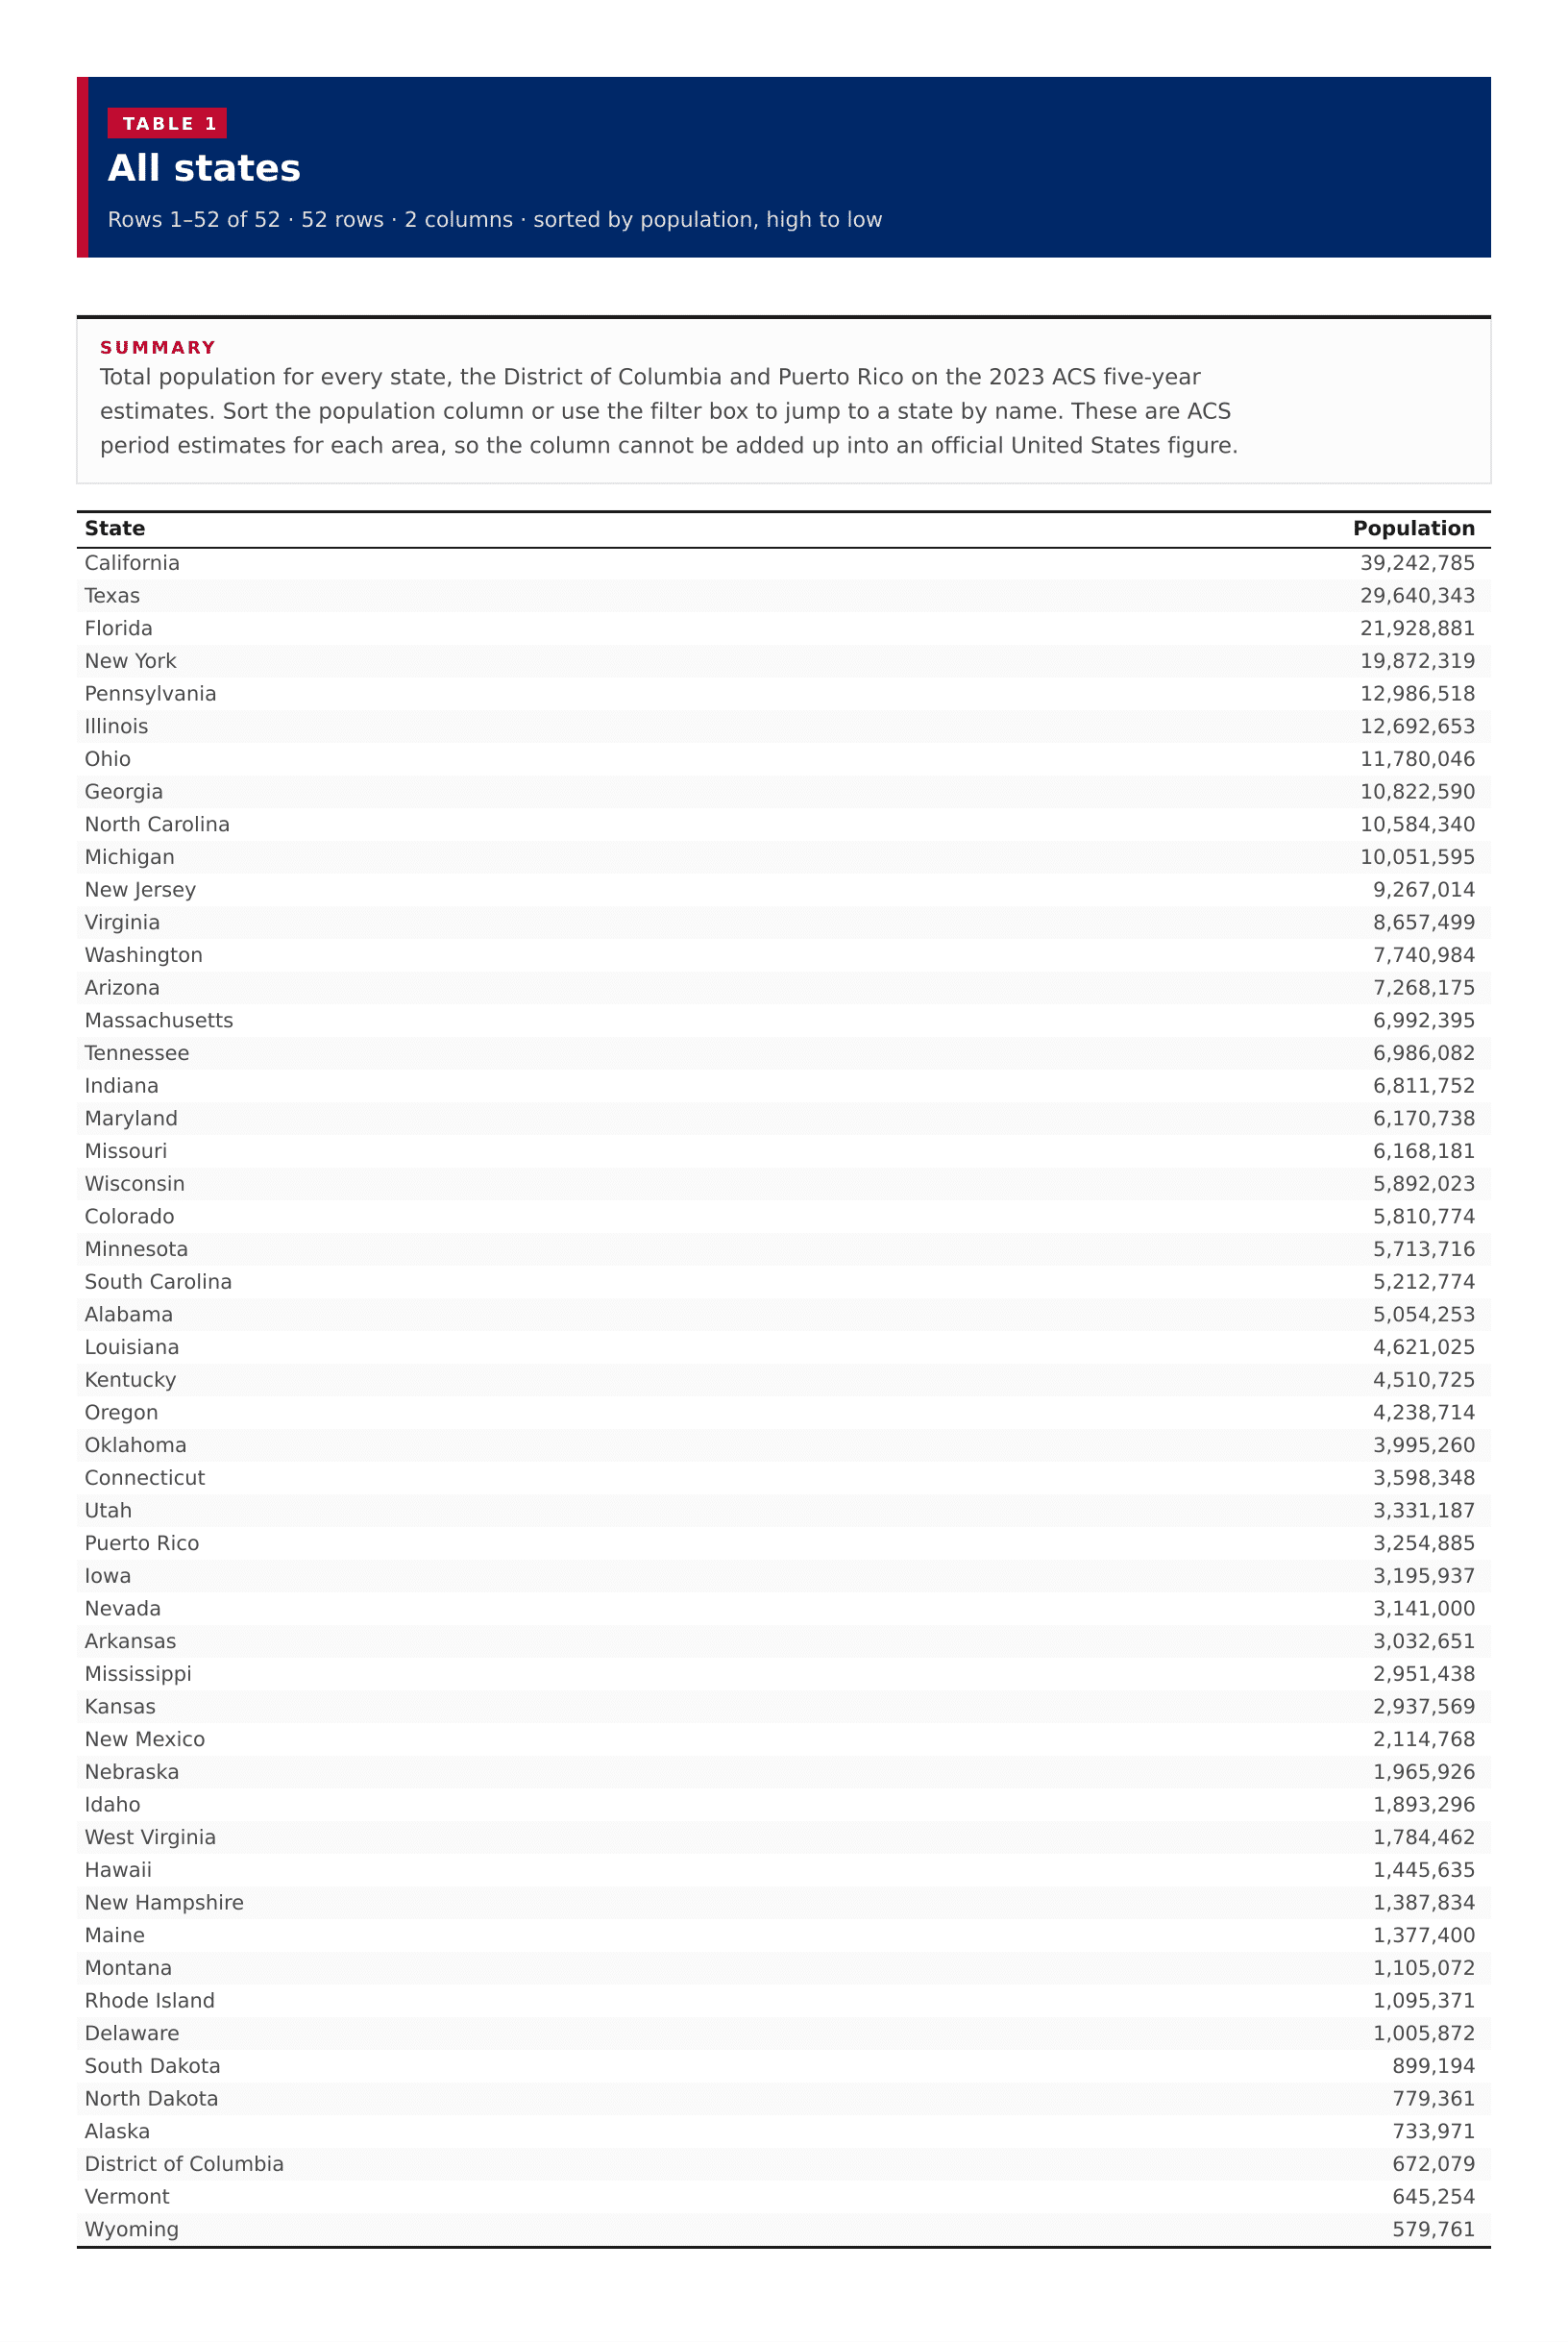
Total population for every state, the District of Columbia and Puerto Rico on the 2023 ACS five-year estimates. Sort the population column or use the filter box to jump to a state by name. These are ACS period estimates for each area, so the column cannot be added up into an official United States figure.

All states
?
California39,242,785
Texas29,640,343
Florida21,928,881
New York19,872,319
Pennsylvania12,986,518
Illinois12,692,653
Ohio11,780,046
Georgia10,822,590
North Carolina10,584,340
Michigan10,051,595
New Jersey9,267,014
Virginia8,657,499
Washington7,740,984
Arizona7,268,175
Massachusetts6,992,395
Tennessee6,986,082
Indiana6,811,752
Maryland6,170,738
Missouri6,168,181
Wisconsin5,892,023
Colorado5,810,774
Minnesota5,713,716
South Carolina5,212,774
Alabama5,054,253
Louisiana4,621,025
Kentucky4,510,725
Oregon4,238,714
Oklahoma3,995,260
Connecticut3,598,348
Utah3,331,187
Puerto Rico3,254,885
Iowa3,195,937
Nevada3,141,000
Arkansas3,032,651
Mississippi2,951,438
Kansas2,937,569
New Mexico2,114,768
Nebraska1,965,926
Idaho1,893,296
West Virginia1,784,462
Hawaii1,445,635
New Hampshire1,387,834
Maine1,377,400
Montana1,105,072
Rhode Island1,095,371
Delaware1,005,872
South Dakota899,194
North Dakota779,361
Alaska733,971
District of Columbia672,079
Vermont645,254
Wyoming579,761

Image files

Download all

Figure 2

Total population, all published states

Figure 2: Total population, all published states
DownloadPDFImageCSV

About this data

  • Total population is the ACS 2023 five-year estimate for each area, a period estimate for 2019 to 2023, not a single-year census count.
  • The Census controls ACS state population to its population estimates, so every area in this table is annotated ***** and has no sampling margin of error. The plugin shows a dash where a margin would otherwise appear.
  • Adding the 52 figures does not produce an official United States population. Puerto Rico is included here, and these are ACS period estimates rather than the vintage population estimates used for apportionment.
  • The Census published 50 states, the District of Columbia and Puerto Rico. None of the population estimates were suppressed.
  • Puerto Rico is in the ranking and table. Alaska and Hawaii appear on the ranking; on the map they are shown in inset.