Older population by US state

Summary

Share of residents age 65 and older, US states

Share age 65 and older by state · all 52 states · hover or tap a state for every figure on this page

52 items
View100%
DownloadPDFImageCSV
StatesMaine
Share of residents age 65 and older, US statesDarker shades mark a higher share of residents age 65 and older. Puerto Rico is listed in the ranking and table but is not on this map.Alabama · Population: 5,054,253 · Residents age 65 and older: 884,210 · Margin of error (65+): 6,130.2 · Share age 65 and older: 17.5%Alaska · Population: 733,971 · Residents age 65 and older: 97,815 · Margin of error (65+): 1,745.0 · Share age 65 and older: 13.3%Arizona · Population: 7,268,175 · Residents age 65 and older: 1,349,934 · Margin of error (65+): 7,395.0 · Share age 65 and older: 18.6%Arkansas · Population: 3,032,651 · Residents age 65 and older: 525,644 · Margin of error (65+): 4,342.5 · Share age 65 and older: 17.3%California · Population: 39,242,785 · Residents age 65 and older: 5,994,486 · Margin of error (65+): 15,239.3 · Share age 65 and older: 15.3%Colorado · Population: 5,810,774 · Residents age 65 and older: 882,557 · Margin of error (65+): 5,406.9 · Share age 65 and older: 15.2%Connecticut · Population: 3,598,348 · Residents age 65 and older: 650,772 · Margin of error (65+): 5,064.3 · Share age 65 and older: 18.1%Delaware · Population: 1,005,872 · Residents age 65 and older: 201,255 · Margin of error (65+): 2,708.8 · Share age 65 and older: 20.0%Florida · Population: 21,928,881 · Residents age 65 and older: 4,630,733 · Margin of error (65+): 14,440.1 · Share age 65 and older: 21.1%Georgia · Population: 10,822,590 · Residents age 65 and older: 1,581,263 · Margin of error (65+): 8,306.5 · Share age 65 and older: 14.6%Hawaii · Population: 1,445,635 · Residents age 65 and older: 287,642 · Margin of error (65+): 3,052.5 · Share age 65 and older: 19.9%Idaho · Population: 1,893,296 · Residents age 65 and older: 314,391 · Margin of error (65+): 3,531.5 · Share age 65 and older: 16.6%Illinois · Population: 12,692,653 · Residents age 65 and older: 2,101,833 · Margin of error (65+): 8,866.9 · Share age 65 and older: 16.6%Indiana · Population: 6,811,752 · Residents age 65 and older: 1,116,303 · Margin of error (65+): 6,369.6 · Share age 65 and older: 16.4%Iowa · Population: 3,195,937 · Residents age 65 and older: 569,081 · Margin of error (65+): 3,802.1 · Share age 65 and older: 17.8%Kansas · Population: 2,937,569 · Residents age 65 and older: 486,659 · Margin of error (65+): 4,256.1 · Share age 65 and older: 16.6%Kentucky · Population: 4,510,725 · Residents age 65 and older: 767,995 · Margin of error (65+): 5,061.0 · Share age 65 and older: 17.0%Louisiana · Population: 4,621,025 · Residents age 65 and older: 753,854 · Margin of error (65+): 5,837.4 · Share age 65 and older: 16.3%Maine · Population: 1,377,400 · Residents age 65 and older: 301,161 · Margin of error (65+): 3,203.4 · Share age 65 and older: 21.9%Maryland · Population: 6,170,738 · Residents age 65 and older: 1,003,219 · Margin of error (65+): 6,167.8 · Share age 65 and older: 16.3%Massachusetts · Population: 6,992,395 · Residents age 65 and older: 1,221,349 · Margin of error (65+): 6,662.5 · Share age 65 and older: 17.5%Michigan · Population: 10,051,595 · Residents age 65 and older: 1,824,907 · Margin of error (65+): 7,680.6 · Share age 65 and older: 18.2%Minnesota · Population: 5,713,716 · Residents age 65 and older: 962,143 · Margin of error (65+): 5,161.8 · Share age 65 and older: 16.8%Mississippi · Population: 2,951,438 · Residents age 65 and older: 495,115 · Margin of error (65+): 4,257.8 · Share age 65 and older: 16.8%Missouri · Population: 6,168,181 · Residents age 65 and older: 1,079,129 · Margin of error (65+): 6,065.5 · Share age 65 and older: 17.5%Montana · Population: 1,105,072 · Residents age 65 and older: 217,665 · Margin of error (65+): 2,449.7 · Share age 65 and older: 19.7%Nebraska · Population: 1,965,926 · Residents age 65 and older: 322,165 · Margin of error (65+): 2,800.8 · Share age 65 and older: 16.4%Nevada · Population: 3,141,000 · Residents age 65 and older: 522,417 · Margin of error (65+): 4,741.6 · Share age 65 and older: 16.6%New Hampshire · Population: 1,387,834 · Residents age 65 and older: 270,525 · Margin of error (65+): 3,173.6 · Share age 65 and older: 19.5%New Jersey · Population: 9,267,014 · Residents age 65 and older: 1,559,816 · Margin of error (65+): 7,836.5 · Share age 65 and older: 16.8%New Mexico · Population: 2,114,768 · Residents age 65 and older: 397,156 · Margin of error (65+): 4,119.9 · Share age 65 and older: 18.8%New York · Population: 19,872,319 · Residents age 65 and older: 3,461,186 · Margin of error (65+): 12,618.2 · Share age 65 and older: 17.4%North Carolina · Population: 10,584,340 · Residents age 65 and older: 1,787,027 · Margin of error (65+): 8,174.3 · Share age 65 and older: 16.9%North Dakota · Population: 779,361 · Residents age 65 and older: 126,120 · Margin of error (65+): 1,876.5 · Share age 65 and older: 16.2%Ohio · Population: 11,780,046 · Residents age 65 and older: 2,103,043 · Margin of error (65+): 8,795.1 · Share age 65 and older: 17.9%Oklahoma · Population: 3,995,260 · Residents age 65 and older: 642,174 · Margin of error (65+): 4,558.3 · Share age 65 and older: 16.1%Oregon · Population: 4,238,714 · Residents age 65 and older: 789,610 · Margin of error (65+): 5,495.6 · Share age 65 and older: 18.6%Pennsylvania · Population: 12,986,518 · Residents age 65 and older: 2,476,241 · Margin of error (65+): 9,661.6 · Share age 65 and older: 19.1%Rhode Island · Population: 1,095,371 · Residents age 65 and older: 199,921 · Margin of error (65+): 2,922.5 · Share age 65 and older: 18.3%South Carolina · Population: 5,212,774 · Residents age 65 and older: 963,569 · Margin of error (65+): 6,290.0 · Share age 65 and older: 18.5%South Dakota · Population: 899,194 · Residents age 65 and older: 158,103 · Margin of error (65+): 2,198.5 · Share age 65 and older: 17.6%Tennessee · Population: 6,986,082 · Residents age 65 and older: 1,172,740 · Margin of error (65+): 6,756.6 · Share age 65 and older: 16.8%Texas · Population: 29,640,343 · Residents age 65 and older: 3,905,545 · Margin of error (65+): 13,386.0 · Share age 65 and older: 13.2%Utah · Population: 3,331,187 · Residents age 65 and older: 387,028 · Margin of error (65+): 3,908.7 · Share age 65 and older: 11.6%Vermont · Population: 645,254 · Residents age 65 and older: 134,141 · Margin of error (65+): 1,926.7 · Share age 65 and older: 20.8%Virginia · Population: 8,657,499 · Residents age 65 and older: 1,410,160 · Margin of error (65+): 6,972.2 · Share age 65 and older: 16.3%Washington · Population: 7,740,984 · Residents age 65 and older: 1,259,313 · Margin of error (65+): 6,941.0 · Share age 65 and older: 16.3%West Virginia · Population: 1,784,462 · Residents age 65 and older: 368,989 · Margin of error (65+): 3,784.1 · Share age 65 and older: 20.7%Wisconsin · Population: 5,892,023 · Residents age 65 and older: 1,062,121 · Margin of error (65+): 5,915.3 · Share age 65 and older: 18.0%Wyoming · Population: 579,761 · Residents age 65 and older: 104,321 · Margin of error (65+): 1,902.4 · Share age 65 and older: 18.0%District of Columbia · Population: 672,079 · Residents age 65 and older: 85,501 · Margin of error (65+): 2,045.0 · Share age 65 and older: 12.7%District of Columbia · Population: 672,079 · Residents age 65 and older: 85,501 · Margin of error (65+): 2,045.0 · Share age 65 and older: 12.7%Share age 65 and older11.6%21.9%
Summary

Darker shades mark a higher share of residents age 65 and older. Puerto Rico is listed in the ranking and table but is not on this map.

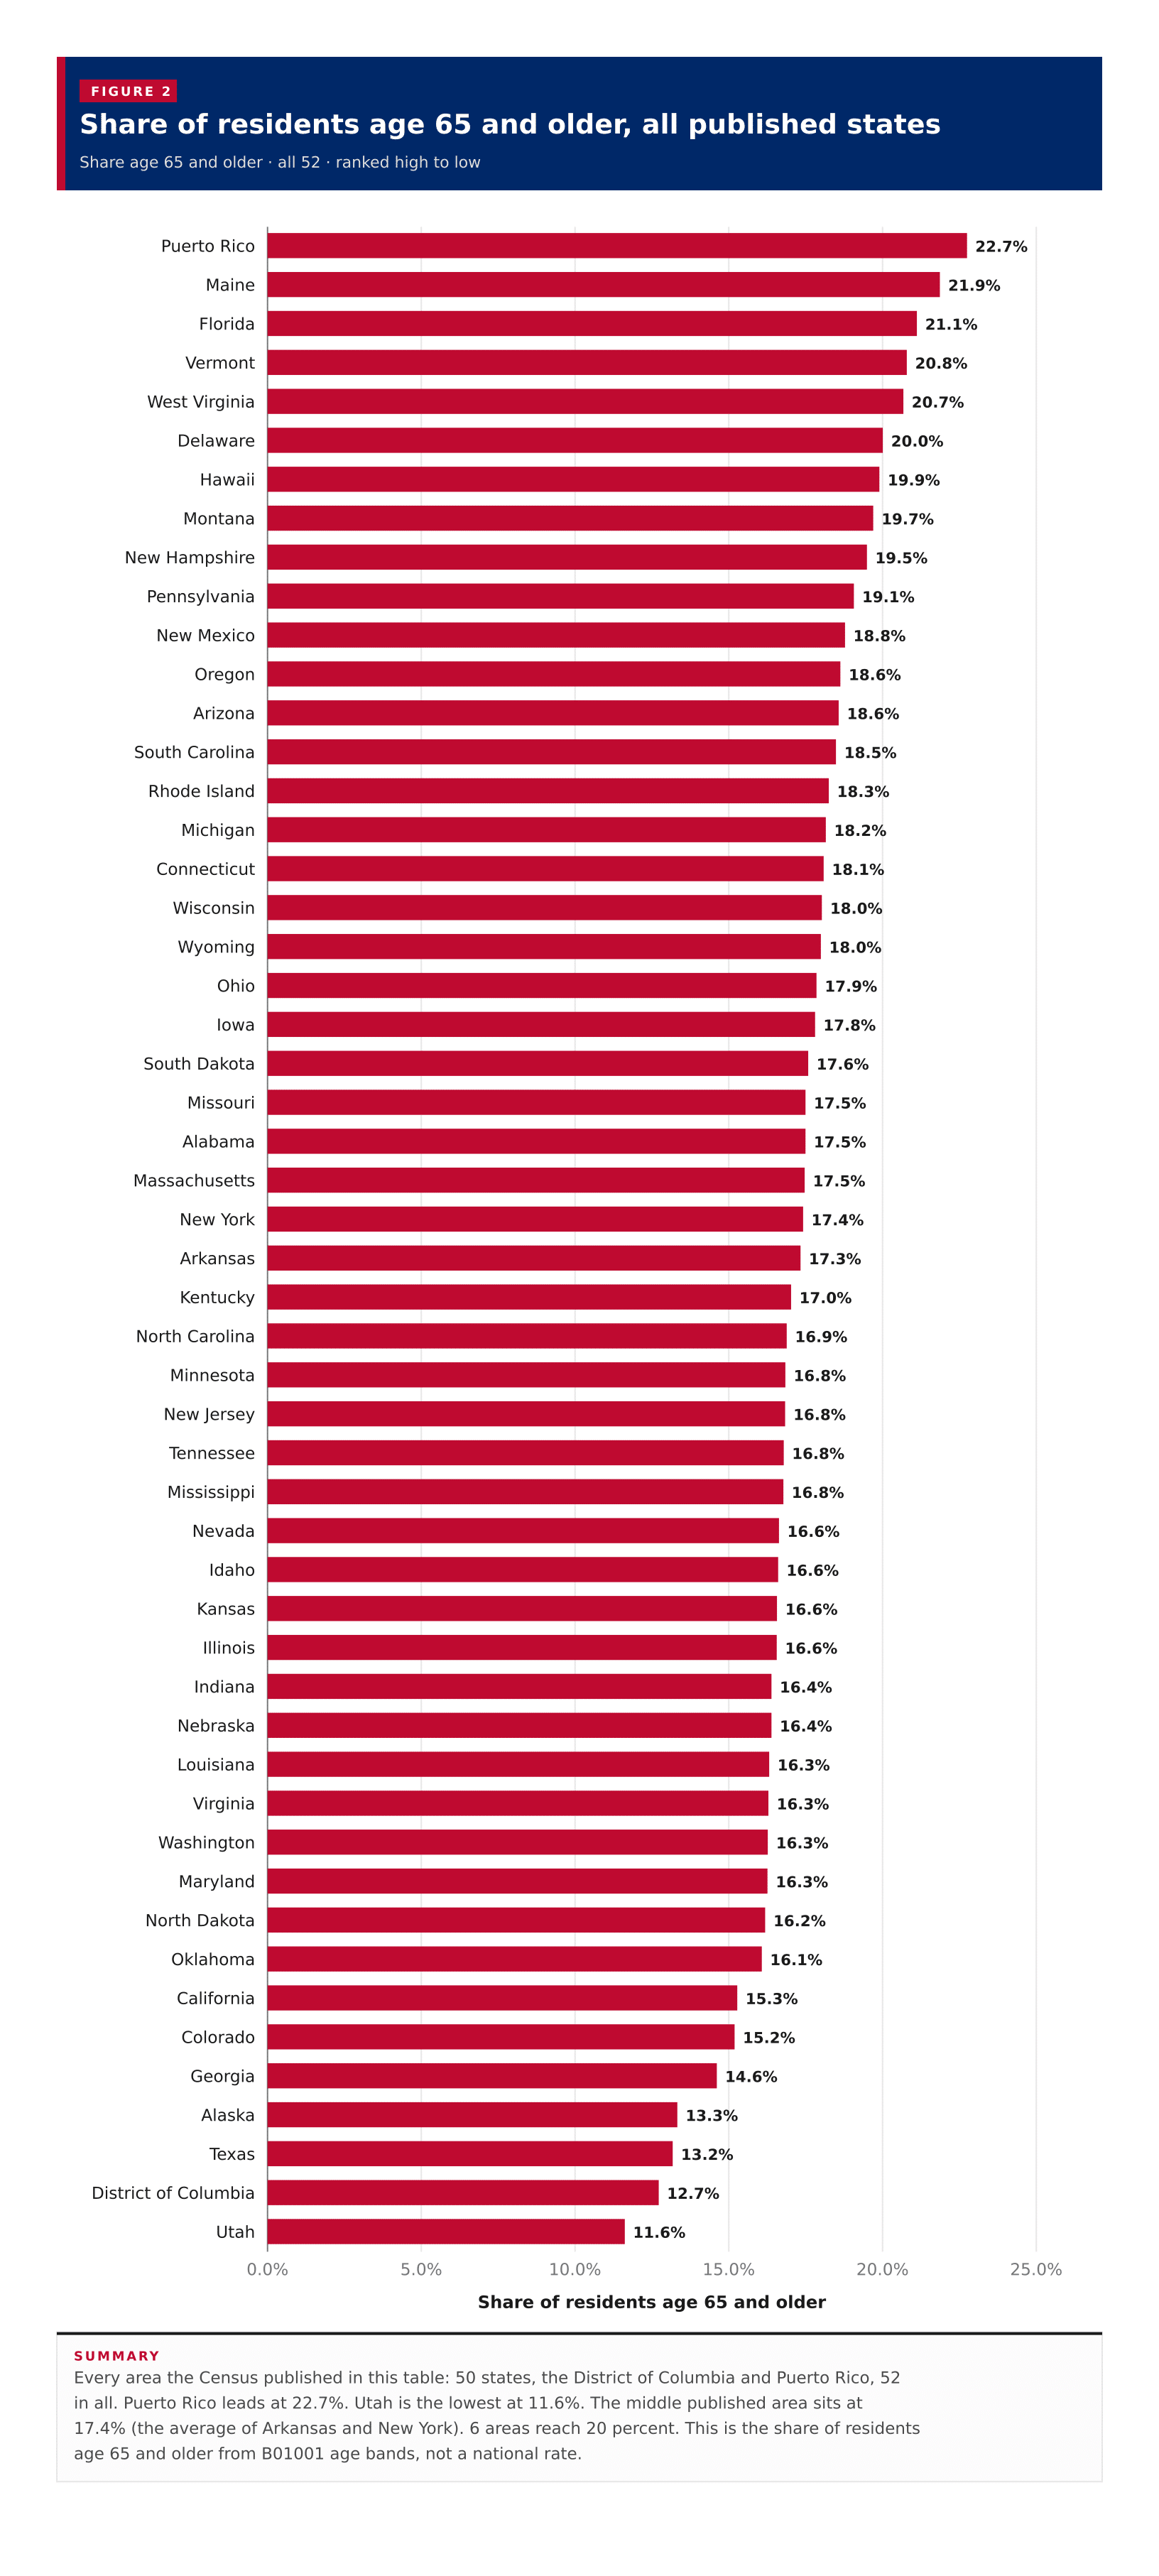
A typical published area has 17.4% of residents age 65 and older, the midpoint of the 50 states, the District of Columbia and Puerto Rico on the 2023 ACS five-year estimates (the average of Arkansas at 17.3% and New York at 17.4%). That midpoint of state shares is not a United States 65-and-older rate. Puerto Rico has the highest share at 22.7%, and Utah has the lowest at 11.6%.

In short

17.4%typical published areamidpoint of the 52 ranked shares, not a national rate
22.7%Puerto Ricohighest share age 65 and older
11.6%Utahlowest share age 65 and older
21.9%Mainehighest among the 50 states
6areas at or above 20%of the 52 published areas
Figure 1

Share of residents age 65 and older, all published states

Share age 65 and older · all 52 · ranked high to low

52 items
View100%
DownloadPDFImageCSV
Share of residents age 65 and older, all published statesEvery area the Census published in this table: 50 states, the District of Columbia and Puerto Rico, 52 in all. Puerto Rico leads at 22.7%. Utah is the lowest at 11.6%. The middle published area sits at 17.4% (the average of Arkansas and New York). 6 areas reach 20 percent. This is the share of residents age 65 and older from B01001 age bands, not a national rate.0.0%5.0%10.0%15.0%20.0%25.0%Share of residents age 65 and older22.7%Puerto Rico21.9%Maine21.1%Florida20.8%Vermont20.7%West Virginia20.0%Delaware19.9%Hawaii19.7%Montana19.5%New Hampshire19.1%Pennsylvania18.8%New Mexico18.6%Oregon18.6%Arizona18.5%South Carolina18.3%Rhode Island18.2%Michigan18.1%Connecticut18.0%Wisconsin18.0%Wyoming17.9%Ohio17.8%Iowa17.6%South Dakota17.5%Missouri17.5%Alabama17.5%Massachusetts17.4%New York17.3%Arkansas17.0%Kentucky16.9%North Carolina16.8%Minnesota16.8%New Jersey16.8%Tennessee16.8%Mississippi16.6%Nevada16.6%Idaho16.6%Kansas16.6%Illinois16.4%Indiana16.4%Nebraska16.3%Louisiana16.3%Virginia16.3%Washington16.3%Maryland16.2%North Dakota16.1%Oklahoma15.3%California15.2%Colorado14.6%Georgia13.3%Alaska13.2%Texas12.7%District of Columbia11.6%Utah
Summary

Every area the Census published in this table: 50 states, the District of Columbia and Puerto Rico, 52 in all. Puerto Rico leads at 22.7%. Utah is the lowest at 11.6%. The middle published area sits at 17.4% (the average of Arkansas and New York). 6 areas reach 20 percent. This is the share of residents age 65 and older from B01001 age bands, not a national rate.

Table 1

All states

52 rows · 5 columns · sorted by share age 65 and older, high to low

52 rows
View100%
DownloadPDFImageCSV
Summary

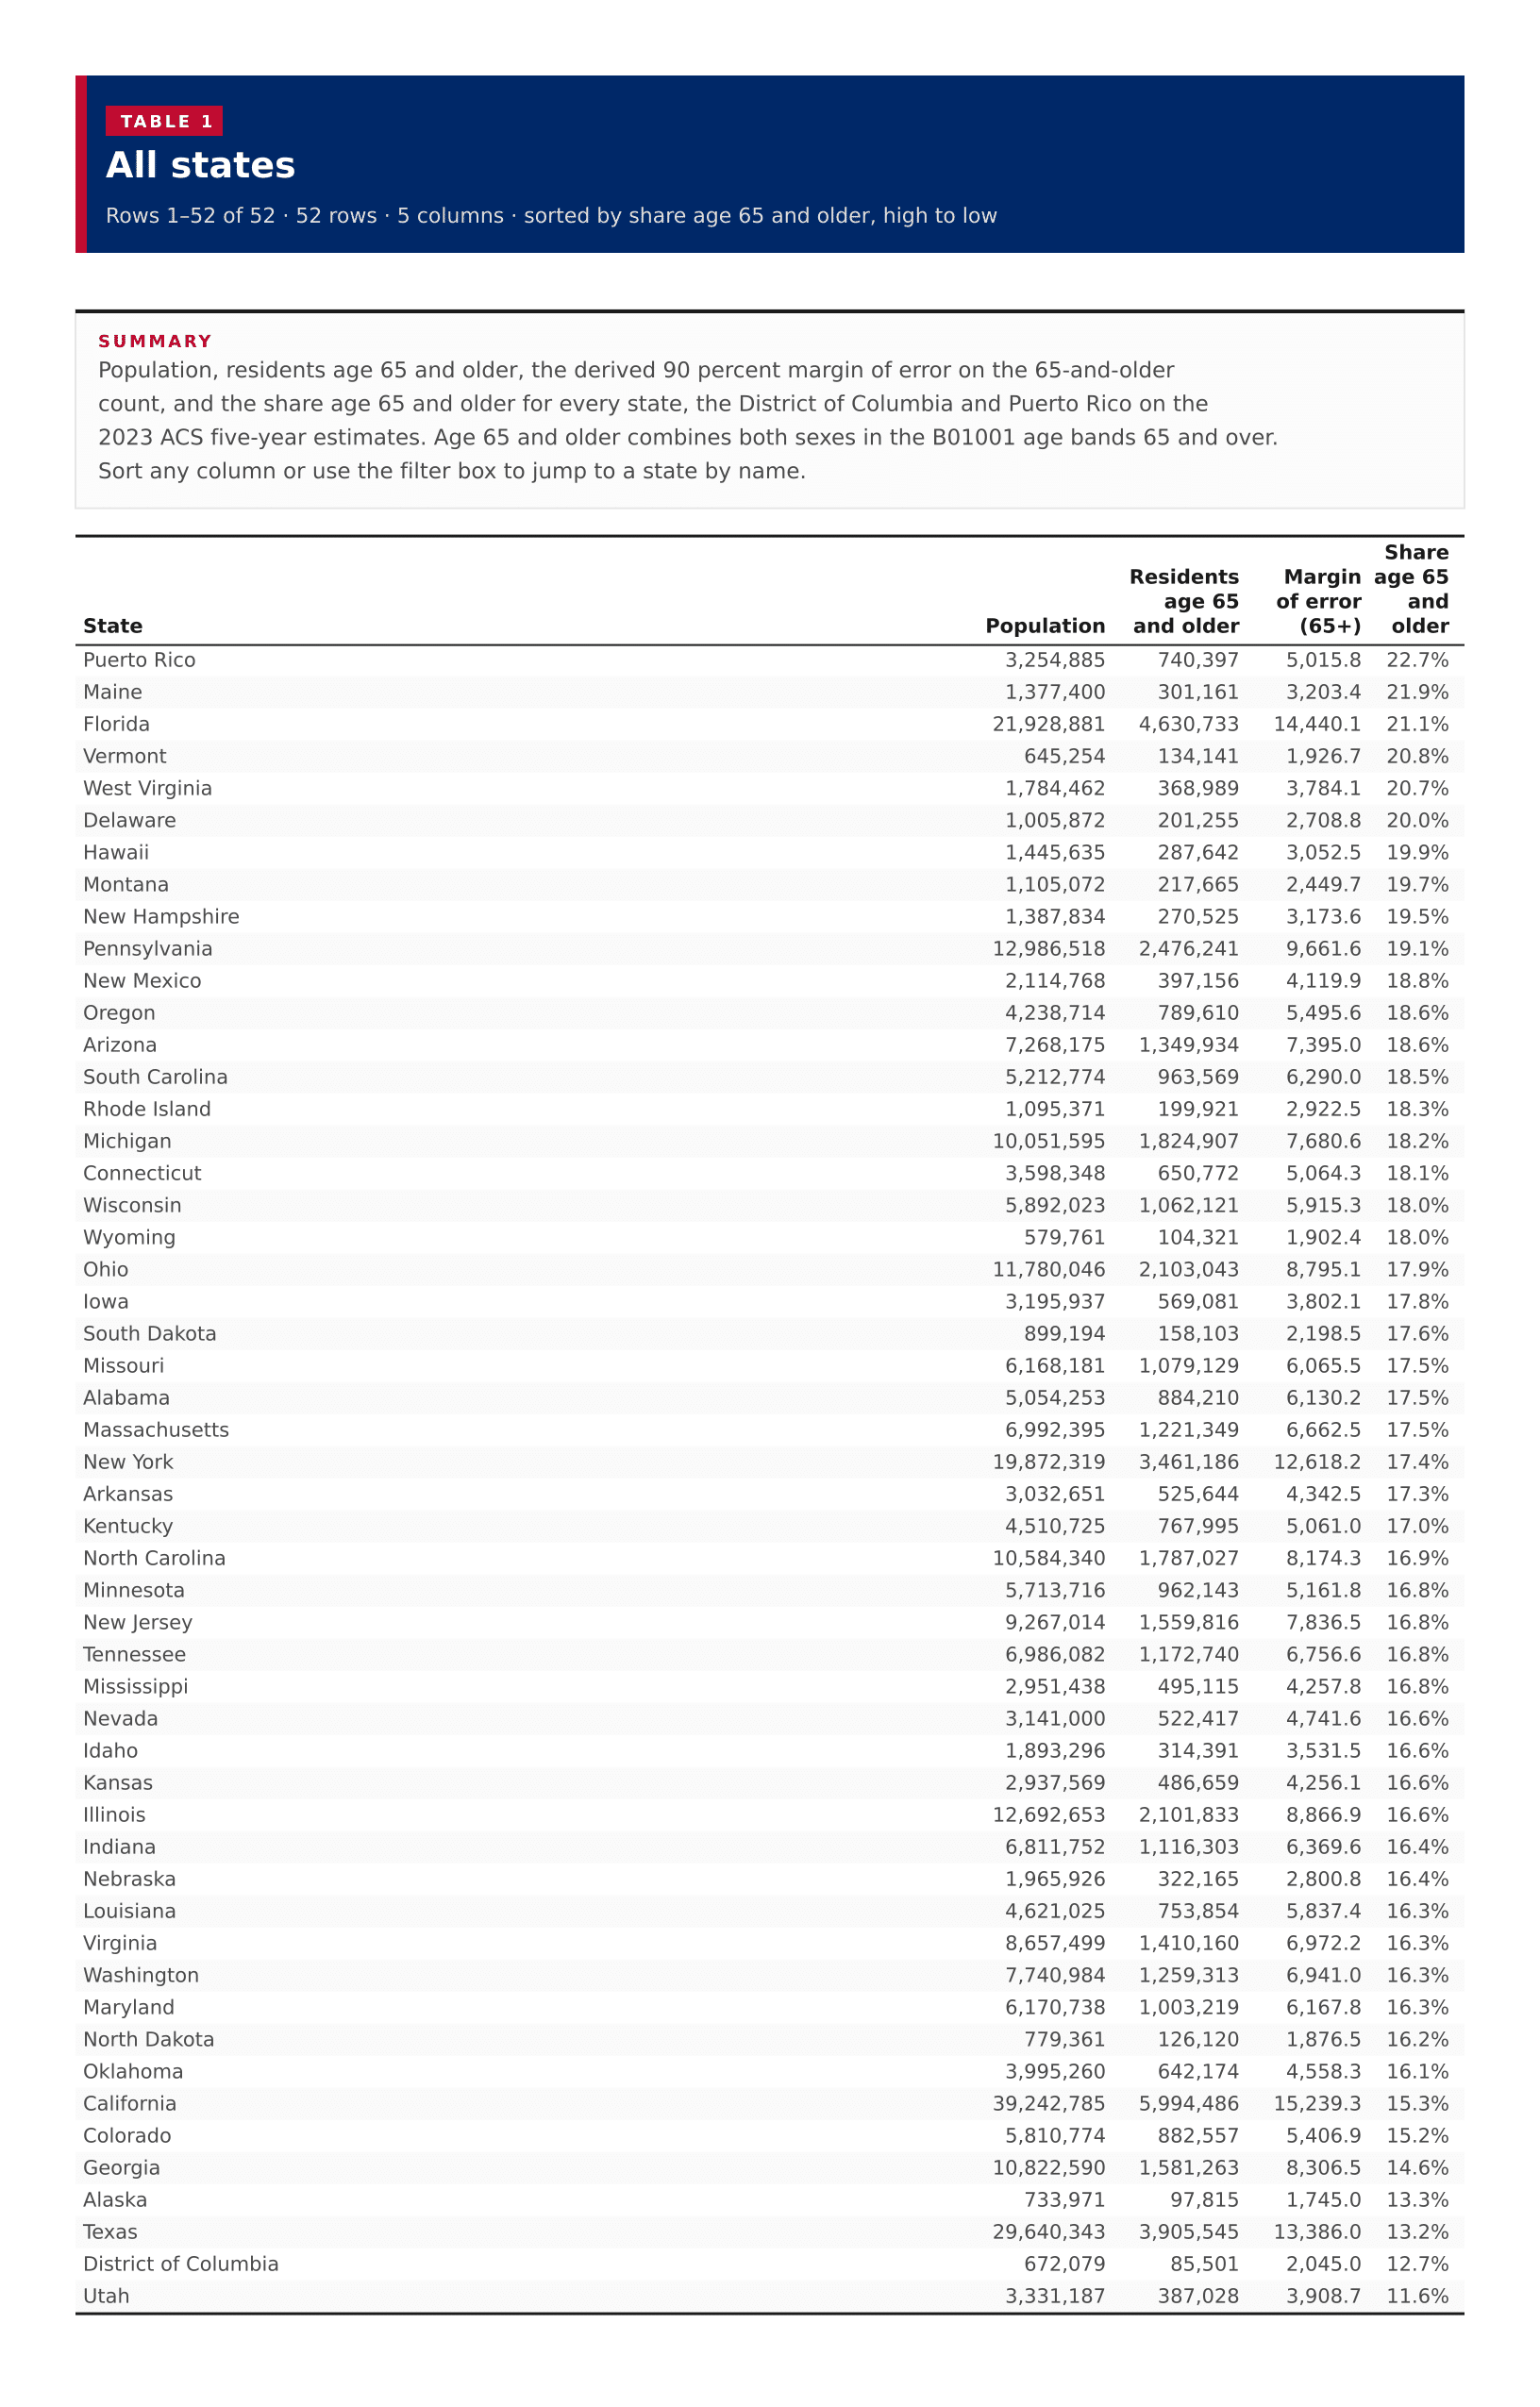
Population, residents age 65 and older, the derived 90 percent margin of error on the 65-and-older count, and the share age 65 and older for every state, the District of Columbia and Puerto Rico on the 2023 ACS five-year estimates. Age 65 and older combines both sexes in the B01001 age bands 65 and over. Sort any column or use the filter box to jump to a state by name.

All states
????
Puerto Rico3,254,885740,3975,015.822.7%
Maine1,377,400301,1613,203.421.9%
Florida21,928,8814,630,73314,440.121.1%
Vermont645,254134,1411,926.720.8%
West Virginia1,784,462368,9893,784.120.7%
Delaware1,005,872201,2552,708.820.0%
Hawaii1,445,635287,6423,052.519.9%
Montana1,105,072217,6652,449.719.7%
New Hampshire1,387,834270,5253,173.619.5%
Pennsylvania12,986,5182,476,2419,661.619.1%
New Mexico2,114,768397,1564,119.918.8%
Oregon4,238,714789,6105,495.618.6%
Arizona7,268,1751,349,9347,395.018.6%
South Carolina5,212,774963,5696,290.018.5%
Rhode Island1,095,371199,9212,922.518.3%
Michigan10,051,5951,824,9077,680.618.2%
Connecticut3,598,348650,7725,064.318.1%
Wisconsin5,892,0231,062,1215,915.318.0%
Wyoming579,761104,3211,902.418.0%
Ohio11,780,0462,103,0438,795.117.9%
Iowa3,195,937569,0813,802.117.8%
South Dakota899,194158,1032,198.517.6%
Missouri6,168,1811,079,1296,065.517.5%
Alabama5,054,253884,2106,130.217.5%
Massachusetts6,992,3951,221,3496,662.517.5%
New York19,872,3193,461,18612,618.217.4%
Arkansas3,032,651525,6444,342.517.3%
Kentucky4,510,725767,9955,061.017.0%
North Carolina10,584,3401,787,0278,174.316.9%
Minnesota5,713,716962,1435,161.816.8%
New Jersey9,267,0141,559,8167,836.516.8%
Tennessee6,986,0821,172,7406,756.616.8%
Mississippi2,951,438495,1154,257.816.8%
Nevada3,141,000522,4174,741.616.6%
Idaho1,893,296314,3913,531.516.6%
Kansas2,937,569486,6594,256.116.6%
Illinois12,692,6532,101,8338,866.916.6%
Indiana6,811,7521,116,3036,369.616.4%
Nebraska1,965,926322,1652,800.816.4%
Louisiana4,621,025753,8545,837.416.3%
Virginia8,657,4991,410,1606,972.216.3%
Washington7,740,9841,259,3136,941.016.3%
Maryland6,170,7381,003,2196,167.816.3%
North Dakota779,361126,1201,876.516.2%
Oklahoma3,995,260642,1744,558.316.1%
California39,242,7855,994,48615,239.315.3%
Colorado5,810,774882,5575,406.915.2%
Georgia10,822,5901,581,2638,306.514.6%
Alaska733,97197,8151,745.013.3%
Texas29,640,3433,905,54513,386.013.2%
District of Columbia672,07985,5012,045.012.7%
Utah3,331,187387,0283,908.711.6%

Image files

Download all

Figure 1

Share of residents age 65 and older, US states
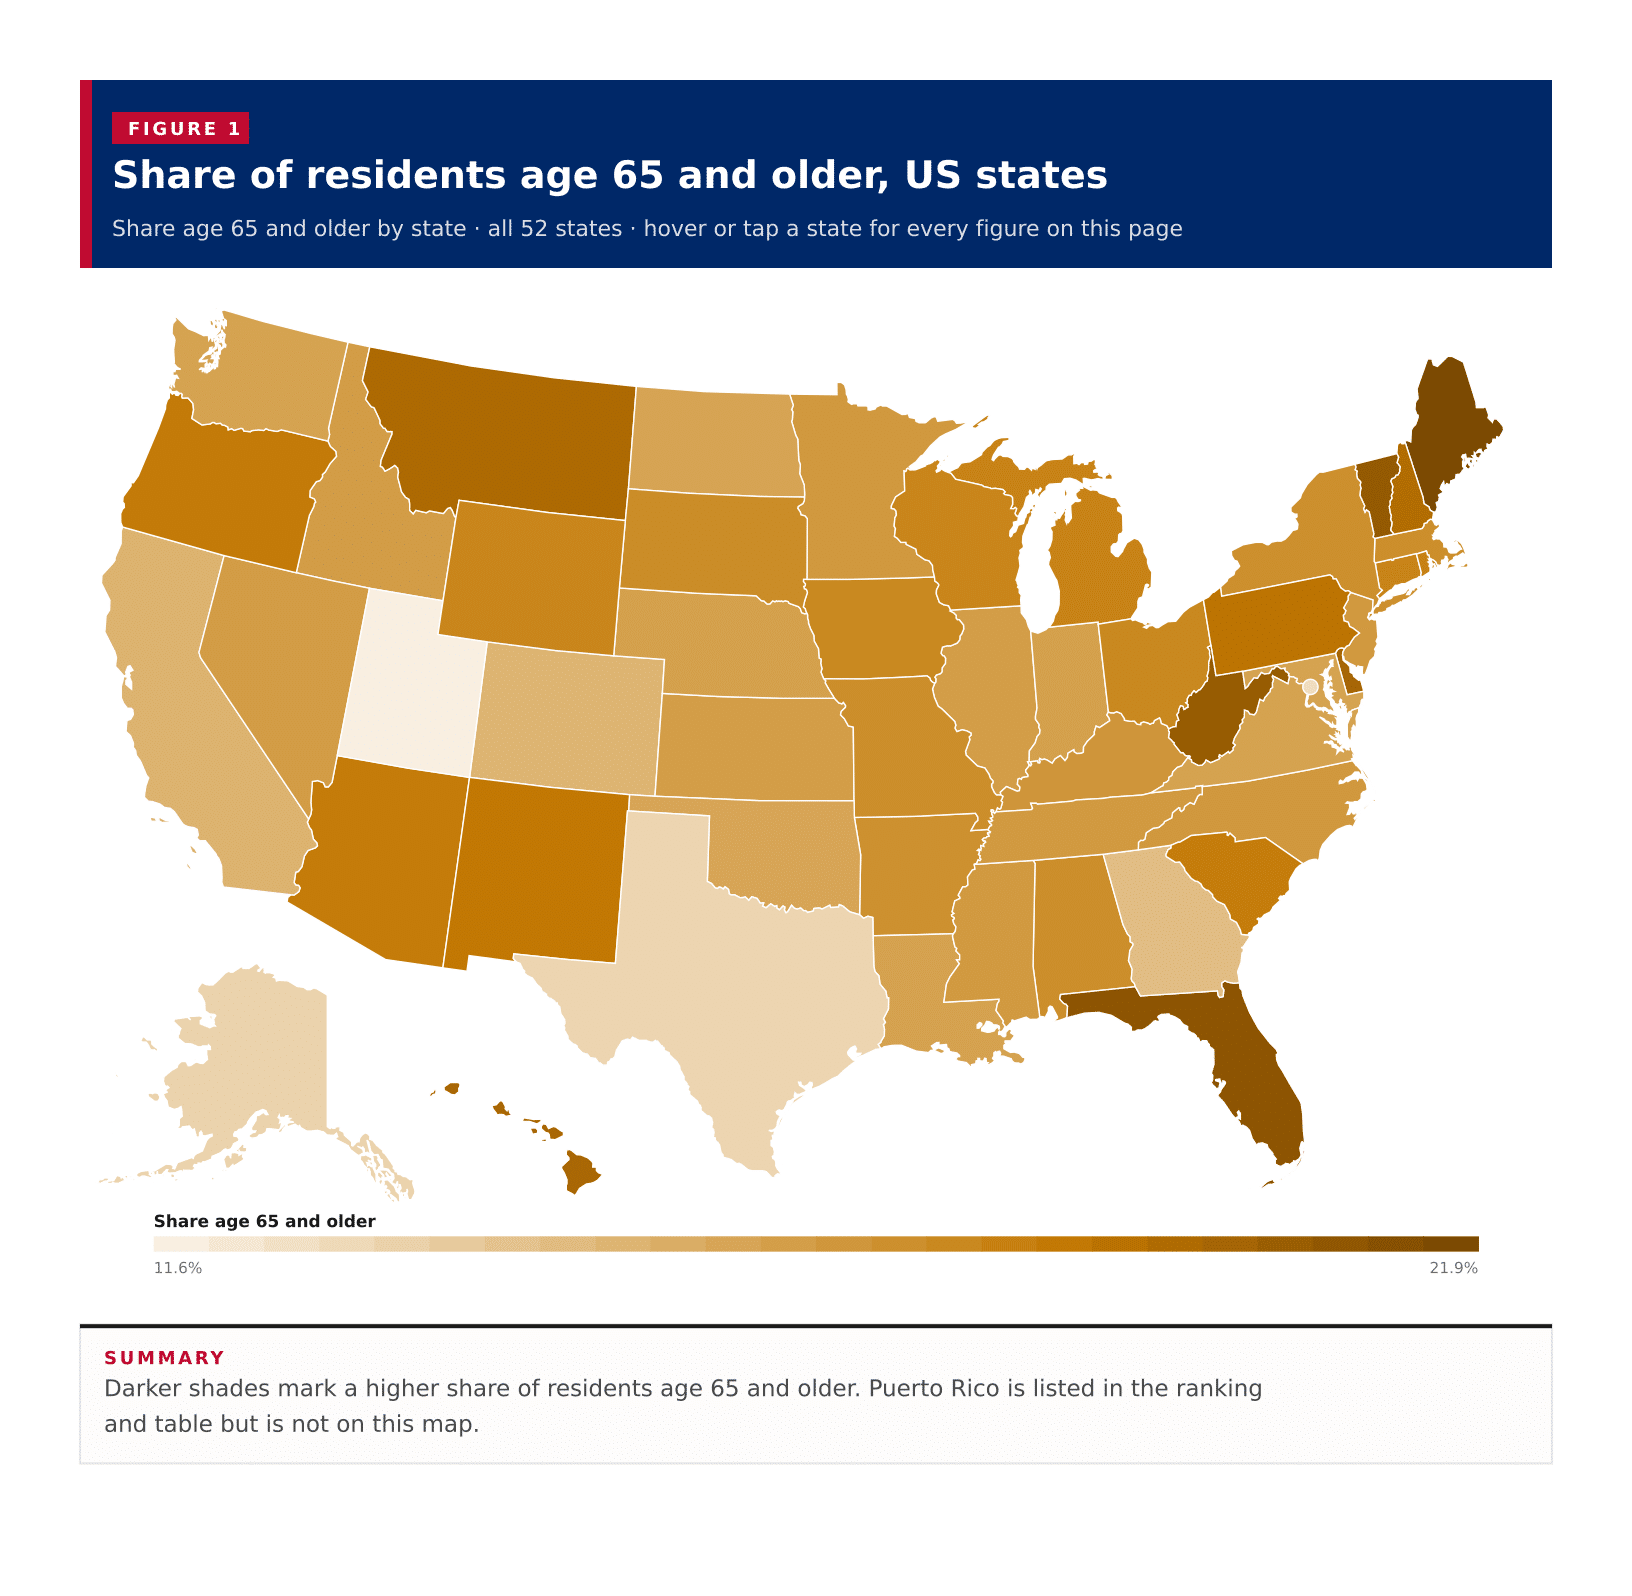
Figure 1: Share of residents age 65 and older, US states
DownloadPDFImageCSV

Figure 2

Share of residents age 65 and older, all published states

Figure 2: Share of residents age 65 and older, all published states
DownloadPDFImageCSV

About this data

  • ACS 2023 5-year estimates. Residents age 65 and older are both sexes from B01001 age bands (male B01001_020E through B01001_025E and female B01001_044E through B01001_049E), summed from the unrounded ACS estimates.
  • Share age 65 and older is that count divided by total population in the same area from B01001_001E.
  • A midpoint of state shares is not a United States 65-and-older rate. The national figure would weight each area by population.
  • Puerto Rico is included. Alaska and Hawaii appear in the ranking and table; on the map they are shown in the inset.
  • Total population margins of error are often controlled; B01001_001M was dropped from the published columns. Controlled or sentinel ACS margins of error are stored as null.
  • The 65-and-older margin of error is the square root of the sum of squared 90 percent MOEs on the twelve age-band components when every component MOE is published. If any component MOE is controlled or missing, older_65_moe is null.

References

U.S. Census Bureau, 2023 American Community Survey 5-Year Estimates · retrieved 2026-09-27