Figure 1
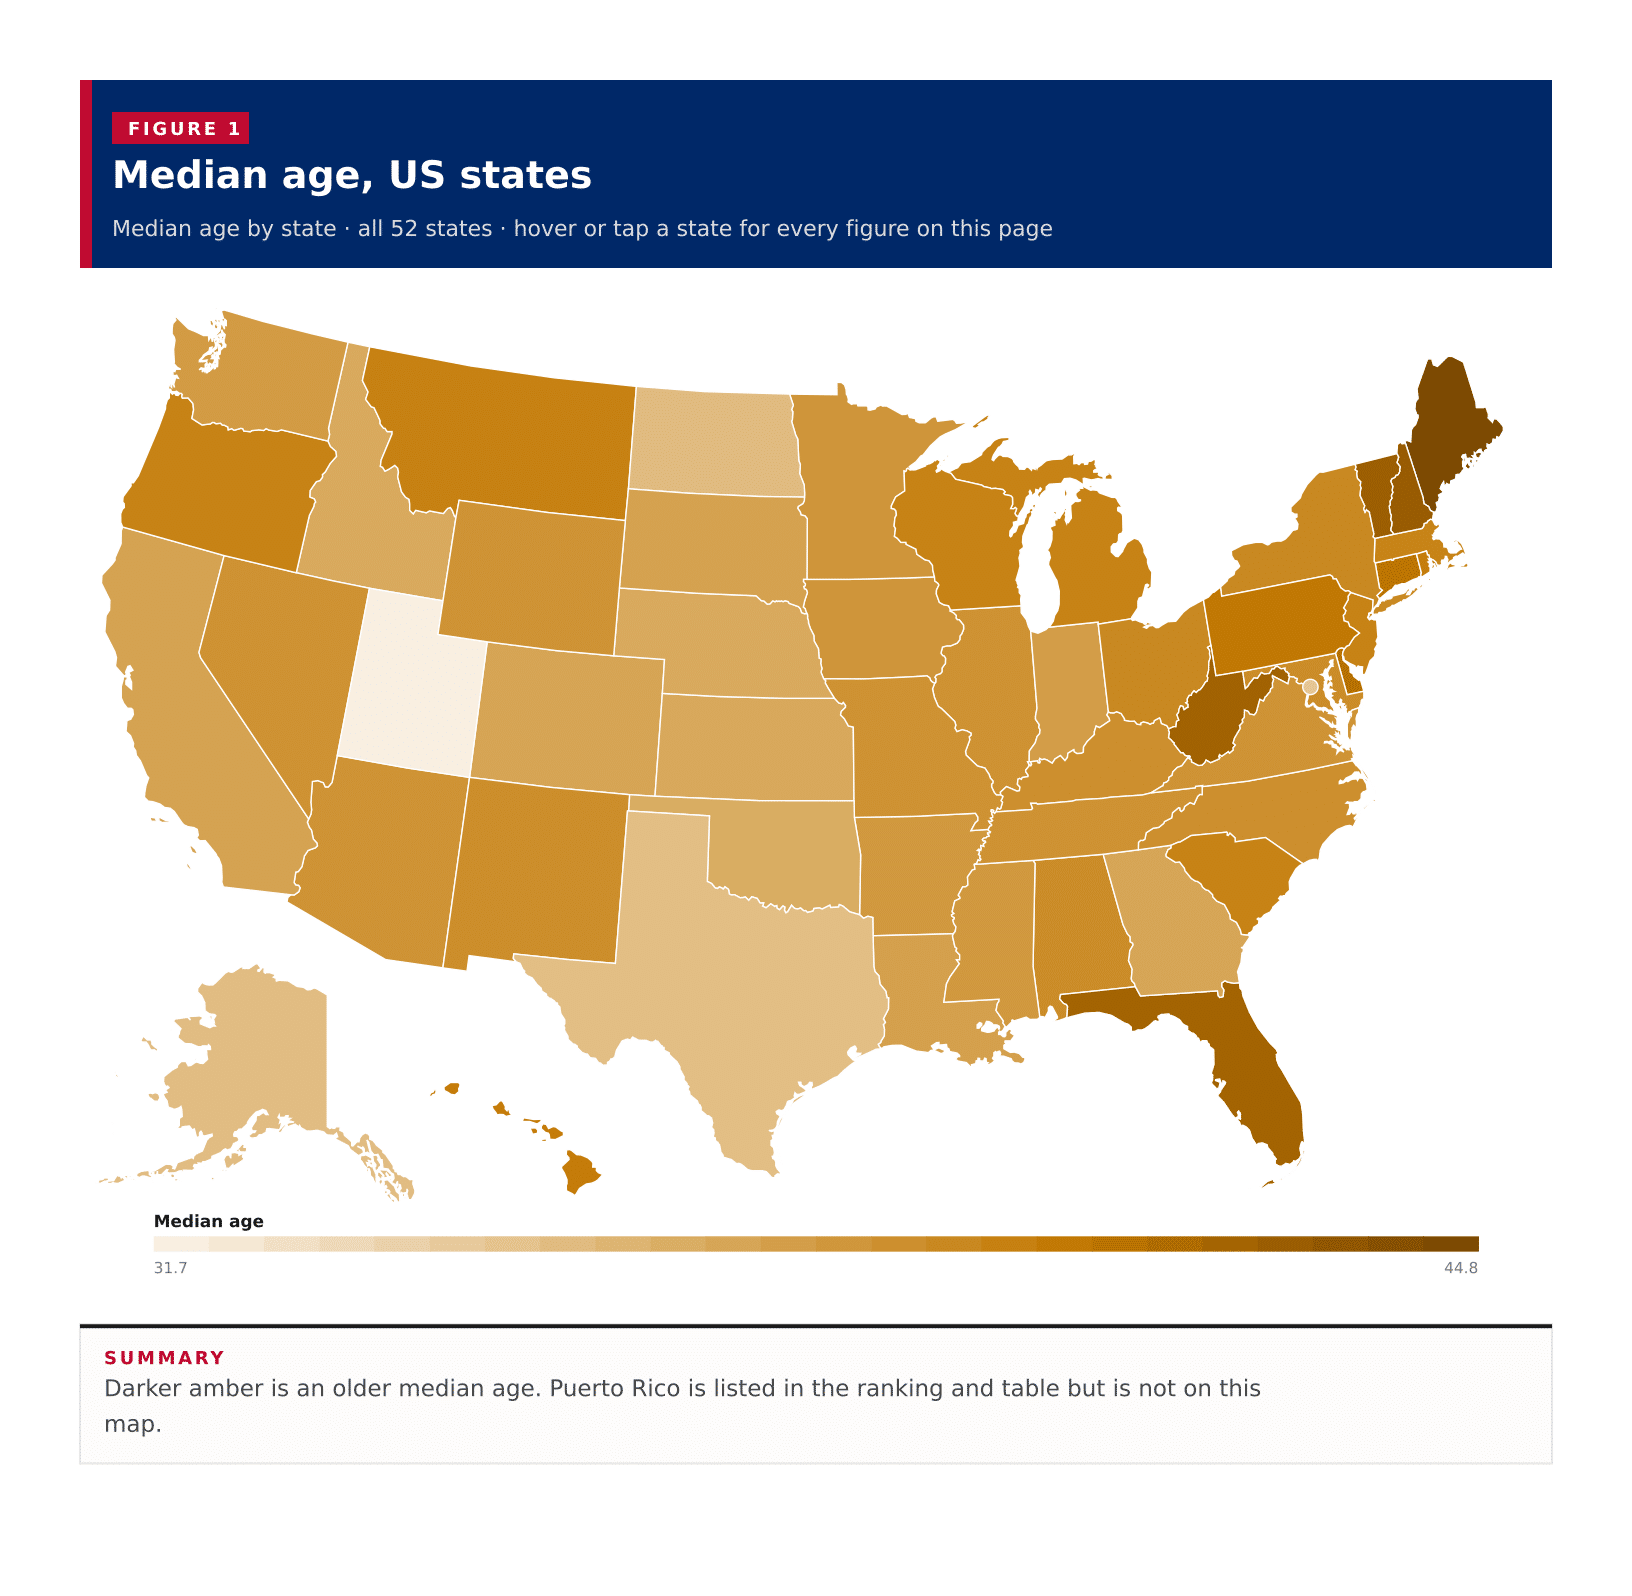
Median age, US states

Median age by state · all 52 states · hover or tap a state for every figure on this page
A typical published area has a median age of 38.9 years, the midpoint of the 50 states, the District of Columbia and Puerto Rico on the 2023 ACS five-year estimates. Maine is the oldest state at 44.8, and New Hampshire, Vermont, West Virginia and Florida also sit above 42. Utah is the youngest of the 50 states at 31.7. Puerto Rico, which this table also returns, is 44.2, older than every state except Maine. The District of Columbia is 34.9. Maine is 13.1 years older than Utah. These are medians for people in each area, not a United States median: the 38.9-year midpoint is a typical-state figure.
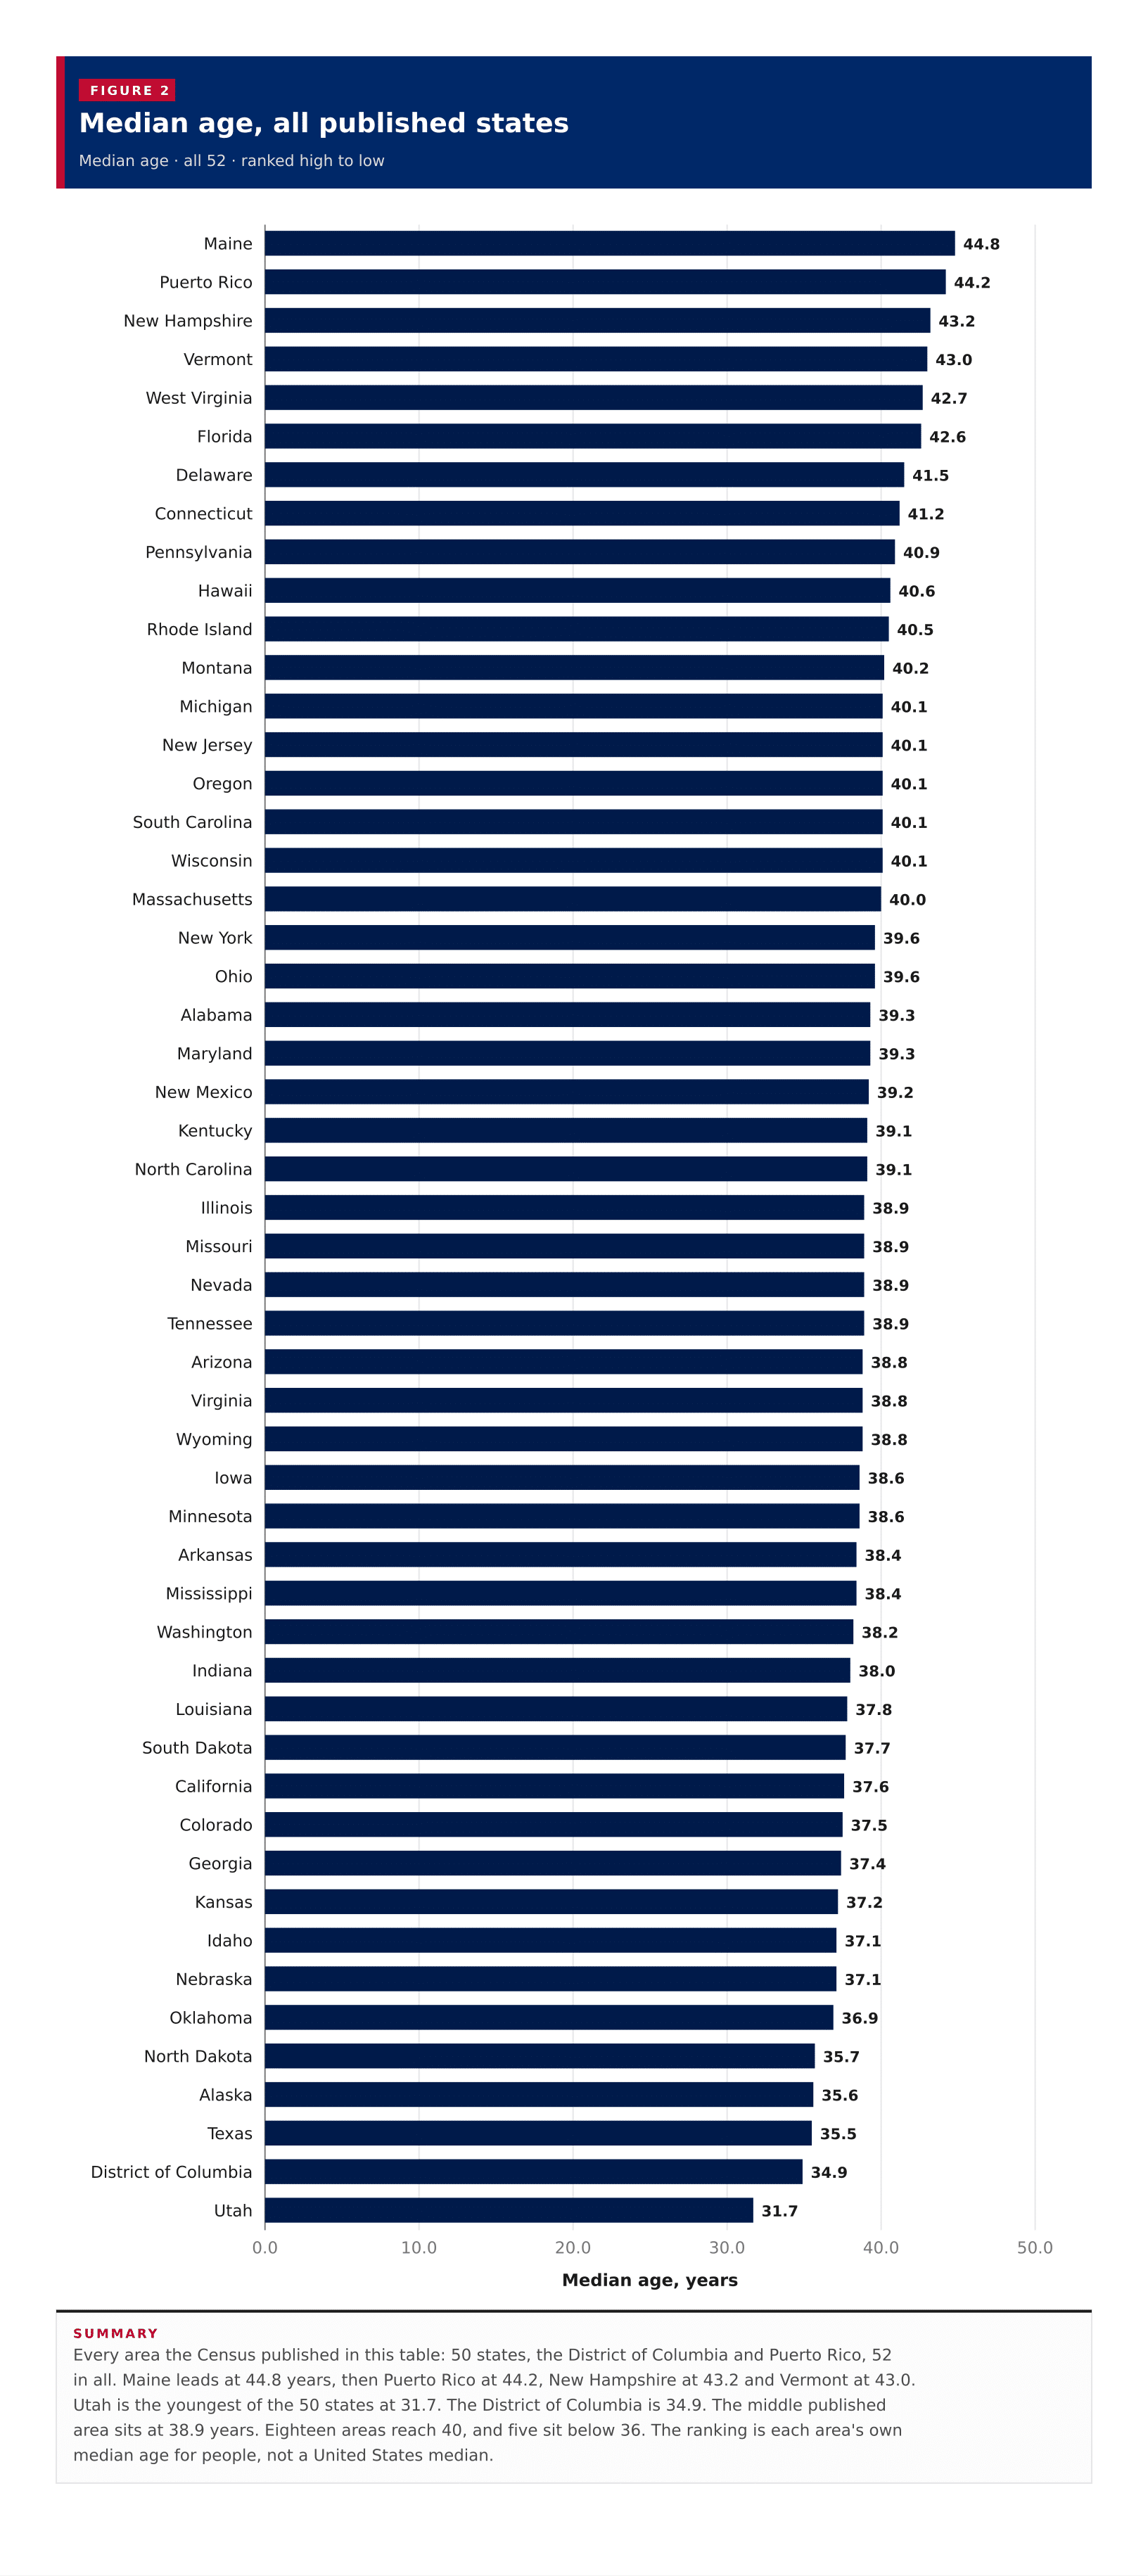
Median age · all 52 · ranked high to low
Every area the Census published in this table: 50 states, the District of Columbia and Puerto Rico, 52 in all. Maine leads at 44.8 years, then Puerto Rico at 44.2, New Hampshire at 43.2 and Vermont at 43.0. Utah is the youngest of the 50 states at 31.7. The District of Columbia is 34.9. The middle published area sits at 38.9 years. Eighteen areas reach 40, and five sit below 36. The ranking is each area's own median age for people, not a United States median.
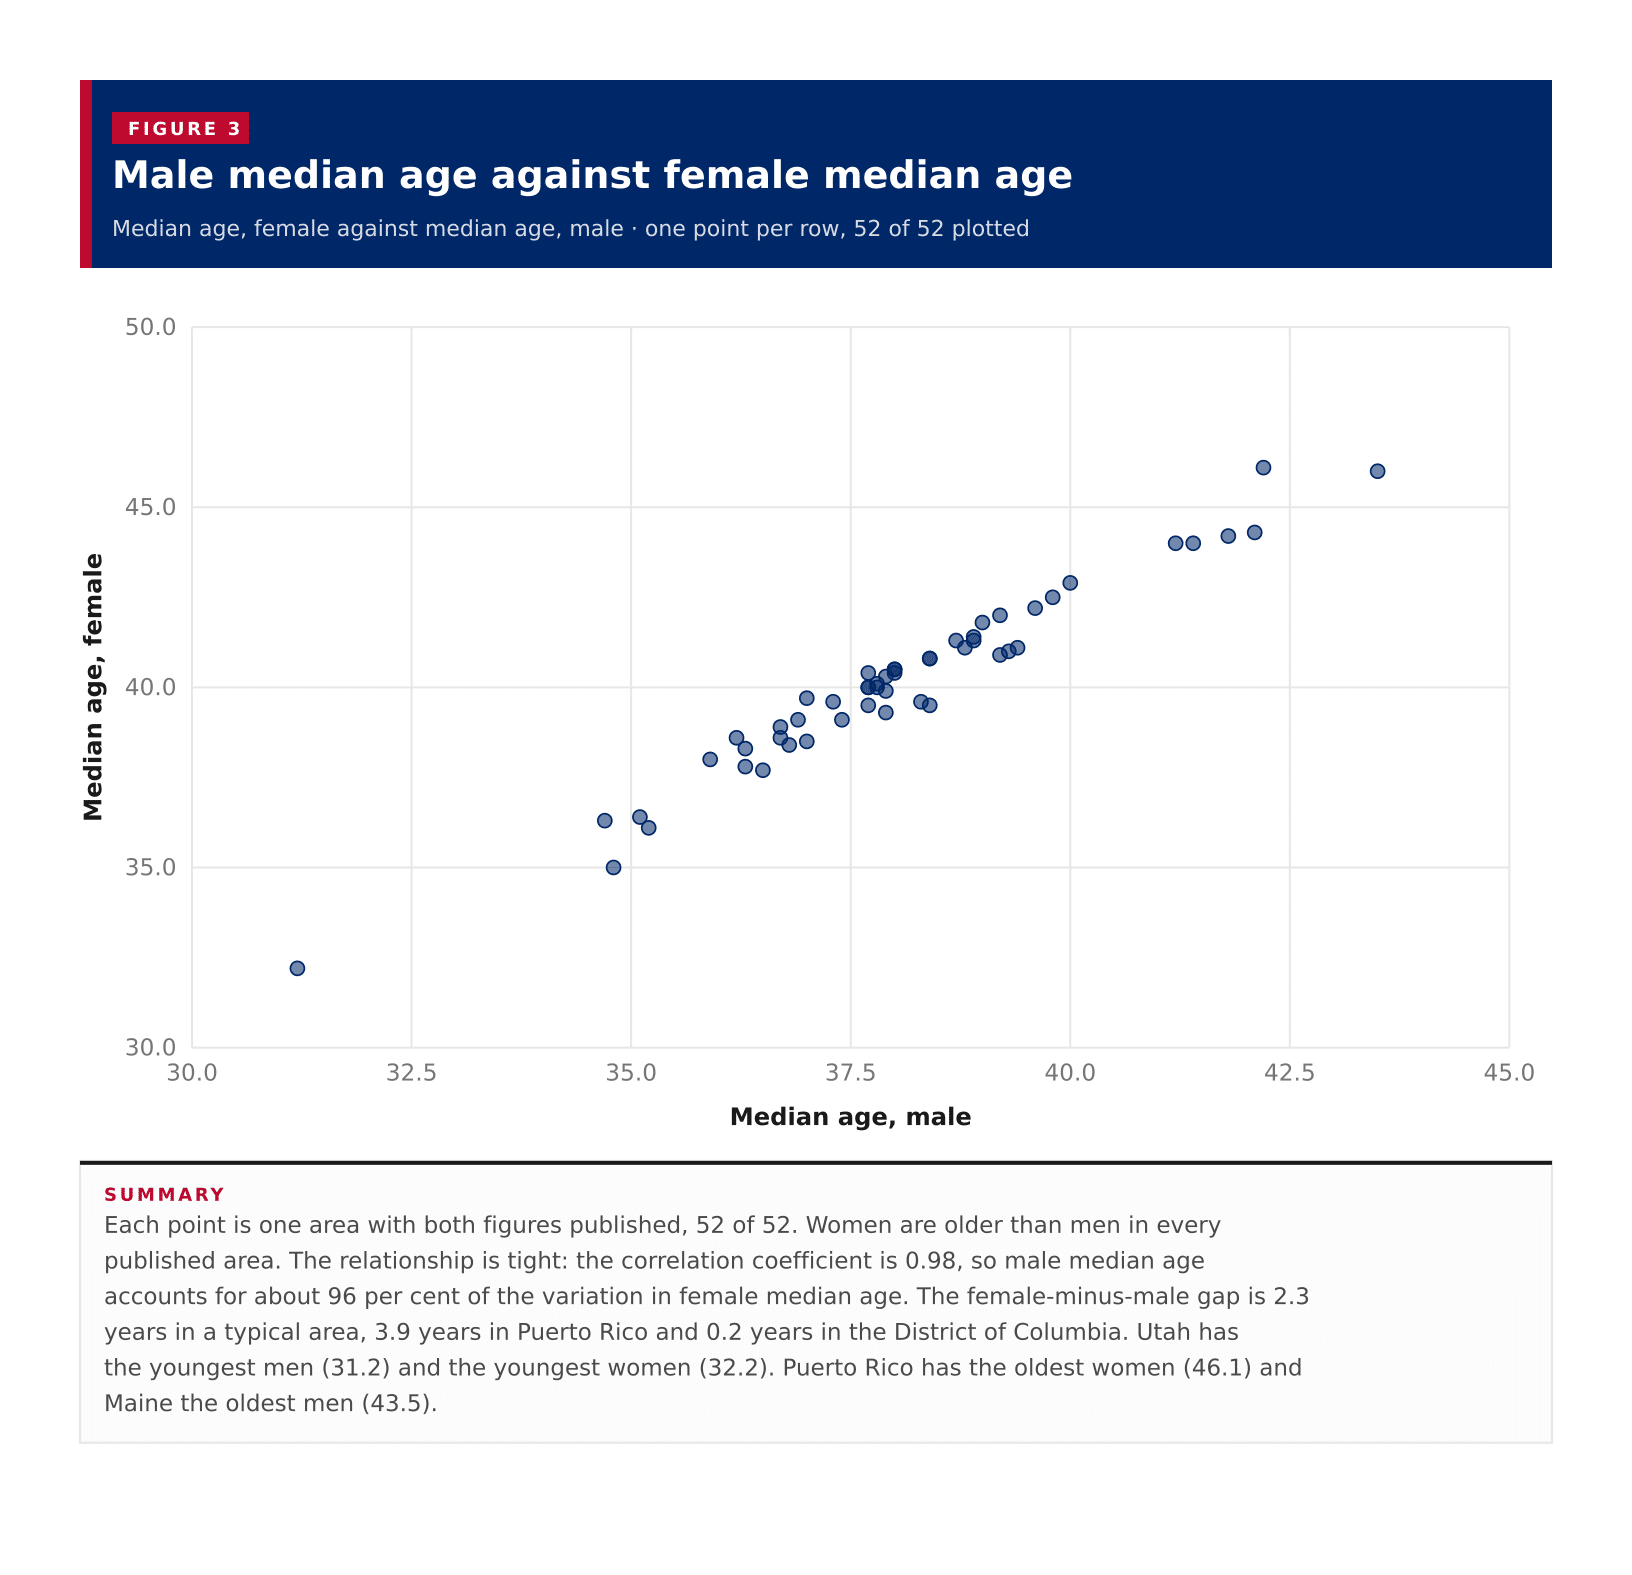
Median age, female against median age, male · one point per row, 52 of 52 plotted
Each point is one area with both figures published, 52 of 52. Women are older than men in every published area. The relationship is tight: the correlation coefficient is 0.98, so male median age accounts for about 96 per cent of the variation in female median age. The female-minus-male gap is 2.3 years in a typical area, 3.9 years in Puerto Rico and 0.2 years in the District of Columbia. Utah has the youngest men (31.2) and the youngest women (32.2). Puerto Rico has the oldest women (46.1) and Maine the oldest men (43.5).
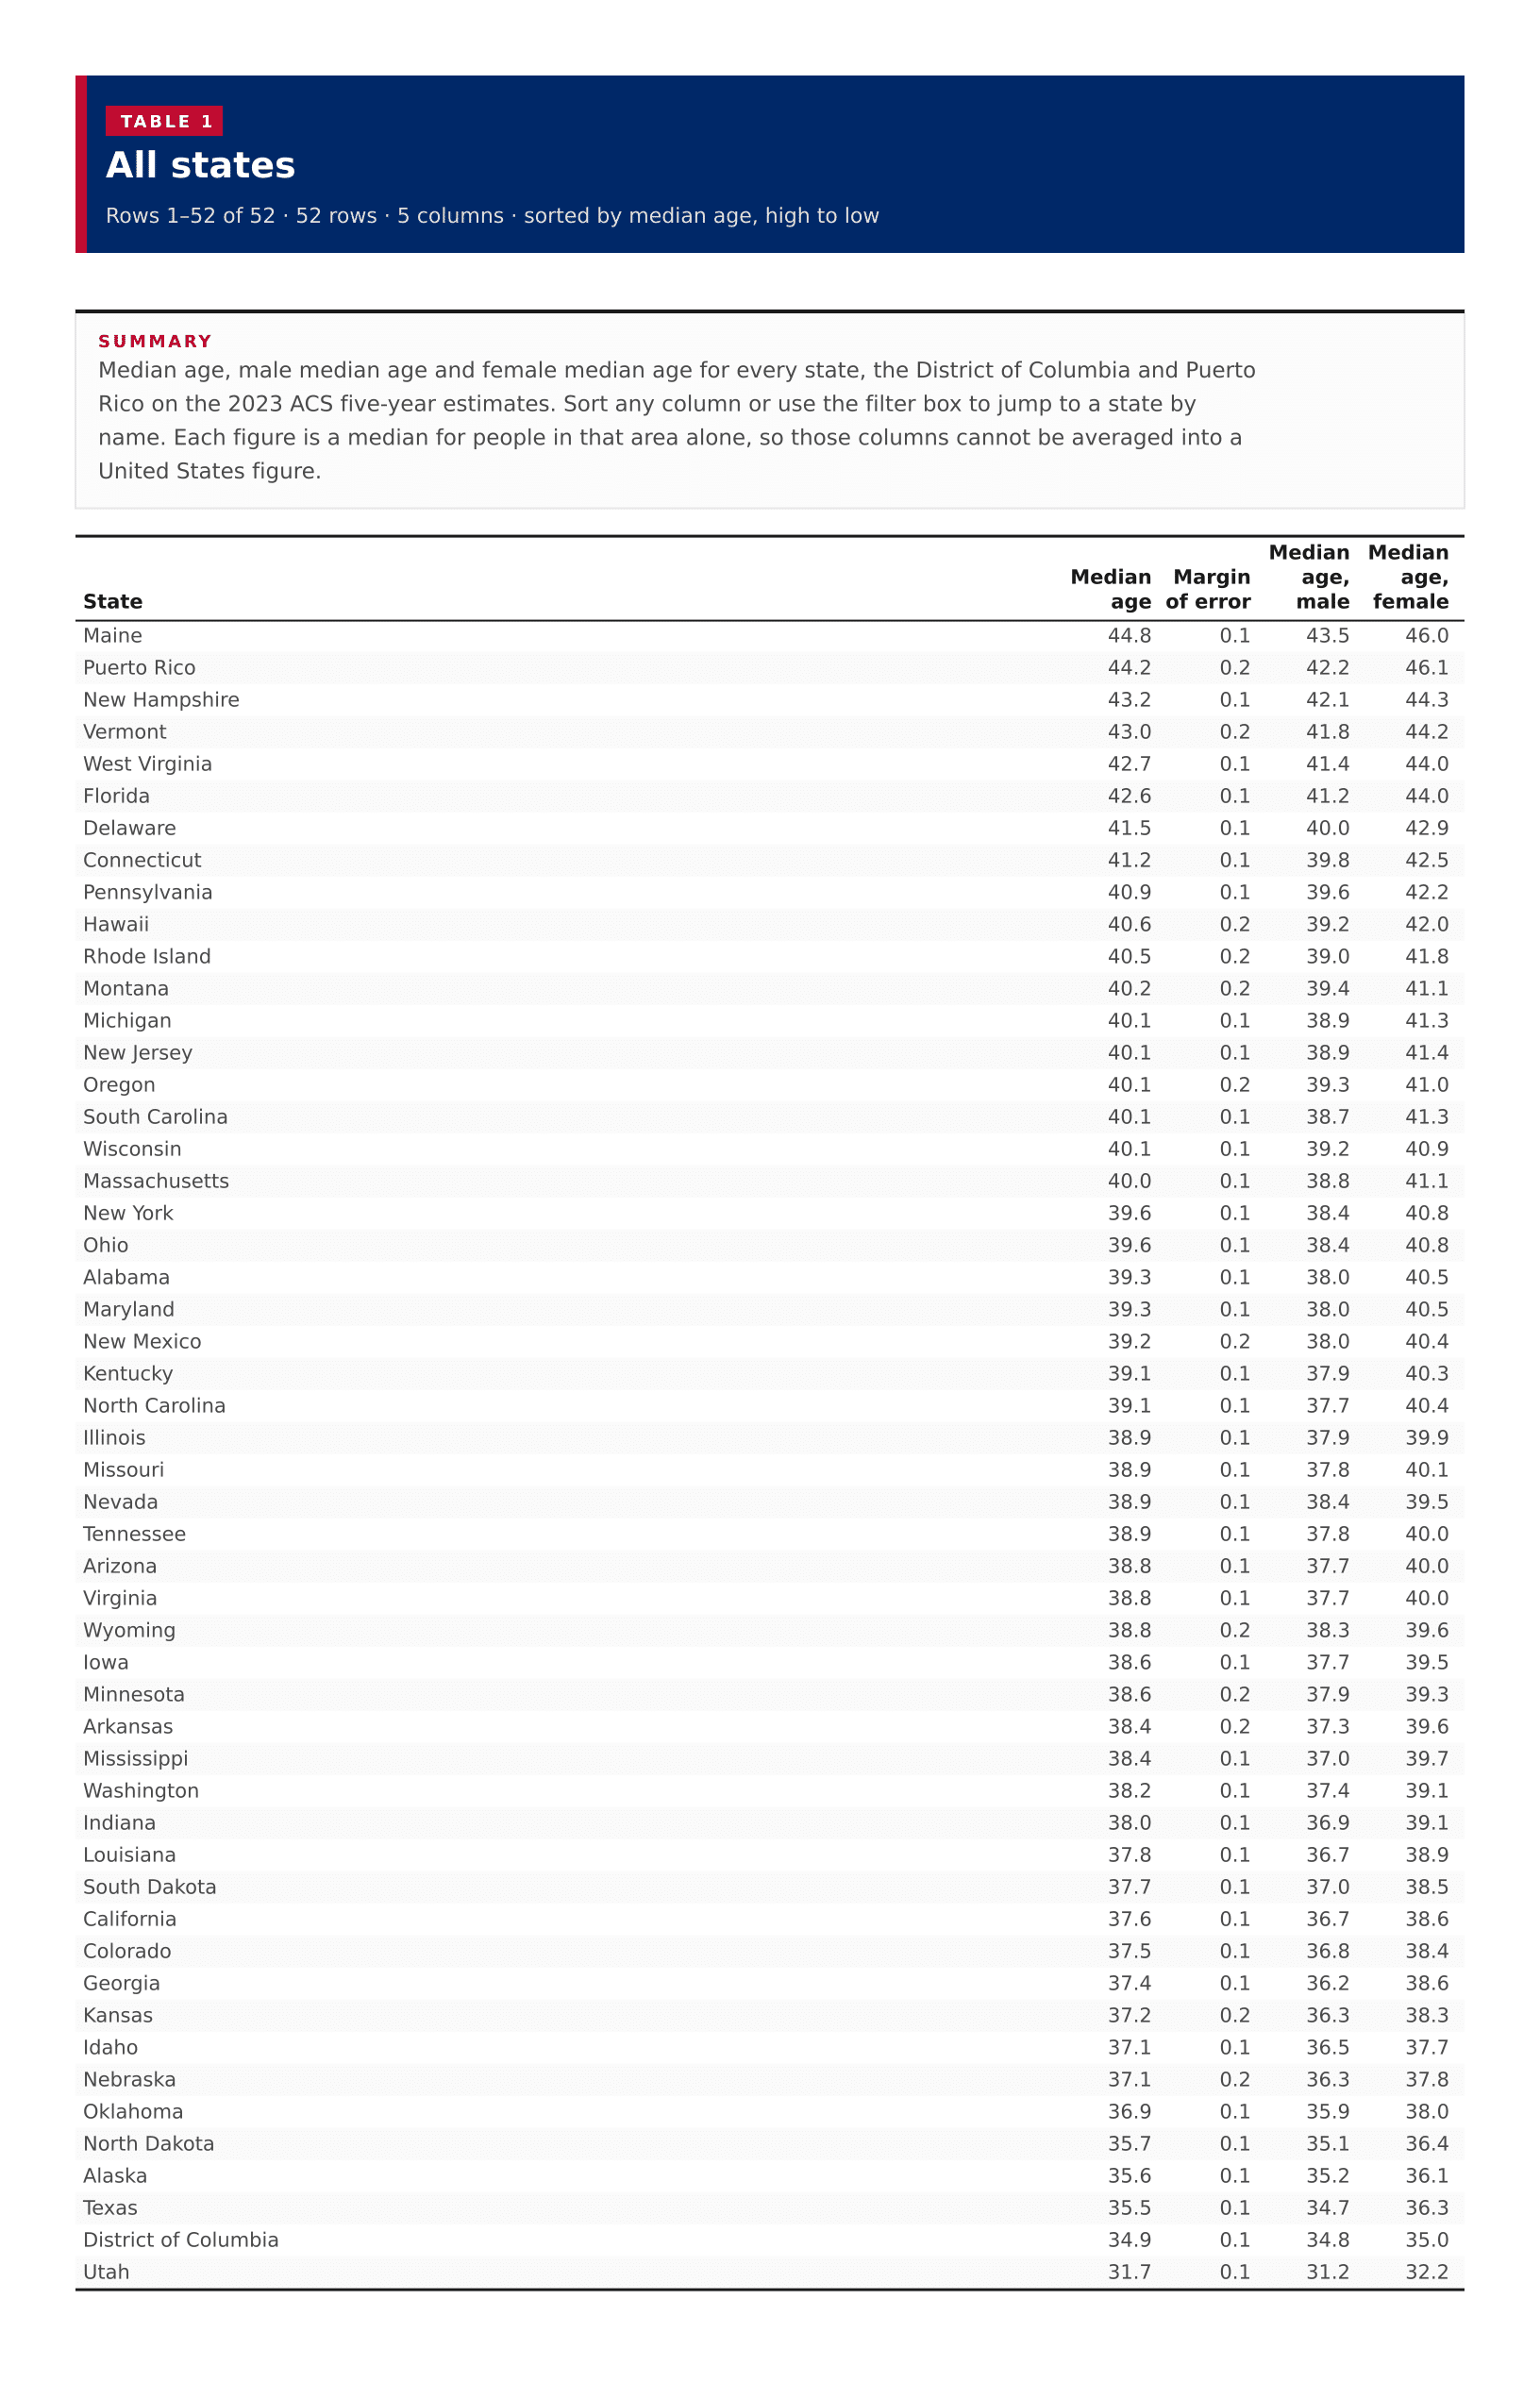
52 rows · 5 columns · sorted by median age, high to low
Median age, male median age and female median age for every state, the District of Columbia and Puerto Rico on the 2023 ACS five-year estimates. Sort any column or use the filter box to jump to a state by name. Each figure is a median for people in that area alone, so those columns cannot be averaged into a United States figure.
| ? | ? | ? | ? | |
|---|---|---|---|---|
| Maine | 44.8 | 0.1 | 43.5 | 46.0 |
| Puerto Rico | 44.2 | 0.2 | 42.2 | 46.1 |
| New Hampshire | 43.2 | 0.1 | 42.1 | 44.3 |
| Vermont | 43.0 | 0.2 | 41.8 | 44.2 |
| West Virginia | 42.7 | 0.1 | 41.4 | 44.0 |
| Florida | 42.6 | 0.1 | 41.2 | 44.0 |
| Delaware | 41.5 | 0.1 | 40.0 | 42.9 |
| Connecticut | 41.2 | 0.1 | 39.8 | 42.5 |
| Pennsylvania | 40.9 | 0.1 | 39.6 | 42.2 |
| Hawaii | 40.6 | 0.2 | 39.2 | 42.0 |
| Rhode Island | 40.5 | 0.2 | 39.0 | 41.8 |
| Montana | 40.2 | 0.2 | 39.4 | 41.1 |
| Michigan | 40.1 | 0.1 | 38.9 | 41.3 |
| New Jersey | 40.1 | 0.1 | 38.9 | 41.4 |
| Oregon | 40.1 | 0.2 | 39.3 | 41.0 |
| South Carolina | 40.1 | 0.1 | 38.7 | 41.3 |
| Wisconsin | 40.1 | 0.1 | 39.2 | 40.9 |
| Massachusetts | 40.0 | 0.1 | 38.8 | 41.1 |
| New York | 39.6 | 0.1 | 38.4 | 40.8 |
| Ohio | 39.6 | 0.1 | 38.4 | 40.8 |
| Alabama | 39.3 | 0.1 | 38.0 | 40.5 |
| Maryland | 39.3 | 0.1 | 38.0 | 40.5 |
| New Mexico | 39.2 | 0.2 | 38.0 | 40.4 |
| Kentucky | 39.1 | 0.1 | 37.9 | 40.3 |
| North Carolina | 39.1 | 0.1 | 37.7 | 40.4 |
| Illinois | 38.9 | 0.1 | 37.9 | 39.9 |
| Missouri | 38.9 | 0.1 | 37.8 | 40.1 |
| Nevada | 38.9 | 0.1 | 38.4 | 39.5 |
| Tennessee | 38.9 | 0.1 | 37.8 | 40.0 |
| Arizona | 38.8 | 0.1 | 37.7 | 40.0 |
| Virginia | 38.8 | 0.1 | 37.7 | 40.0 |
| Wyoming | 38.8 | 0.2 | 38.3 | 39.6 |
| Iowa | 38.6 | 0.1 | 37.7 | 39.5 |
| Minnesota | 38.6 | 0.2 | 37.9 | 39.3 |
| Arkansas | 38.4 | 0.2 | 37.3 | 39.6 |
| Mississippi | 38.4 | 0.1 | 37.0 | 39.7 |
| Washington | 38.2 | 0.1 | 37.4 | 39.1 |
| Indiana | 38.0 | 0.1 | 36.9 | 39.1 |
| Louisiana | 37.8 | 0.1 | 36.7 | 38.9 |
| South Dakota | 37.7 | 0.1 | 37.0 | 38.5 |
| California | 37.6 | 0.1 | 36.7 | 38.6 |
| Colorado | 37.5 | 0.1 | 36.8 | 38.4 |
| Georgia | 37.4 | 0.1 | 36.2 | 38.6 |
| Kansas | 37.2 | 0.2 | 36.3 | 38.3 |
| Idaho | 37.1 | 0.1 | 36.5 | 37.7 |
| Nebraska | 37.1 | 0.2 | 36.3 | 37.8 |
| Oklahoma | 36.9 | 0.1 | 35.9 | 38.0 |
| North Dakota | 35.7 | 0.1 | 35.1 | 36.4 |
| Alaska | 35.6 | 0.1 | 35.2 | 36.1 |
| Texas | 35.5 | 0.1 | 34.7 | 36.3 |
| District of Columbia | 34.9 | 0.1 | 34.8 | 35.0 |
| Utah | 31.7 | 0.1 | 31.2 | 32.2 |