Figure 1
Currently married share, US states
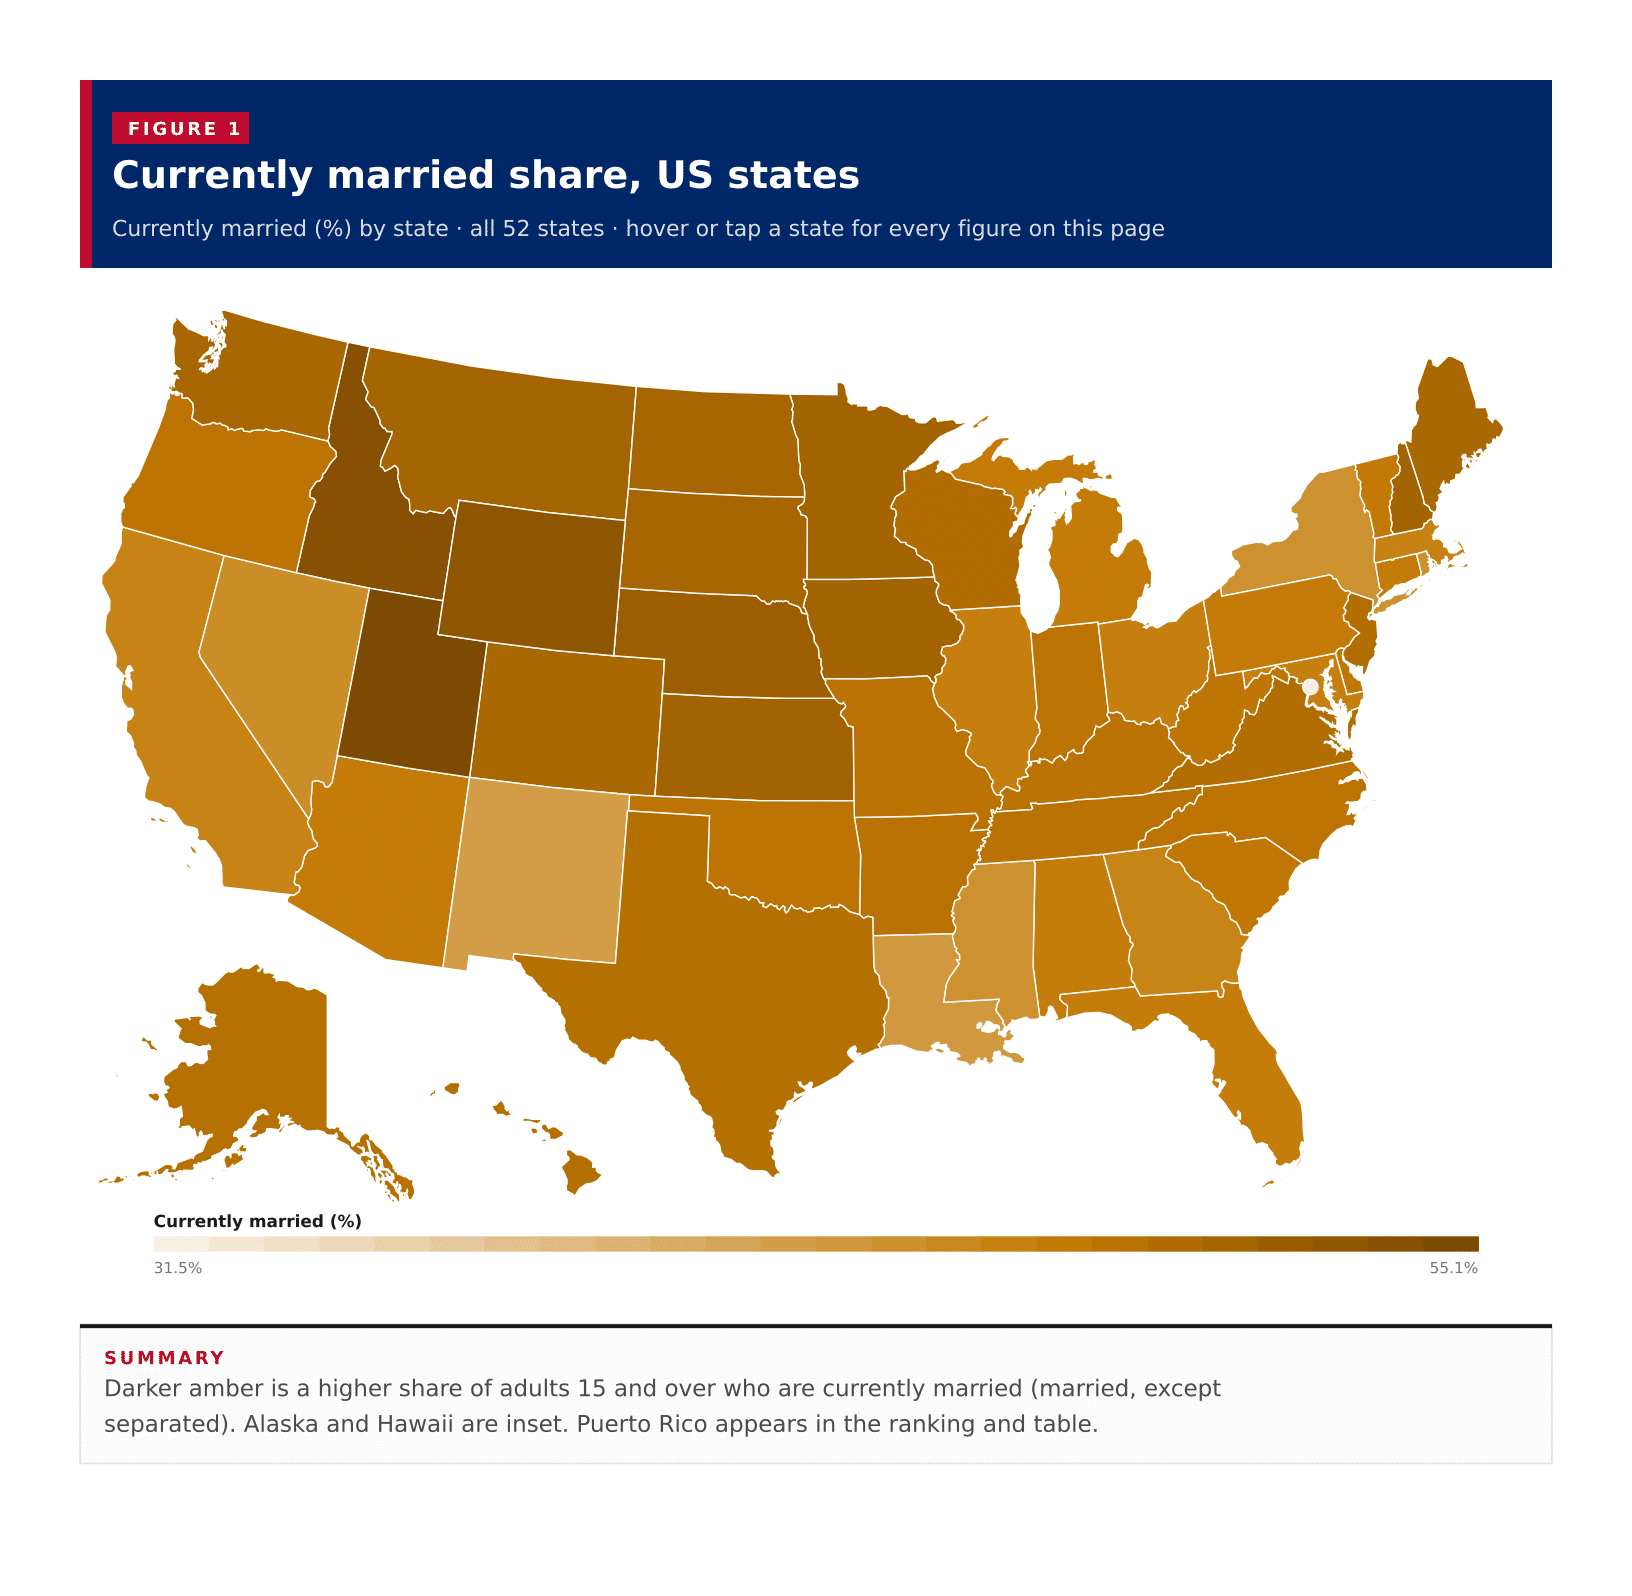
Currently married (%) by state · all 52 states · hover or tap a state for every figure on this page
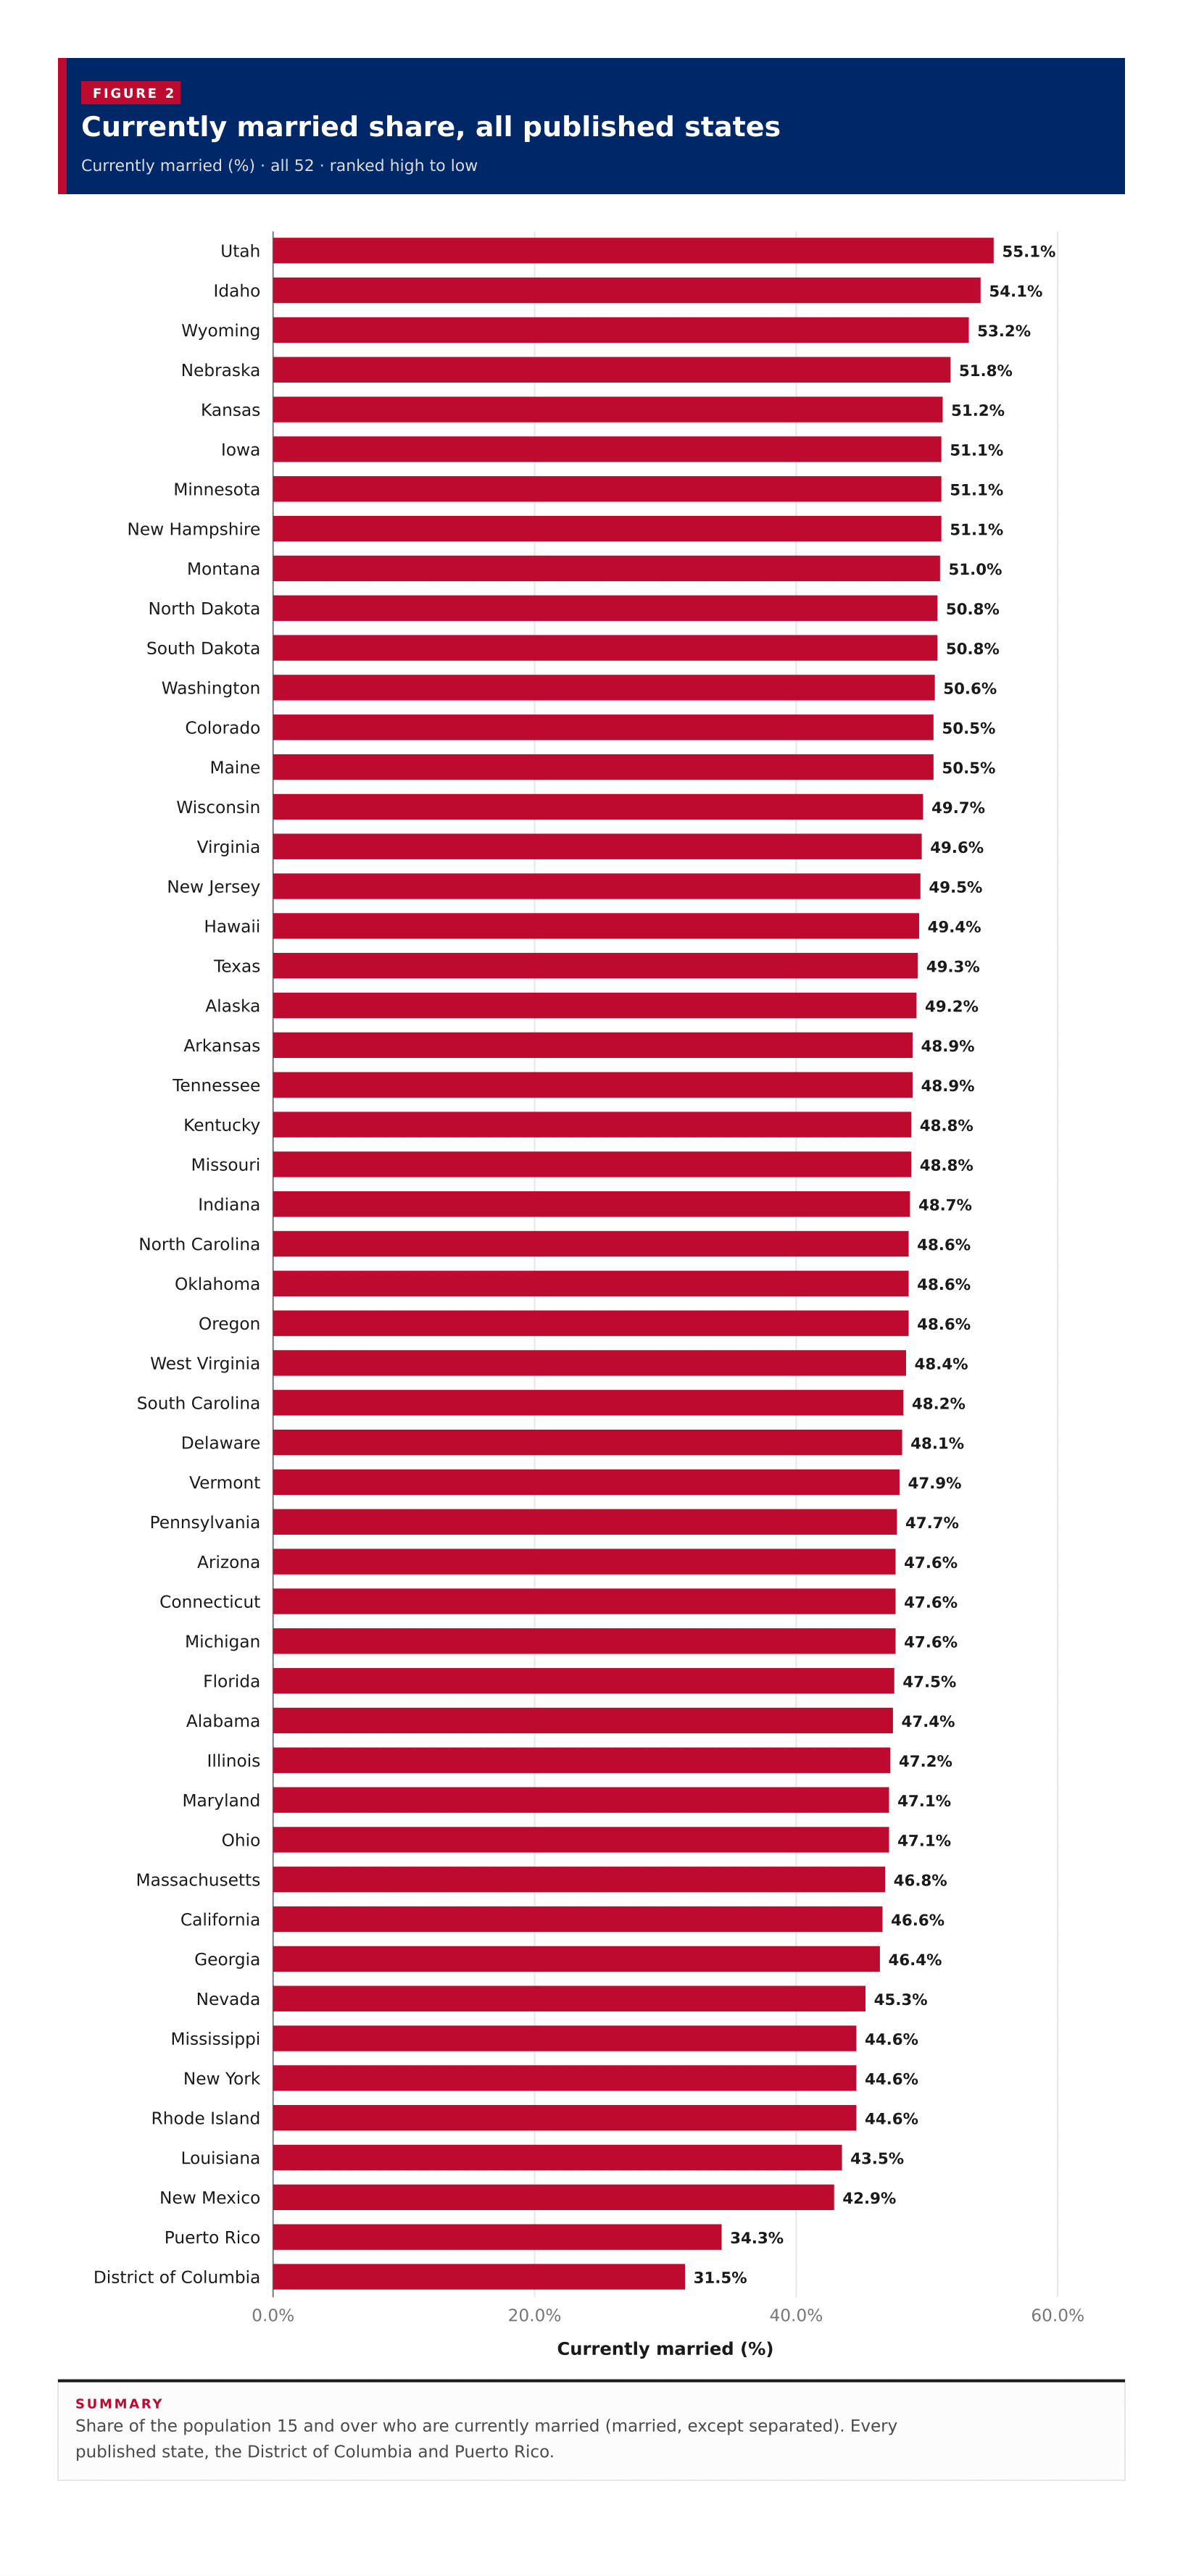
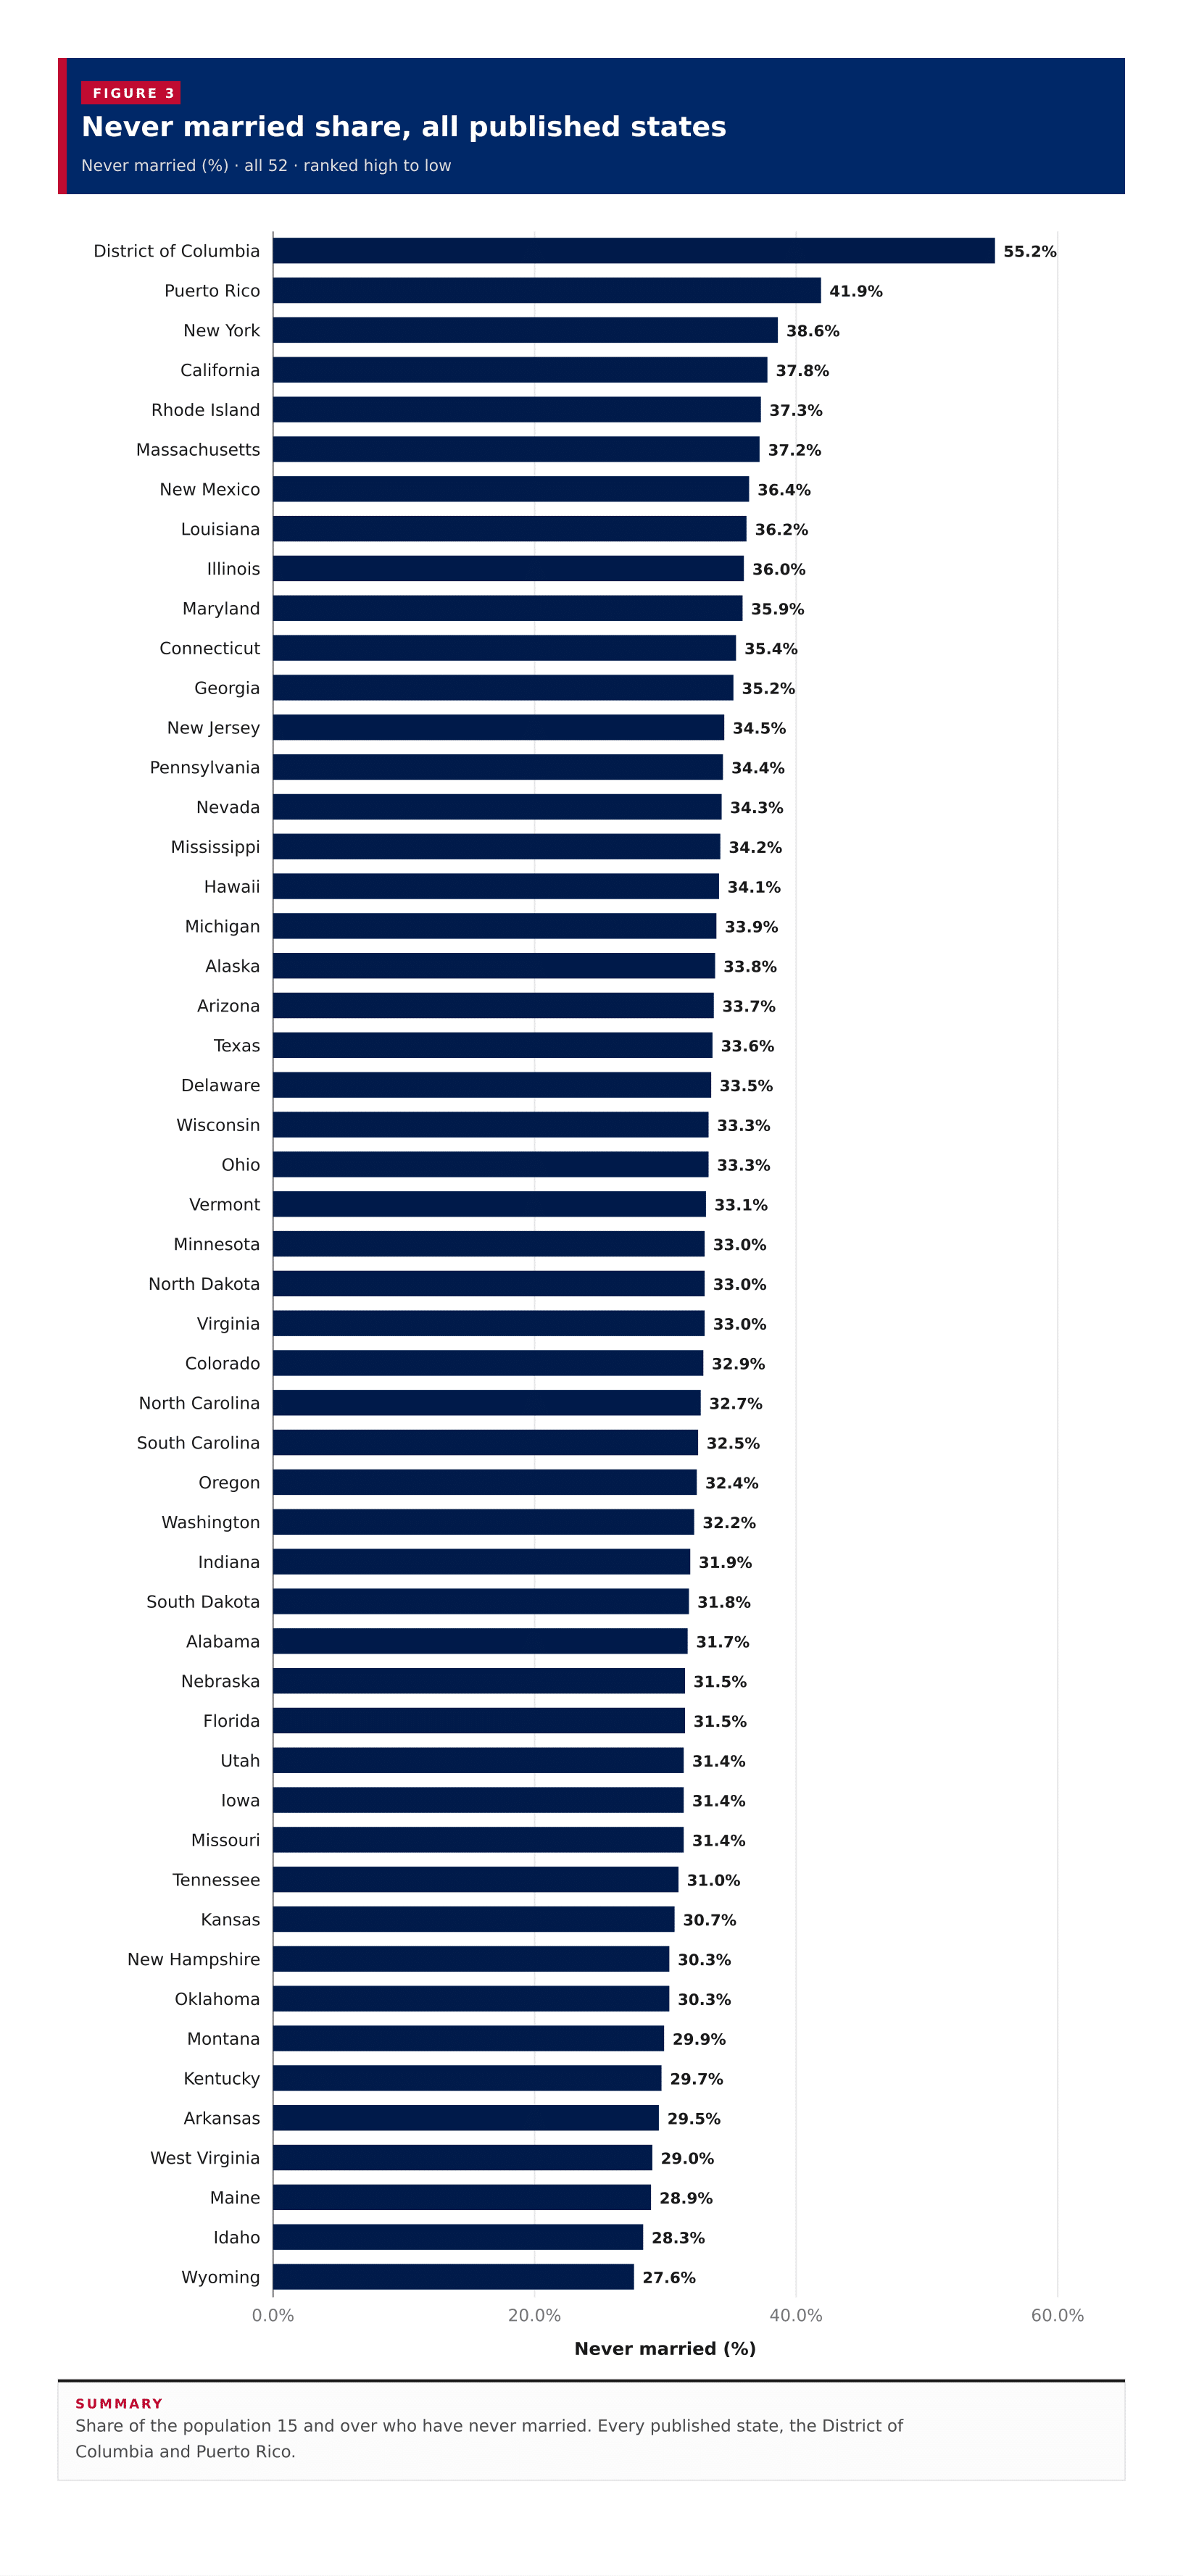
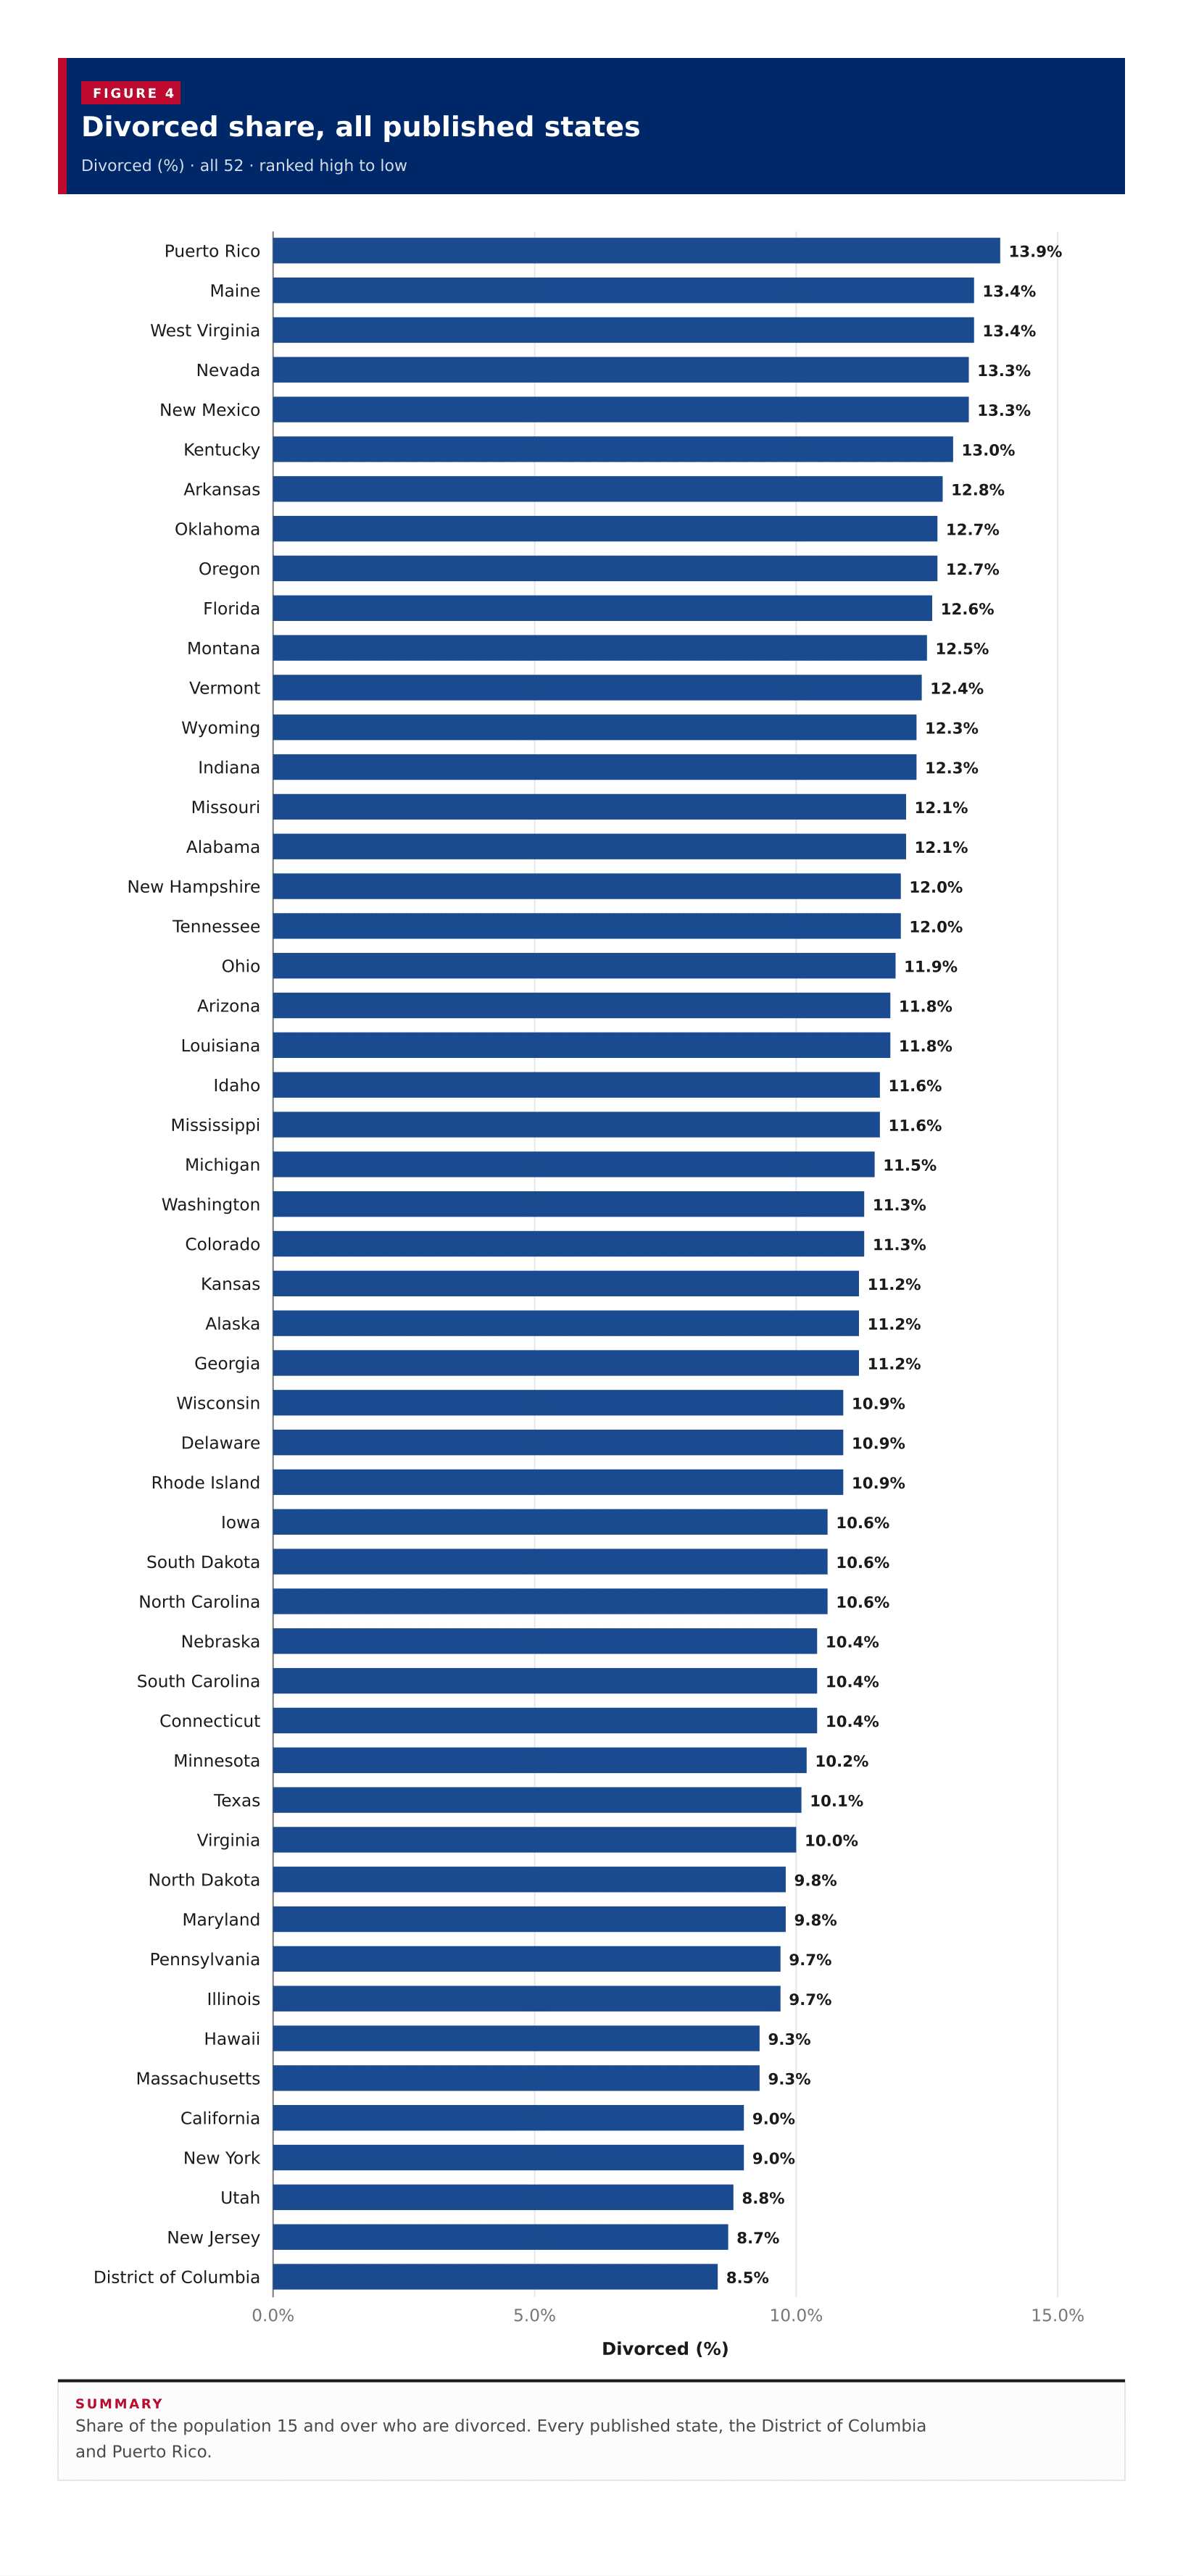
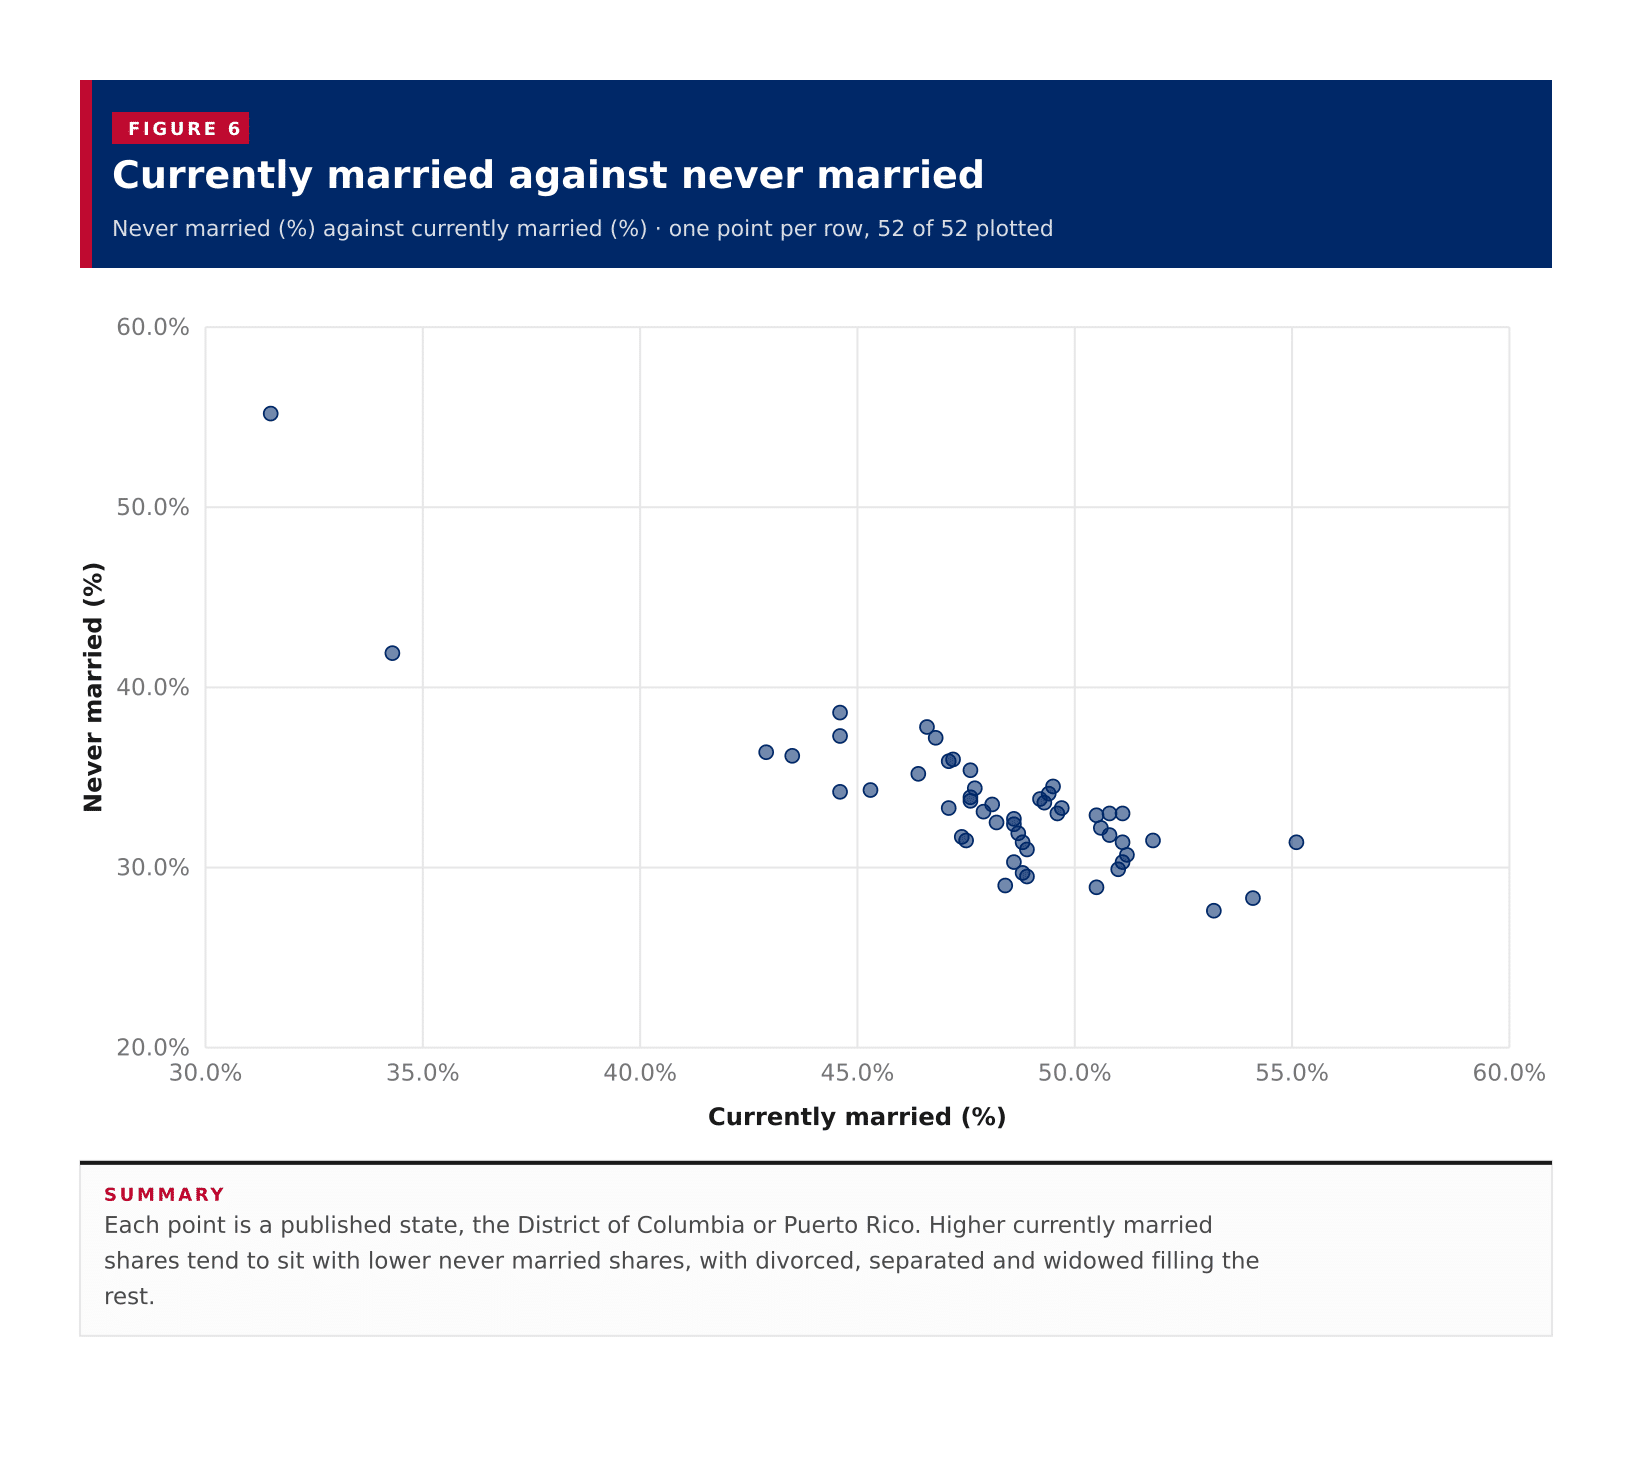
A typical published area has 48.6% of adults 15 and over currently married (married, except separated), the midpoint of the 50 states, the District of Columbia and Puerto Rico on the 2023 ACS five-year estimates. Utah leads at 55.1%. The District of Columbia has the lowest currently married share at 31.5% and the highest never married share at 55.2%. Puerto Rico leads divorced at 13.9%. These are area shares of the population 15 and over, not a United States marital-status rate.
Currently married (%) · all 52 · ranked high to low
Never married (%) · all 52 · ranked high to low
Divorced (%) · all 52 · ranked high to low
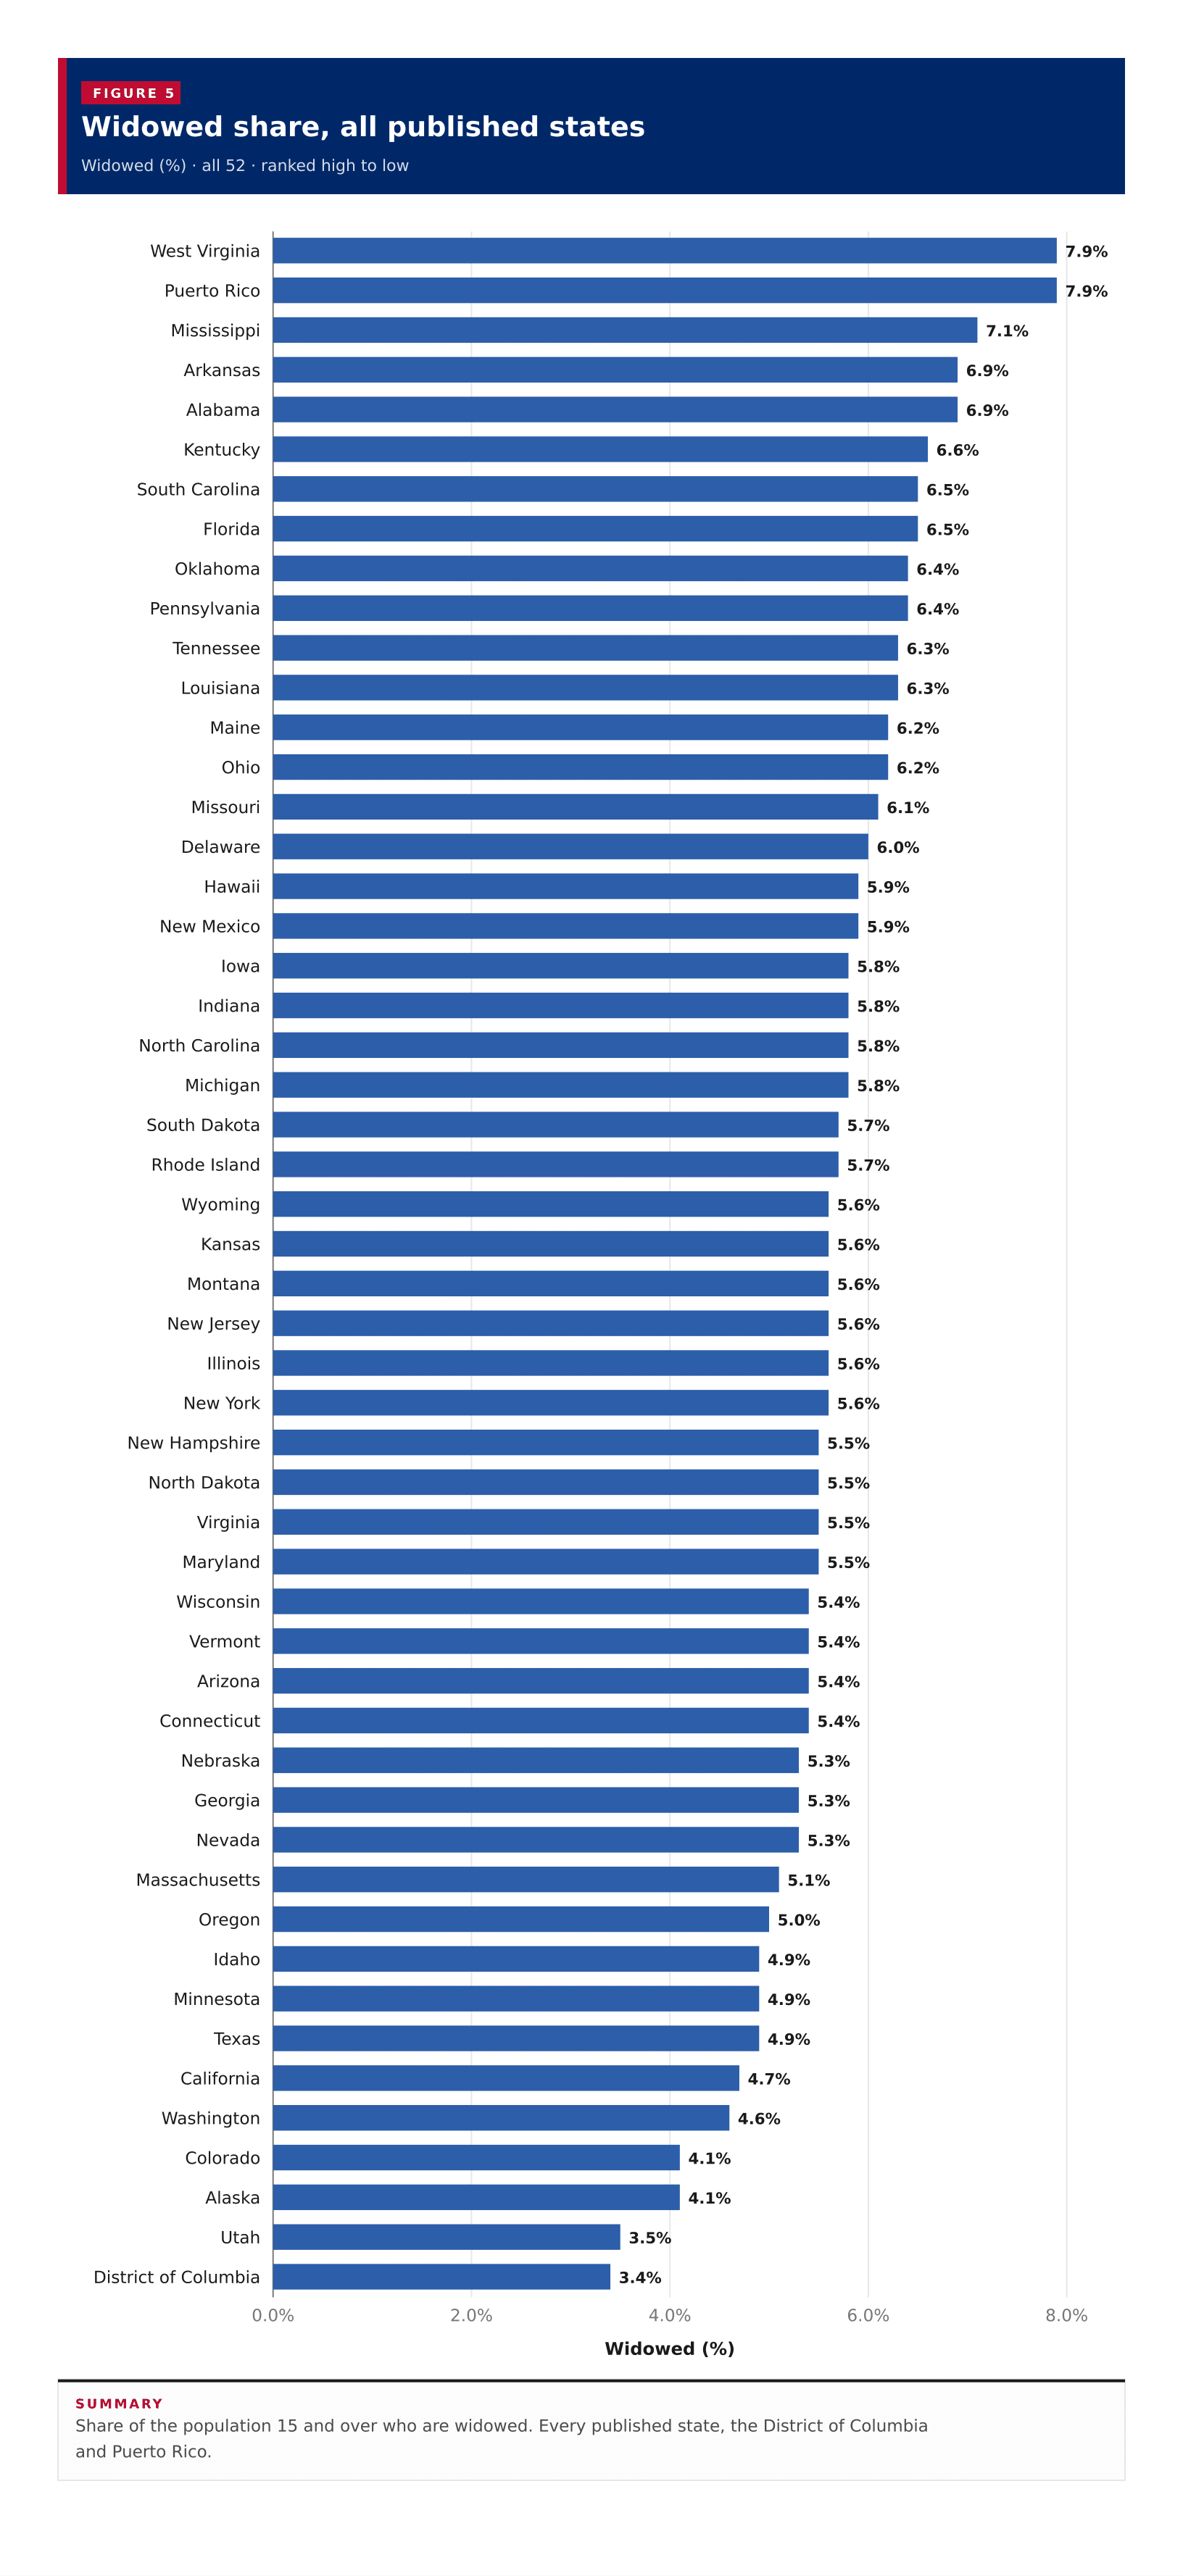
Widowed (%) · all 52 · ranked high to low
Never married (%) against currently married (%) · one point per row, 52 of 52 plotted
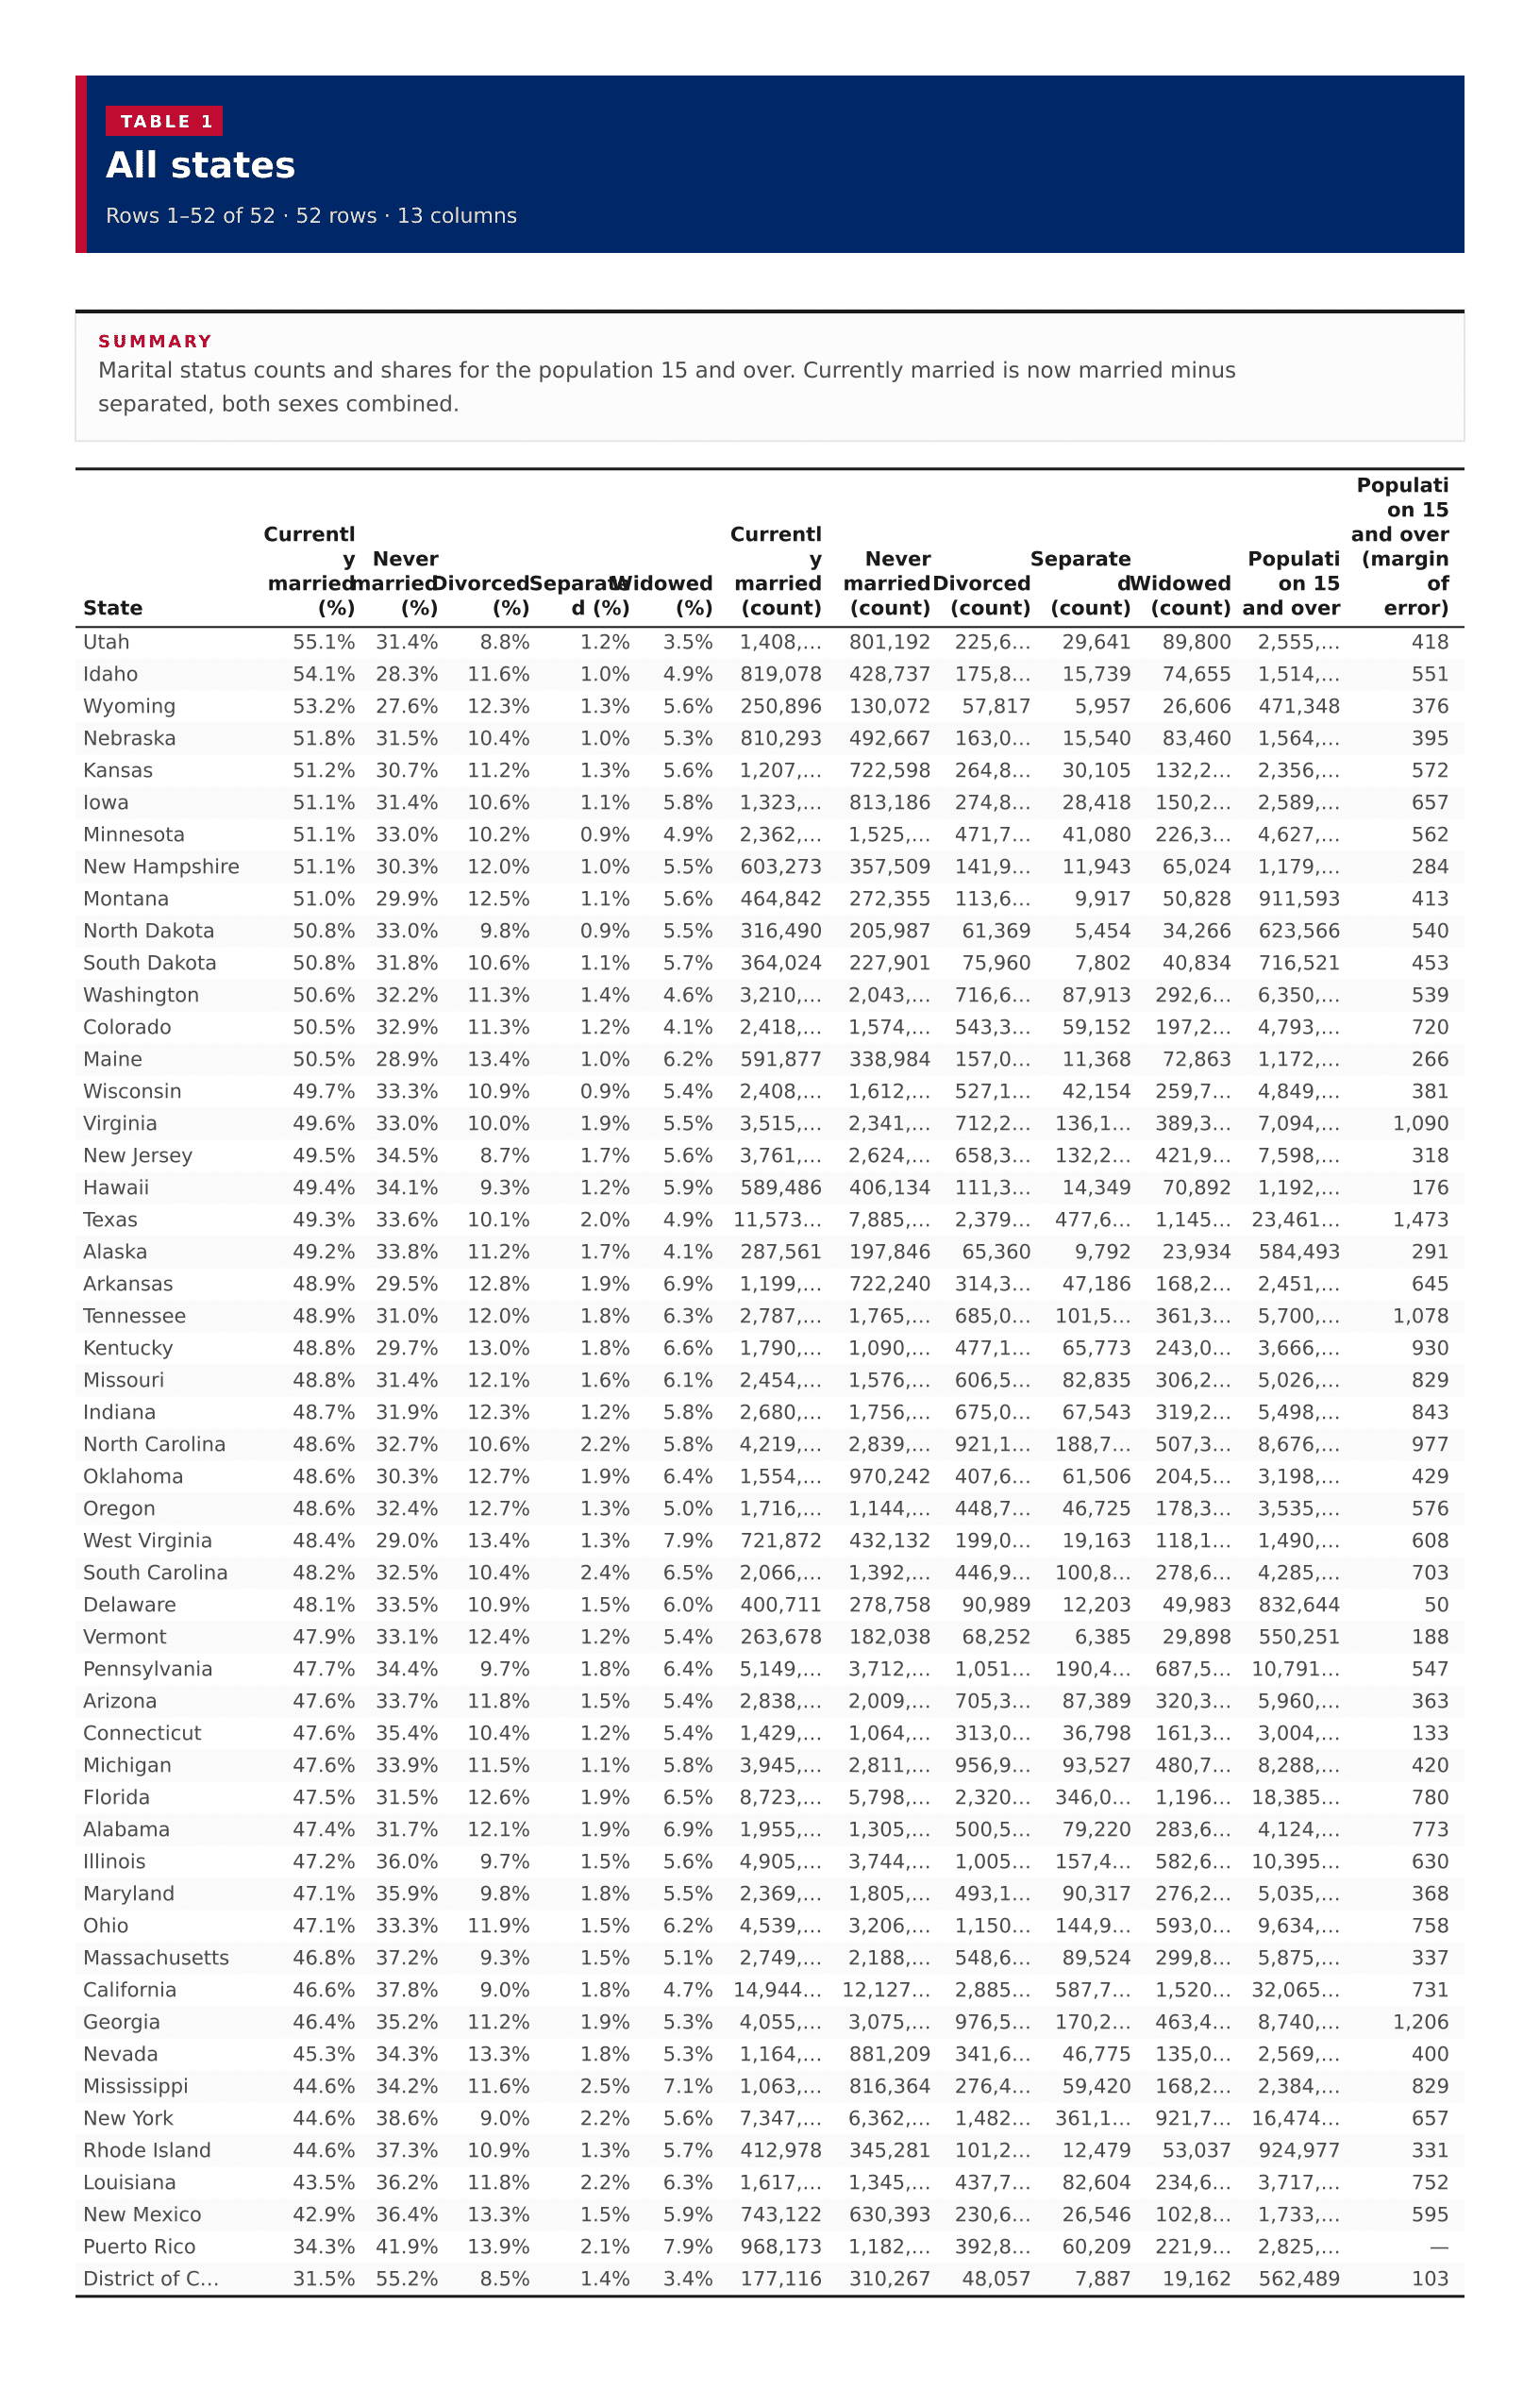
52 rows · 13 columns
Marital status counts and shares for the population 15 and over. Currently married is now married minus separated, both sexes combined.
| Utah | 55.1% | 31.4% | 8.8% | 1.2% | 3.5% | 1,408,917 | 801,192 | 225,688 | 29,641 | 89,800 | 2,555,238 | 418 |
|---|---|---|---|---|---|---|---|---|---|---|---|---|
| Idaho | 54.1% | 28.3% | 11.6% | 1.0% | 4.9% | 819,078 | 428,737 | 175,894 | 15,739 | 74,655 | 1,514,103 | 551 |
| Wyoming | 53.2% | 27.6% | 12.3% | 1.3% | 5.6% | 250,896 | 130,072 | 57,817 | 5,957 | 26,606 | 471,348 | 376 |
| Nebraska | 51.8% | 31.5% | 10.4% | 1.0% | 5.3% | 810,293 | 492,667 | 163,006 | 15,540 | 83,460 | 1,564,966 | 395 |
| Kansas | 51.2% | 30.7% | 11.2% | 1.3% | 5.6% | 1,207,103 | 722,598 | 264,895 | 30,105 | 132,226 | 2,356,927 | 572 |
| Iowa | 51.1% | 31.4% | 10.6% | 1.1% | 5.8% | 1,323,226 | 813,186 | 274,883 | 28,418 | 150,205 | 2,589,918 | 657 |
| Minnesota | 51.1% | 33.0% | 10.2% | 0.9% | 4.9% | 2,362,522 | 1,525,780 | 471,744 | 41,080 | 226,316 | 4,627,442 | 562 |
| New Hampshire | 51.1% | 30.3% | 12.0% | 1.0% | 5.5% | 603,273 | 357,509 | 141,901 | 11,943 | 65,024 | 1,179,650 | 284 |
| Montana | 51.0% | 29.9% | 12.5% | 1.1% | 5.6% | 464,842 | 272,355 | 113,651 | 9,917 | 50,828 | 911,593 | 413 |
| North Dakota | 50.8% | 33.0% | 9.8% | 0.9% | 5.5% | 316,490 | 205,987 | 61,369 | 5,454 | 34,266 | 623,566 | 540 |
| South Dakota | 50.8% | 31.8% | 10.6% | 1.1% | 5.7% | 364,024 | 227,901 | 75,960 | 7,802 | 40,834 | 716,521 | 453 |
| Washington | 50.6% | 32.2% | 11.3% | 1.4% | 4.6% | 3,210,548 | 2,043,223 | 716,603 | 87,913 | 292,644 | 6,350,931 | 539 |
| Colorado | 50.5% | 32.9% | 11.3% | 1.2% | 4.1% | 2,418,540 | 1,574,961 | 543,318 | 59,152 | 197,230 | 4,793,201 | 720 |
| Maine | 50.5% | 28.9% | 13.4% | 1.0% | 6.2% | 591,877 | 338,984 | 157,068 | 11,368 | 72,863 | 1,172,160 | 266 |
| Wisconsin | 49.7% | 33.3% | 10.9% | 0.9% | 5.4% | 2,408,090 | 1,612,618 | 527,107 | 42,154 | 259,708 | 4,849,677 | 381 |
| Virginia | 49.6% | 33.0% | 10.0% | 1.9% | 5.5% | 3,515,254 | 2,341,279 | 712,219 | 136,120 | 389,390 | 7,094,262 | 1,090 |
| New Jersey | 49.5% | 34.5% | 8.7% | 1.7% | 5.6% | 3,761,628 | 2,624,789 | 658,374 | 132,218 | 421,904 | 7,598,913 | 318 |
| Hawaii | 49.4% | 34.1% | 9.3% | 1.2% | 5.9% | 589,486 | 406,134 | 111,371 | 14,349 | 70,892 | 1,192,232 | 176 |
| Texas | 49.3% | 33.6% | 10.1% | 2.0% | 4.9% | 11,573,030 | 7,885,415 | 2,379,591 | 477,624 | 1,145,391 | 23,461,051 | 1,473 |
| Alaska | 49.2% | 33.8% | 11.2% | 1.7% | 4.1% | 287,561 | 197,846 | 65,360 | 9,792 | 23,934 | 584,493 | 291 |
| Arkansas | 48.9% | 29.5% | 12.8% | 1.9% | 6.9% | 1,199,249 | 722,240 | 314,377 | 47,186 | 168,274 | 2,451,326 | 645 |
| Tennessee | 48.9% | 31.0% | 12.0% | 1.8% | 6.3% | 2,787,798 | 1,765,150 | 685,048 | 101,573 | 361,378 | 5,700,947 | 1,078 |
| Kentucky | 48.8% | 29.7% | 13.0% | 1.8% | 6.6% | 1,790,003 | 1,090,301 | 477,110 | 65,773 | 243,057 | 3,666,244 | 930 |
| Missouri | 48.8% | 31.4% | 12.1% | 1.6% | 6.1% | 2,454,643 | 1,576,299 | 606,598 | 82,835 | 306,226 | 5,026,601 | 829 |
| Indiana | 48.7% | 31.9% | 12.3% | 1.2% | 5.8% | 2,680,287 | 1,756,841 | 675,090 | 67,543 | 319,225 | 5,498,986 | 843 |
| North Carolina | 48.6% | 32.7% | 10.6% | 2.2% | 5.8% | 4,219,794 | 2,839,135 | 921,124 | 188,795 | 507,348 | 8,676,196 | 977 |
| Oklahoma | 48.6% | 30.3% | 12.7% | 1.9% | 6.4% | 1,554,409 | 970,242 | 407,670 | 61,506 | 204,596 | 3,198,423 | 429 |
| Oregon | 48.6% | 32.4% | 12.7% | 1.3% | 5.0% | 1,716,858 | 1,144,939 | 448,798 | 46,725 | 178,303 | 3,535,623 | 576 |
| West Virginia | 48.4% | 29.0% | 13.4% | 1.3% | 7.9% | 721,872 | 432,132 | 199,096 | 19,163 | 118,128 | 1,490,391 | 608 |
| South Carolina | 48.2% | 32.5% | 10.4% | 2.4% | 6.5% | 2,066,528 | 1,392,263 | 446,985 | 100,880 | 278,631 | 4,285,287 | 703 |
| Delaware | 48.1% | 33.5% | 10.9% | 1.5% | 6.0% | 400,711 | 278,758 | 90,989 | 12,203 | 49,983 | 832,644 | 50 |
| Vermont | 47.9% | 33.1% | 12.4% | 1.2% | 5.4% | 263,678 | 182,038 | 68,252 | 6,385 | 29,898 | 550,251 | 188 |
| Pennsylvania | 47.7% | 34.4% | 9.7% | 1.8% | 6.4% | 5,149,929 | 3,712,174 | 1,051,592 | 190,434 | 687,531 | 10,791,660 | 547 |
| Arizona | 47.6% | 33.7% | 11.8% | 1.5% | 5.4% | 2,838,087 | 2,009,703 | 705,354 | 87,389 | 320,333 | 5,960,866 | 363 |
| Connecticut | 47.6% | 35.4% | 10.4% | 1.2% | 5.4% | 1,429,169 | 1,064,098 | 313,000 | 36,798 | 161,356 | 3,004,421 | 133 |
| Michigan | 47.6% | 33.9% | 11.5% | 1.1% | 5.8% | 3,945,383 | 2,811,576 | 956,904 | 93,527 | 480,722 | 8,288,112 | 420 |
| Florida | 47.5% | 31.5% | 12.6% | 1.9% | 6.5% | 8,723,882 | 5,798,970 | 2,320,247 | 346,057 | 1,196,009 | 18,385,165 | 780 |
| Alabama | 47.4% | 31.7% | 12.1% | 1.9% | 6.9% | 1,955,558 | 1,305,353 | 500,537 | 79,220 | 283,633 | 4,124,301 | 773 |
| Illinois | 47.2% | 36.0% | 9.7% | 1.5% | 5.6% | 4,905,579 | 3,744,152 | 1,005,219 | 157,491 | 582,624 | 10,395,065 | 630 |
| Maryland | 47.1% | 35.9% | 9.8% | 1.8% | 5.5% | 2,369,627 | 1,805,669 | 493,121 | 90,317 | 276,274 | 5,035,008 | 368 |
| Ohio | 47.1% | 33.3% | 11.9% | 1.5% | 6.2% | 4,539,891 | 3,206,063 | 1,150,190 | 144,944 | 593,027 | 9,634,115 | 758 |
| Massachusetts | 46.8% | 37.2% | 9.3% | 1.5% | 5.1% | 2,749,559 | 2,188,218 | 548,667 | 89,524 | 299,834 | 5,875,802 | 337 |
| California | 46.6% | 37.8% | 9.0% | 1.8% | 4.7% | 14,944,452 | 12,127,036 | 2,885,289 | 587,742 | 1,520,904 | 32,065,423 | 731 |
| Georgia | 46.4% | 35.2% | 11.2% | 1.9% | 5.3% | 4,055,137 | 3,075,391 | 976,593 | 170,288 | 463,481 | 8,740,890 | 1,206 |
| Nevada | 45.3% | 34.3% | 13.3% | 1.8% | 5.3% | 1,164,820 | 881,209 | 341,646 | 46,775 | 135,006 | 2,569,456 | 400 |
| Mississippi | 44.6% | 34.2% | 11.6% | 2.5% | 7.1% | 1,063,778 | 816,364 | 276,414 | 59,420 | 168,260 | 2,384,236 | 829 |
| New York | 44.6% | 38.6% | 9.0% | 2.2% | 5.6% | 7,347,615 | 6,362,007 | 1,482,240 | 361,127 | 921,726 | 16,474,715 | 657 |
| Rhode Island | 44.6% | 37.3% | 10.9% | 1.3% | 5.7% | 412,978 | 345,281 | 101,202 | 12,479 | 53,037 | 924,977 | 331 |
| Louisiana | 43.5% | 36.2% | 11.8% | 2.2% | 6.3% | 1,617,240 | 1,345,733 | 437,742 | 82,604 | 234,638 | 3,717,957 | 752 |
| New Mexico | 42.9% | 36.4% | 13.3% | 1.5% | 5.9% | 743,122 | 630,393 | 230,652 | 26,546 | 102,873 | 1,733,586 | 595 |
| Puerto Rico | 34.3% | 41.9% | 13.9% | 2.1% | 7.9% | 968,173 | 1,182,754 | 392,800 | 60,209 | 221,909 | 2,825,845 | , |
| District of Columbia | 31.5% | 55.2% | 8.5% | 1.4% | 3.4% | 177,116 | 310,267 | 48,057 | 7,887 | 19,162 | 562,489 | 103 |