Languages spoken by US state

Summary

Language other than English, US states

Language other than English by state · all 52 states · hover or tap a state for every figure on this page

52 items
View100%
DownloadPDFImageCSV
StatesCalifornia
Language other than English, US statesDarker amber is a higher share of people age 5 and over who speak a language other than English at home. Puerto Rico is listed in the ranking and table but is not on this map.Alabama · Population 5 years and over: 4,759,836 · Language other than English: 5.9% · Speak only English: 94.1% · Spanish: 3.9% · Other non-English languages: 2.0% · Spanish (count): 183,774 · French, Haitian or Cajun: 5,929 · German or other West Germanic: 10,361 · Russian, Polish or other Slavic: 4,100 · Other Indo-European: 18,806 · Korean: 10,848 · Chinese (incl. Mandarin, Cantonese): 10,931 · Vietnamese: 7,759 · Tagalog (incl. Filipino): 4,393 · Other Asian and Pacific Island: 9,049 · Arabic: 5,934 · Other and unspecified languages: 7,635Alaska · Population 5 years and over: 686,146 · Language other than English: 15.6% · Speak only English: 84.4% · Spanish: 3.4% · Other non-English languages: 12.2% · Spanish (count): 23,665 · French, Haitian or Cajun: 2,436 · German or other West Germanic: 2,842 · Russian, Polish or other Slavic: 5,510 · Other Indo-European: 3,222 · Korean: 3,796 · Chinese (incl. Mandarin, Cantonese): 1,773 · Vietnamese: 829 · Tagalog (incl. Filipino): 18,754 · Other Asian and Pacific Island: 15,358 · Arabic: 1,804 · Other and unspecified languages: 27,195Arizona · Population 5 years and over: 6,868,676 · Language other than English: 25.7% · Speak only English: 74.3% · Spanish: 19.2% · Other non-English languages: 6.4% · Spanish (count): 1,322,111 · French, Haitian or Cajun: 19,504 · German or other West Germanic: 19,774 · Russian, Polish or other Slavic: 26,690 · Other Indo-European: 72,556 · Korean: 11,925 · Chinese (incl. Mandarin, Cantonese): 32,218 · Vietnamese: 22,623 · Tagalog (incl. Filipino): 26,922 · Other Asian and Pacific Island: 49,071 · Arabic: 23,374 · Other and unspecified languages: 137,425Arkansas · Population 5 years and over: 2,850,213 · Language other than English: 8.1% · Speak only English: 91.9% · Spanish: 6.0% · Other non-English languages: 2.1% · Spanish (count): 169,990 · French, Haitian or Cajun: 3,592 · German or other West Germanic: 5,799 · Russian, Polish or other Slavic: 2,072 · Other Indo-European: 10,314 · Korean: 1,999 · Chinese (incl. Mandarin, Cantonese): 4,312 · Vietnamese: 4,684 · Tagalog (incl. Filipino): 3,238 · Other Asian and Pacific Island: 19,896 · Arabic: 1,914 · Other and unspecified languages: 2,704California · Population 5 years and over: 37,028,644 · Language other than English: 44.1% · Speak only English: 55.9% · Spanish: 28.2% · Other non-English languages: 15.9% · Spanish (count): 10,446,277 · French, Haitian or Cajun: 136,413 · German or other West Germanic: 118,885 · Russian, Polish or other Slavic: 264,865 · Other Indo-European: 1,239,326 · Korean: 355,494 · Chinese (incl. Mandarin, Cantonese): 1,274,086 · Vietnamese: 562,701 · Tagalog (incl. Filipino): 769,480 · Other Asian and Pacific Island: 726,747 · Arabic: 211,800 · Other and unspecified languages: 209,279Colorado · Population 5 years and over: 5,495,304 · Language other than English: 16.1% · Speak only English: 83.9% · Spanish: 11.0% · Other non-English languages: 5.1% · Spanish (count): 606,804 · French, Haitian or Cajun: 21,537 · German or other West Germanic: 24,301 · Russian, Polish or other Slavic: 29,791 · Other Indo-European: 49,004 · Korean: 13,189 · Chinese (incl. Mandarin, Cantonese): 23,749 · Vietnamese: 20,438 · Tagalog (incl. Filipino): 9,238 · Other Asian and Pacific Island: 35,905 · Arabic: 14,052 · Other and unspecified languages: 38,614Connecticut · Population 5 years and over: 3,417,108 · Language other than English: 23.0% · Speak only English: 77.0% · Spanish: 12.6% · Other non-English languages: 10.5% · Spanish (count): 428,938 · French, Haitian or Cajun: 38,919 · German or other West Germanic: 10,103 · Russian, Polish or other Slavic: 51,265 · Other Indo-European: 136,571 · Korean: 6,517 · Chinese (incl. Mandarin, Cantonese): 31,008 · Vietnamese: 8,065 · Tagalog (incl. Filipino): 8,785 · Other Asian and Pacific Island: 30,676 · Arabic: 11,787 · Other and unspecified languages: 23,710Delaware · Population 5 years and over: 951,327 · Language other than English: 14.8% · Speak only English: 85.2% · Spanish: 7.8% · Other non-English languages: 7.0% · Spanish (count): 73,851 · French, Haitian or Cajun: 9,717 · German or other West Germanic: 4,430 · Russian, Polish or other Slavic: 3,183 · Other Indo-European: 15,740 · Korean: 1,783 · Chinese (incl. Mandarin, Cantonese): 7,440 · Vietnamese: 1,576 · Tagalog (incl. Filipino): 3,070 · Other Asian and Pacific Island: 7,215 · Arabic: 3,278 · Other and unspecified languages: 9,110Florida · Population 5 years and over: 20,814,553 · Language other than English: 30.1% · Speak only English: 69.9% · Spanish: 22.2% · Other non-English languages: 7.9% · Spanish (count): 4,618,042 · French, Haitian or Cajun: 552,720 · German or other West Germanic: 78,501 · Russian, Polish or other Slavic: 137,501 · Other Indo-European: 388,005 · Korean: 16,663 · Chinese (incl. Mandarin, Cantonese): 74,217 · Vietnamese: 69,399 · Tagalog (incl. Filipino): 71,768 · Other Asian and Pacific Island: 98,525 · Arabic: 73,579 · Other and unspecified languages: 86,902Georgia · Population 5 years and over: 10,183,479 · Language other than English: 15.0% · Speak only English: 85.0% · Spanish: 8.4% · Other non-English languages: 6.6% · Spanish (count): 858,772 · French, Haitian or Cajun: 59,838 · German or other West Germanic: 29,623 · Russian, Polish or other Slavic: 31,646 · Other Indo-European: 157,001 · Korean: 50,024 · Chinese (incl. Mandarin, Cantonese): 57,449 · Vietnamese: 58,377 · Tagalog (incl. Filipino): 14,768 · Other Asian and Pacific Island: 88,256 · Arabic: 20,747 · Other and unspecified languages: 105,980Hawaii · Population 5 years and over: 1,363,614 · Language other than English: 25.1% · Speak only English: 74.9% · Spanish: 2.0% · Other non-English languages: 23.1% · Spanish (count): 26,995 · French, Haitian or Cajun: 3,525 · German or other West Germanic: 4,274 · Russian, Polish or other Slavic: 3,442 · Other Indo-European: 5,867 · Korean: 14,812 · Chinese (incl. Mandarin, Cantonese): 33,757 · Vietnamese: 9,923 · Tagalog (incl. Filipino): 59,329 · Other Asian and Pacific Island: 165,521 · Arabic: 436 · Other and unspecified languages: 14,515Idaho · Population 5 years and over: 1,780,030 · Language other than English: 10.7% · Speak only English: 89.3% · Spanish: 8.0% · Other non-English languages: 2.7% · Spanish (count): 142,101 · French, Haitian or Cajun: 3,205 · German or other West Germanic: 5,656 · Russian, Polish or other Slavic: 7,357 · Other Indo-European: 8,449 · Korean: 1,620 · Chinese (incl. Mandarin, Cantonese): 4,036 · Vietnamese: 1,454 · Tagalog (incl. Filipino): 1,836 · Other Asian and Pacific Island: 6,374 · Arabic: 2,702 · Other and unspecified languages: 5,985Illinois · Population 5 years and over: 11,984,023 · Language other than English: 23.8% · Speak only English: 76.2% · Spanish: 13.9% · Other non-English languages: 9.9% · Spanish (count): 1,669,905 · French, Haitian or Cajun: 42,120 · German or other West Germanic: 38,095 · Russian, Polish or other Slavic: 294,304 · Other Indo-European: 300,543 · Korean: 39,231 · Chinese (incl. Mandarin, Cantonese): 107,143 · Vietnamese: 22,218 · Tagalog (incl. Filipino): 83,603 · Other Asian and Pacific Island: 112,768 · Arabic: 71,426 · Other and unspecified languages: 71,078Indiana · Population 5 years and over: 6,399,929 · Language other than English: 9.8% · Speak only English: 90.2% · Spanish: 5.2% · Other non-English languages: 4.6% · Spanish (count): 335,205 · French, Haitian or Cajun: 21,472 · German or other West Germanic: 68,182 · Russian, Polish or other Slavic: 18,573 · Other Indo-European: 51,057 · Korean: 7,922 · Chinese (incl. Mandarin, Cantonese): 23,658 · Vietnamese: 7,592 · Tagalog (incl. Filipino): 10,120 · Other Asian and Pacific Island: 47,249 · Arabic: 13,451 · Other and unspecified languages: 25,356Iowa · Population 5 years and over: 3,007,357 · Language other than English: 8.9% · Speak only English: 91.1% · Spanish: 4.6% · Other non-English languages: 4.4% · Spanish (count): 136,905 · French, Haitian or Cajun: 8,899 · German or other West Germanic: 16,736 · Russian, Polish or other Slavic: 12,191 · Other Indo-European: 15,407 · Korean: 3,305 · Chinese (incl. Mandarin, Cantonese): 9,218 · Vietnamese: 8,163 · Tagalog (incl. Filipino): 3,600 · Other Asian and Pacific Island: 26,674 · Arabic: 9,783 · Other and unspecified languages: 17,302Kansas · Population 5 years and over: 2,758,109 · Language other than English: 12.1% · Speak only English: 87.9% · Spanish: 8.0% · Other non-English languages: 4.0% · Spanish (count): 221,988 · French, Haitian or Cajun: 5,178 · German or other West Germanic: 11,882 · Russian, Polish or other Slavic: 3,950 · Other Indo-European: 17,803 · Korean: 2,964 · Chinese (incl. Mandarin, Cantonese): 11,278 · Vietnamese: 12,542 · Tagalog (incl. Filipino): 4,045 · Other Asian and Pacific Island: 21,015 · Arabic: 6,225 · Other and unspecified languages: 14,355Kentucky · Population 5 years and over: 4,243,362 · Language other than English: 6.4% · Speak only English: 93.6% · Spanish: 3.3% · Other non-English languages: 3.2% · Spanish (count): 138,283 · French, Haitian or Cajun: 12,042 · German or other West Germanic: 21,480 · Russian, Polish or other Slavic: 10,690 · Other Indo-European: 22,001 · Korean: 3,532 · Chinese (incl. Mandarin, Cantonese): 7,689 · Vietnamese: 4,183 · Tagalog (incl. Filipino): 5,020 · Other Asian and Pacific Island: 20,892 · Arabic: 9,637 · Other and unspecified languages: 18,066Louisiana · Population 5 years and over: 4,331,954 · Language other than English: 8.3% · Speak only English: 91.7% · Spanish: 4.5% · Other non-English languages: 3.8% · Spanish (count): 195,221 · French, Haitian or Cajun: 65,936 · German or other West Germanic: 4,746 · Russian, Polish or other Slavic: 3,576 · Other Indo-European: 22,449 · Korean: 2,380 · Chinese (incl. Mandarin, Cantonese): 9,462 · Vietnamese: 22,554 · Tagalog (incl. Filipino): 5,401 · Other Asian and Pacific Island: 9,636 · Arabic: 12,962 · Other and unspecified languages: 6,099Maine · Population 5 years and over: 1,314,485 · Language other than English: 6.0% · Speak only English: 94.0% · Spanish: 0.9% · Other non-English languages: 5.0% · Spanish (count): 12,179 · French, Haitian or Cajun: 31,805 · German or other West Germanic: 4,723 · Russian, Polish or other Slavic: 2,917 · Other Indo-European: 7,424 · Korean: 643 · Chinese (incl. Mandarin, Cantonese): 2,550 · Vietnamese: 1,156 · Tagalog (incl. Filipino): 1,381 · Other Asian and Pacific Island: 3,581 · Arabic: 2,154 · Other and unspecified languages: 7,963Maryland · Population 5 years and over: 5,811,398 · Language other than English: 20.6% · Speak only English: 79.4% · Spanish: 9.4% · Other non-English languages: 11.2% · Spanish (count): 548,412 · French, Haitian or Cajun: 74,053 · German or other West Germanic: 19,422 · Russian, Polish or other Slavic: 34,900 · Other Indo-European: 144,224 · Korean: 35,576 · Chinese (incl. Mandarin, Cantonese): 70,119 · Vietnamese: 19,935 · Tagalog (incl. Filipino): 32,412 · Other Asian and Pacific Island: 58,347 · Arabic: 21,856 · Other and unspecified languages: 138,979Massachusetts · Population 5 years and over: 6,642,060 · Language other than English: 24.8% · Speak only English: 75.2% · Spanish: 9.6% · Other non-English languages: 15.2% · Spanish (count): 635,368 · French, Haitian or Cajun: 129,887 · German or other West Germanic: 20,440 · Russian, Polish or other Slavic: 65,709 · Other Indo-European: 392,255 · Korean: 17,974 · Chinese (incl. Mandarin, Cantonese): 142,640 · Vietnamese: 43,801 · Tagalog (incl. Filipino): 8,092 · Other Asian and Pacific Island: 82,096 · Arabic: 40,726 · Other and unspecified languages: 65,584Michigan · Population 5 years and over: 9,502,054 · Language other than English: 10.2% · Speak only English: 89.8% · Spanish: 3.0% · Other non-English languages: 7.1% · Spanish (count): 287,431 · French, Haitian or Cajun: 22,630 · German or other West Germanic: 46,282 · Russian, Polish or other Slavic: 53,397 · Other Indo-European: 164,992 · Korean: 16,954 · Chinese (incl. Mandarin, Cantonese): 45,974 · Vietnamese: 15,526 · Tagalog (incl. Filipino): 15,037 · Other Asian and Pacific Island: 70,013 · Arabic: 167,438 · Other and unspecified languages: 58,889Minnesota · Population 5 years and over: 5,374,611 · Language other than English: 12.2% · Speak only English: 87.8% · Spanish: 4.1% · Other non-English languages: 8.1% · Spanish (count): 221,800 · French, Haitian or Cajun: 17,891 · German or other West Germanic: 20,429 · Russian, Polish or other Slavic: 24,091 · Other Indo-European: 40,146 · Korean: 4,129 · Chinese (incl. Mandarin, Cantonese): 23,159 · Vietnamese: 22,455 · Tagalog (incl. Filipino): 8,138 · Other Asian and Pacific Island: 126,272 · Arabic: 14,792 · Other and unspecified languages: 134,742Mississippi · Population 5 years and over: 2,774,293 · Language other than English: 4.2% · Speak only English: 95.8% · Spanish: 2.6% · Other non-English languages: 1.6% · Spanish (count): 71,295 · French, Haitian or Cajun: 4,247 · German or other West Germanic: 3,294 · Russian, Polish or other Slavic: 1,043 · Other Indo-European: 8,103 · Korean: 1,190 · Chinese (incl. Mandarin, Cantonese): 4,383 · Vietnamese: 5,881 · Tagalog (incl. Filipino): 2,483 · Other Asian and Pacific Island: 3,325 · Arabic: 3,430 · Other and unspecified languages: 7,861Missouri · Population 5 years and over: 5,808,266 · Language other than English: 6.6% · Speak only English: 93.4% · Spanish: 2.9% · Other non-English languages: 3.7% · Spanish (count): 165,840 · French, Haitian or Cajun: 13,730 · German or other West Germanic: 28,442 · Russian, Polish or other Slavic: 24,933 · Other Indo-European: 34,706 · Korean: 6,788 · Chinese (incl. Mandarin, Cantonese): 20,757 · Vietnamese: 12,592 · Tagalog (incl. Filipino): 8,748 · Other Asian and Pacific Island: 29,857 · Arabic: 12,493 · Other and unspecified languages: 22,163Montana · Population 5 years and over: 1,046,240 · Language other than English: 4.2% · Speak only English: 95.8% · Spanish: 1.4% · Other non-English languages: 2.7% · Spanish (count): 15,028 · French, Haitian or Cajun: 1,949 · German or other West Germanic: 7,814 · Russian, Polish or other Slavic: 2,114 · Other Indo-European: 2,480 · Korean: 584 · Chinese (incl. Mandarin, Cantonese): 1,707 · Vietnamese: 537 · Tagalog (incl. Filipino): 1,307 · Other Asian and Pacific Island: 2,123 · Arabic: 421 · Other and unspecified languages: 7,423Nebraska · Population 5 years and over: 1,838,921 · Language other than English: 12.3% · Speak only English: 87.7% · Spanish: 8.1% · Other non-English languages: 4.2% · Spanish (count): 149,033 · French, Haitian or Cajun: 6,026 · German or other West Germanic: 4,702 · Russian, Polish or other Slavic: 5,382 · Other Indo-European: 12,967 · Korean: 1,296 · Chinese (incl. Mandarin, Cantonese): 4,911 · Vietnamese: 8,078 · Tagalog (incl. Filipino): 2,454 · Other Asian and Pacific Island: 13,718 · Arabic: 6,406 · Other and unspecified languages: 11,214Nevada · Population 5 years and over: 2,964,043 · Language other than English: 29.3% · Speak only English: 70.7% · Spanish: 19.9% · Other non-English languages: 9.4% · Spanish (count): 589,815 · French, Haitian or Cajun: 9,449 · German or other West Germanic: 8,718 · Russian, Polish or other Slavic: 15,448 · Other Indo-European: 36,887 · Korean: 11,715 · Chinese (incl. Mandarin, Cantonese): 35,235 · Vietnamese: 10,885 · Tagalog (incl. Filipino): 85,897 · Other Asian and Pacific Island: 30,969 · Arabic: 7,430 · Other and unspecified languages: 25,668New Hampshire · Population 5 years and over: 1,324,629 · Language other than English: 8.0% · Speak only English: 92.0% · Spanish: 2.7% · Other non-English languages: 5.4% · Spanish (count): 35,239 · French, Haitian or Cajun: 16,199 · German or other West Germanic: 4,321 · Russian, Polish or other Slavic: 5,669 · Other Indo-European: 18,881 · Korean: 1,682 · Chinese (incl. Mandarin, Cantonese): 4,999 · Vietnamese: 1,760 · Tagalog (incl. Filipino): 2,138 · Other Asian and Pacific Island: 7,445 · Arabic: 2,565 · Other and unspecified languages: 5,671New Jersey · Population 5 years and over: 8,740,614 · Language other than English: 32.7% · Speak only English: 67.3% · Spanish: 17.0% · Other non-English languages: 15.7% · Spanish (count): 1,482,123 · French, Haitian or Cajun: 94,107 · German or other West Germanic: 31,497 · Russian, Polish or other Slavic: 148,170 · Other Indo-European: 482,443 · Korean: 77,563 · Chinese (incl. Mandarin, Cantonese): 126,060 · Vietnamese: 17,690 · Tagalog (incl. Filipino): 79,291 · Other Asian and Pacific Island: 136,965 · Arabic: 81,357 · Other and unspecified languages: 97,848New Mexico · Population 5 years and over: 2,001,819 · Language other than English: 31.6% · Speak only English: 68.4% · Spanish: 24.5% · Other non-English languages: 7.1% · Spanish (count): 491,275 · French, Haitian or Cajun: 3,754 · German or other West Germanic: 6,117 · Russian, Polish or other Slavic: 2,833 · Other Indo-European: 9,659 · Korean: 2,090 · Chinese (incl. Mandarin, Cantonese): 4,547 · Vietnamese: 4,976 · Tagalog (incl. Filipino): 5,708 · Other Asian and Pacific Island: 4,782 · Arabic: 2,636 · Other and unspecified languages: 94,605New York · Population 5 years and over: 18,769,358 · Language other than English: 30.6% · Speak only English: 69.4% · Spanish: 14.7% · Other non-English languages: 15.9% · Spanish (count): 2,762,664 · French, Haitian or Cajun: 280,614 · German or other West Germanic: 265,973 · Russian, Polish or other Slavic: 383,695 · Other Indo-European: 749,289 · Korean: 90,209 · Chinese (incl. Mandarin, Cantonese): 593,075 · Vietnamese: 22,810 · Tagalog (incl. Filipino): 77,225 · Other Asian and Pacific Island: 174,814 · Arabic: 121,719 · Other and unspecified languages: 229,791North Carolina · Population 5 years and over: 9,986,027 · Language other than English: 13.0% · Speak only English: 87.0% · Spanish: 8.4% · Other non-English languages: 4.6% · Spanish (count): 841,347 · French, Haitian or Cajun: 38,710 · German or other West Germanic: 26,790 · Russian, Polish or other Slavic: 29,143 · Other Indo-European: 107,683 · Korean: 15,737 · Chinese (incl. Mandarin, Cantonese): 39,527 · Vietnamese: 25,565 · Tagalog (incl. Filipino): 16,840 · Other Asian and Pacific Island: 83,560 · Arabic: 31,148 · Other and unspecified languages: 44,131North Dakota · Population 5 years and over: 727,989 · Language other than English: 6.4% · Speak only English: 93.6% · Spanish: 2.0% · Other non-English languages: 4.3% · Spanish (count): 14,612 · French, Haitian or Cajun: 2,165 · German or other West Germanic: 5,311 · Russian, Polish or other Slavic: 2,157 · Other Indo-European: 4,765 · Korean: 993 · Chinese (incl. Mandarin, Cantonese): 1,200 · Vietnamese: 667 · Tagalog (incl. Filipino): 2,157 · Other Asian and Pacific Island: 1,870 · Arabic: 1,510 · Other and unspecified languages: 8,871Ohio · Population 5 years and over: 11,104,430 · Language other than English: 7.7% · Speak only English: 92.3% · Spanish: 2.5% · Other non-English languages: 5.2% · Spanish (count): 283,123 · French, Haitian or Cajun: 34,270 · German or other West Germanic: 100,144 · Russian, Polish or other Slavic: 47,640 · Other Indo-European: 126,130 · Korean: 9,175 · Chinese (incl. Mandarin, Cantonese): 46,164 · Vietnamese: 13,153 · Tagalog (incl. Filipino): 14,876 · Other Asian and Pacific Island: 59,920 · Arabic: 45,213 · Other and unspecified languages: 79,649Oklahoma · Population 5 years and over: 3,747,614 · Language other than English: 11.3% · Speak only English: 88.7% · Spanish: 7.9% · Other non-English languages: 3.3% · Spanish (count): 297,671 · French, Haitian or Cajun: 5,492 · German or other West Germanic: 10,529 · Russian, Polish or other Slavic: 4,810 · Other Indo-European: 17,029 · Korean: 3,078 · Chinese (incl. Mandarin, Cantonese): 10,037 · Vietnamese: 16,953 · Tagalog (incl. Filipino): 4,818 · Other Asian and Pacific Island: 25,780 · Arabic: 5,733 · Other and unspecified languages: 20,547Oregon · Population 5 years and over: 4,026,229 · Language other than English: 15.1% · Speak only English: 84.9% · Spanish: 9.0% · Other non-English languages: 6.2% · Spanish (count): 360,507 · French, Haitian or Cajun: 12,621 · German or other West Germanic: 15,933 · Russian, Polish or other Slavic: 31,785 · Other Indo-European: 38,967 · Korean: 10,280 · Chinese (incl. Mandarin, Cantonese): 31,556 · Vietnamese: 25,566 · Tagalog (incl. Filipino): 11,768 · Other Asian and Pacific Island: 43,353 · Arabic: 8,982 · Other and unspecified languages: 17,953Pennsylvania · Population 5 years and over: 12,301,139 · Language other than English: 12.0% · Speak only English: 88.0% · Spanish: 5.4% · Other non-English languages: 6.6% · Spanish (count): 664,669 · French, Haitian or Cajun: 55,253 · German or other West Germanic: 109,801 · Russian, Polish or other Slavic: 90,999 · Other Indo-European: 198,115 · Korean: 26,460 · Chinese (incl. Mandarin, Cantonese): 96,237 · Vietnamese: 34,536 · Tagalog (incl. Filipino): 17,852 · Other Asian and Pacific Island: 85,650 · Arabic: 42,882 · Other and unspecified languages: 59,619Rhode Island · Population 5 years and over: 1,041,558 · Language other than English: 22.7% · Speak only English: 77.3% · Spanish: 13.0% · Other non-English languages: 9.6% · Spanish (count): 135,886 · French, Haitian or Cajun: 17,611 · German or other West Germanic: 1,859 · Russian, Polish or other Slavic: 5,614 · Other Indo-European: 42,197 · Korean: 1,170 · Chinese (incl. Mandarin, Cantonese): 7,218 · Vietnamese: 803 · Tagalog (incl. Filipino): 1,996 · Other Asian and Pacific Island: 11,554 · Arabic: 2,674 · Other and unspecified languages: 7,758South Carolina · Population 5 years and over: 4,924,906 · Language other than English: 8.2% · Speak only English: 91.8% · Spanish: 5.2% · Other non-English languages: 3.0% · Spanish (count): 254,999 · French, Haitian or Cajun: 11,956 · German or other West Germanic: 14,373 · Russian, Polish or other Slavic: 18,241 · Other Indo-European: 37,049 · Korean: 4,679 · Chinese (incl. Mandarin, Cantonese): 10,598 · Vietnamese: 7,828 · Tagalog (incl. Filipino): 8,951 · Other Asian and Pacific Island: 17,102 · Arabic: 4,956 · Other and unspecified languages: 11,443South Dakota · Population 5 years and over: 841,073 · Language other than English: 6.7% · Speak only English: 93.3% · Spanish: 2.4% · Other non-English languages: 4.2% · Spanish (count): 20,492 · French, Haitian or Cajun: 1,086 · German or other West Germanic: 5,798 · Russian, Polish or other Slavic: 2,772 · Other Indo-European: 3,533 · Korean: 542 · Chinese (incl. Mandarin, Cantonese): 801 · Vietnamese: 962 · Tagalog (incl. Filipino): 1,410 · Other Asian and Pacific Island: 3,162 · Arabic: 838 · Other and unspecified languages: 14,729Tennessee · Population 5 years and over: 6,576,407 · Language other than English: 8.3% · Speak only English: 91.7% · Spanish: 5.1% · Other non-English languages: 3.3% · Spanish (count): 332,843 · French, Haitian or Cajun: 13,829 · German or other West Germanic: 16,921 · Russian, Polish or other Slavic: 11,130 · Other Indo-European: 43,625 · Korean: 7,245 · Chinese (incl. Mandarin, Cantonese): 14,697 · Vietnamese: 10,050 · Tagalog (incl. Filipino): 8,290 · Other Asian and Pacific Island: 30,257 · Arabic: 32,309 · Other and unspecified languages: 25,745Texas · Population 5 years and over: 27,712,101 · Language other than English: 34.9% · Speak only English: 65.1% · Spanish: 28.1% · Other non-English languages: 6.8% · Spanish (count): 7,782,802 · French, Haitian or Cajun: 90,862 · German or other West Germanic: 76,530 · Russian, Polish or other Slavic: 65,700 · Other Indo-European: 459,573 · Korean: 67,152 · Chinese (incl. Mandarin, Cantonese): 188,675 · Vietnamese: 238,917 · Tagalog (incl. Filipino): 92,275 · Other Asian and Pacific Island: 284,376 · Arabic: 114,705 · Other and unspecified languages: 198,794Utah · Population 5 years and over: 3,093,041 · Language other than English: 15.7% · Speak only English: 84.3% · Spanish: 10.7% · Other non-English languages: 5.0% · Spanish (count): 329,804 · French, Haitian or Cajun: 9,107 · German or other West Germanic: 10,418 · Russian, Polish or other Slavic: 9,882 · Other Indo-European: 35,167 · Korean: 4,580 · Chinese (incl. Mandarin, Cantonese): 16,953 · Vietnamese: 7,829 · Tagalog (incl. Filipino): 7,265 · Other Asian and Pacific Island: 32,280 · Arabic: 4,896 · Other and unspecified languages: 16,425Vermont · Population 5 years and over: 617,201 · Language other than English: 5.5% · Speak only English: 94.5% · Spanish: 1.3% · Other non-English languages: 4.2% · Spanish (count): 7,829 · French, Haitian or Cajun: 8,240 · German or other West Germanic: 1,939 · Russian, Polish or other Slavic: 3,118 · Other Indo-European: 5,466 · Korean: 352 · Chinese (incl. Mandarin, Cantonese): 1,495 · Vietnamese: 472 · Tagalog (incl. Filipino): 648 · Other Asian and Pacific Island: 2,032 · Arabic: 419 · Other and unspecified languages: 1,914Virginia · Population 5 years and over: 8,162,218 · Language other than English: 17.2% · Speak only English: 82.8% · Spanish: 7.9% · Other non-English languages: 9.3% · Spanish (count): 642,108 · French, Haitian or Cajun: 40,182 · German or other West Germanic: 28,858 · Russian, Polish or other Slavic: 31,067 · Other Indo-European: 206,170 · Korean: 56,655 · Chinese (incl. Mandarin, Cantonese): 58,800 · Vietnamese: 50,764 · Tagalog (incl. Filipino): 46,382 · Other Asian and Pacific Island: 95,843 · Arabic: 60,534 · Other and unspecified languages: 84,264Washington · Population 5 years and over: 7,303,551 · Language other than English: 21.0% · Speak only English: 79.0% · Spanish: 9.0% · Other non-English languages: 12.0% · Spanish (count): 657,756 · French, Haitian or Cajun: 27,580 · German or other West Germanic: 29,807 · Russian, Polish or other Slavic: 109,747 · Other Indo-European: 142,077 · Korean: 52,583 · Chinese (incl. Mandarin, Cantonese): 134,060 · Vietnamese: 68,740 · Tagalog (incl. Filipino): 62,311 · Other Asian and Pacific Island: 145,165 · Arabic: 24,525 · Other and unspecified languages: 79,065West Virginia · Population 5 years and over: 1,695,154 · Language other than English: 2.5% · Speak only English: 97.5% · Spanish: 1.1% · Other non-English languages: 1.4% · Spanish (count): 18,939 · French, Haitian or Cajun: 1,920 · German or other West Germanic: 3,009 · Russian, Polish or other Slavic: 1,176 · Other Indo-European: 5,702 · Korean: 684 · Chinese (incl. Mandarin, Cantonese): 2,096 · Vietnamese: 943 · Tagalog (incl. Filipino): 1,184 · Other Asian and Pacific Island: 2,683 · Arabic: 2,378 · Other and unspecified languages: 1,951Wisconsin · Population 5 years and over: 5,571,572 · Language other than English: 8.8% · Speak only English: 91.2% · Spanish: 4.8% · Other non-English languages: 4.0% · Spanish (count): 269,020 · French, Haitian or Cajun: 8,702 · German or other West Germanic: 40,007 · Russian, Polish or other Slavic: 18,011 · Other Indo-European: 38,244 · Korean: 3,384 · Chinese (incl. Mandarin, Cantonese): 16,887 · Vietnamese: 4,516 · Tagalog (incl. Filipino): 7,149 · Other Asian and Pacific Island: 62,917 · Arabic: 8,156 · Other and unspecified languages: 15,067Wyoming · Population 5 years and over: 547,813 · Language other than English: 6.8% · Speak only English: 93.2% · Spanish: 4.7% · Other non-English languages: 2.1% · Spanish (count): 25,902 · French, Haitian or Cajun: 1,171 · German or other West Germanic: 2,046 · Russian, Polish or other Slavic: 1,267 · Other Indo-European: 1,344 · Korean: 200 · Chinese (incl. Mandarin, Cantonese): 836 · Vietnamese: 384 · Tagalog (incl. Filipino): 704 · Other Asian and Pacific Island: 1,443 · Arabic: 115 · Other and unspecified languages: 1,923District of Columbia · Population 5 years and over: 631,163 · Language other than English: 18.0% · Speak only English: 82.0% · Spanish: 9.2% · Other non-English languages: 8.7% · Spanish (count): 58,315 · French, Haitian or Cajun: 9,922 · German or other West Germanic: 2,583 · Russian, Polish or other Slavic: 3,452 · Other Indo-European: 11,579 · Korean: 2,124 · Chinese (incl. Mandarin, Cantonese): 5,149 · Vietnamese: 1,126 · Tagalog (incl. Filipino): 1,376 · Other Asian and Pacific Island: 3,597 · Arabic: 2,174 · Other and unspecified languages: 12,137District of Columbia · Population 5 years and over: 631,163 · Language other than English: 18.0% · Speak only English: 82.0% · Spanish: 9.2% · Other non-English languages: 8.7% · Spanish (count): 58,315 · French, Haitian or Cajun: 9,922 · German or other West Germanic: 2,583 · Russian, Polish or other Slavic: 3,452 · Other Indo-European: 11,579 · Korean: 2,124 · Chinese (incl. Mandarin, Cantonese): 5,149 · Vietnamese: 1,126 · Tagalog (incl. Filipino): 1,376 · Other Asian and Pacific Island: 3,597 · Arabic: 2,174 · Other and unspecified languages: 12,137Language other than English2.5%44.1%
Summary

Darker amber is a higher share of people age 5 and over who speak a language other than English at home. Puerto Rico is listed in the ranking and table but is not on this map.

A typical published area has 12.3% of people age 5 and over speaking a language other than English at home, the midpoint of the 50 states, the District of Columbia and Puerto Rico on the 2023 ACS five-year estimates. Puerto Rico stands apart at 95.1%, almost all of it Spanish. Among the 50 states, California is highest at 44.1%, then Texas at 34.9%. West Virginia is the lowest of the 50 states at 2.5%. Spanish is the largest non-English group in most areas; California leads the 50 states at 28.2% of people age 5 and over. These are each area's own shares of its residents, not a national average of people.

In short

12.3%typical published areathe middle area, not an average
95.1%Puerto Ricohighest share speaking a language other than English
44.1%Californiahighest of the 50 states
2.5%West Virginialowest of the 50 states
28.2%California, Spanishhighest Spanish share among the 50 states
Figure 1

Language other than English, all published states

Language other than English · all 52 · ranked high to low

52 items
View100%
DownloadPDFImageCSV
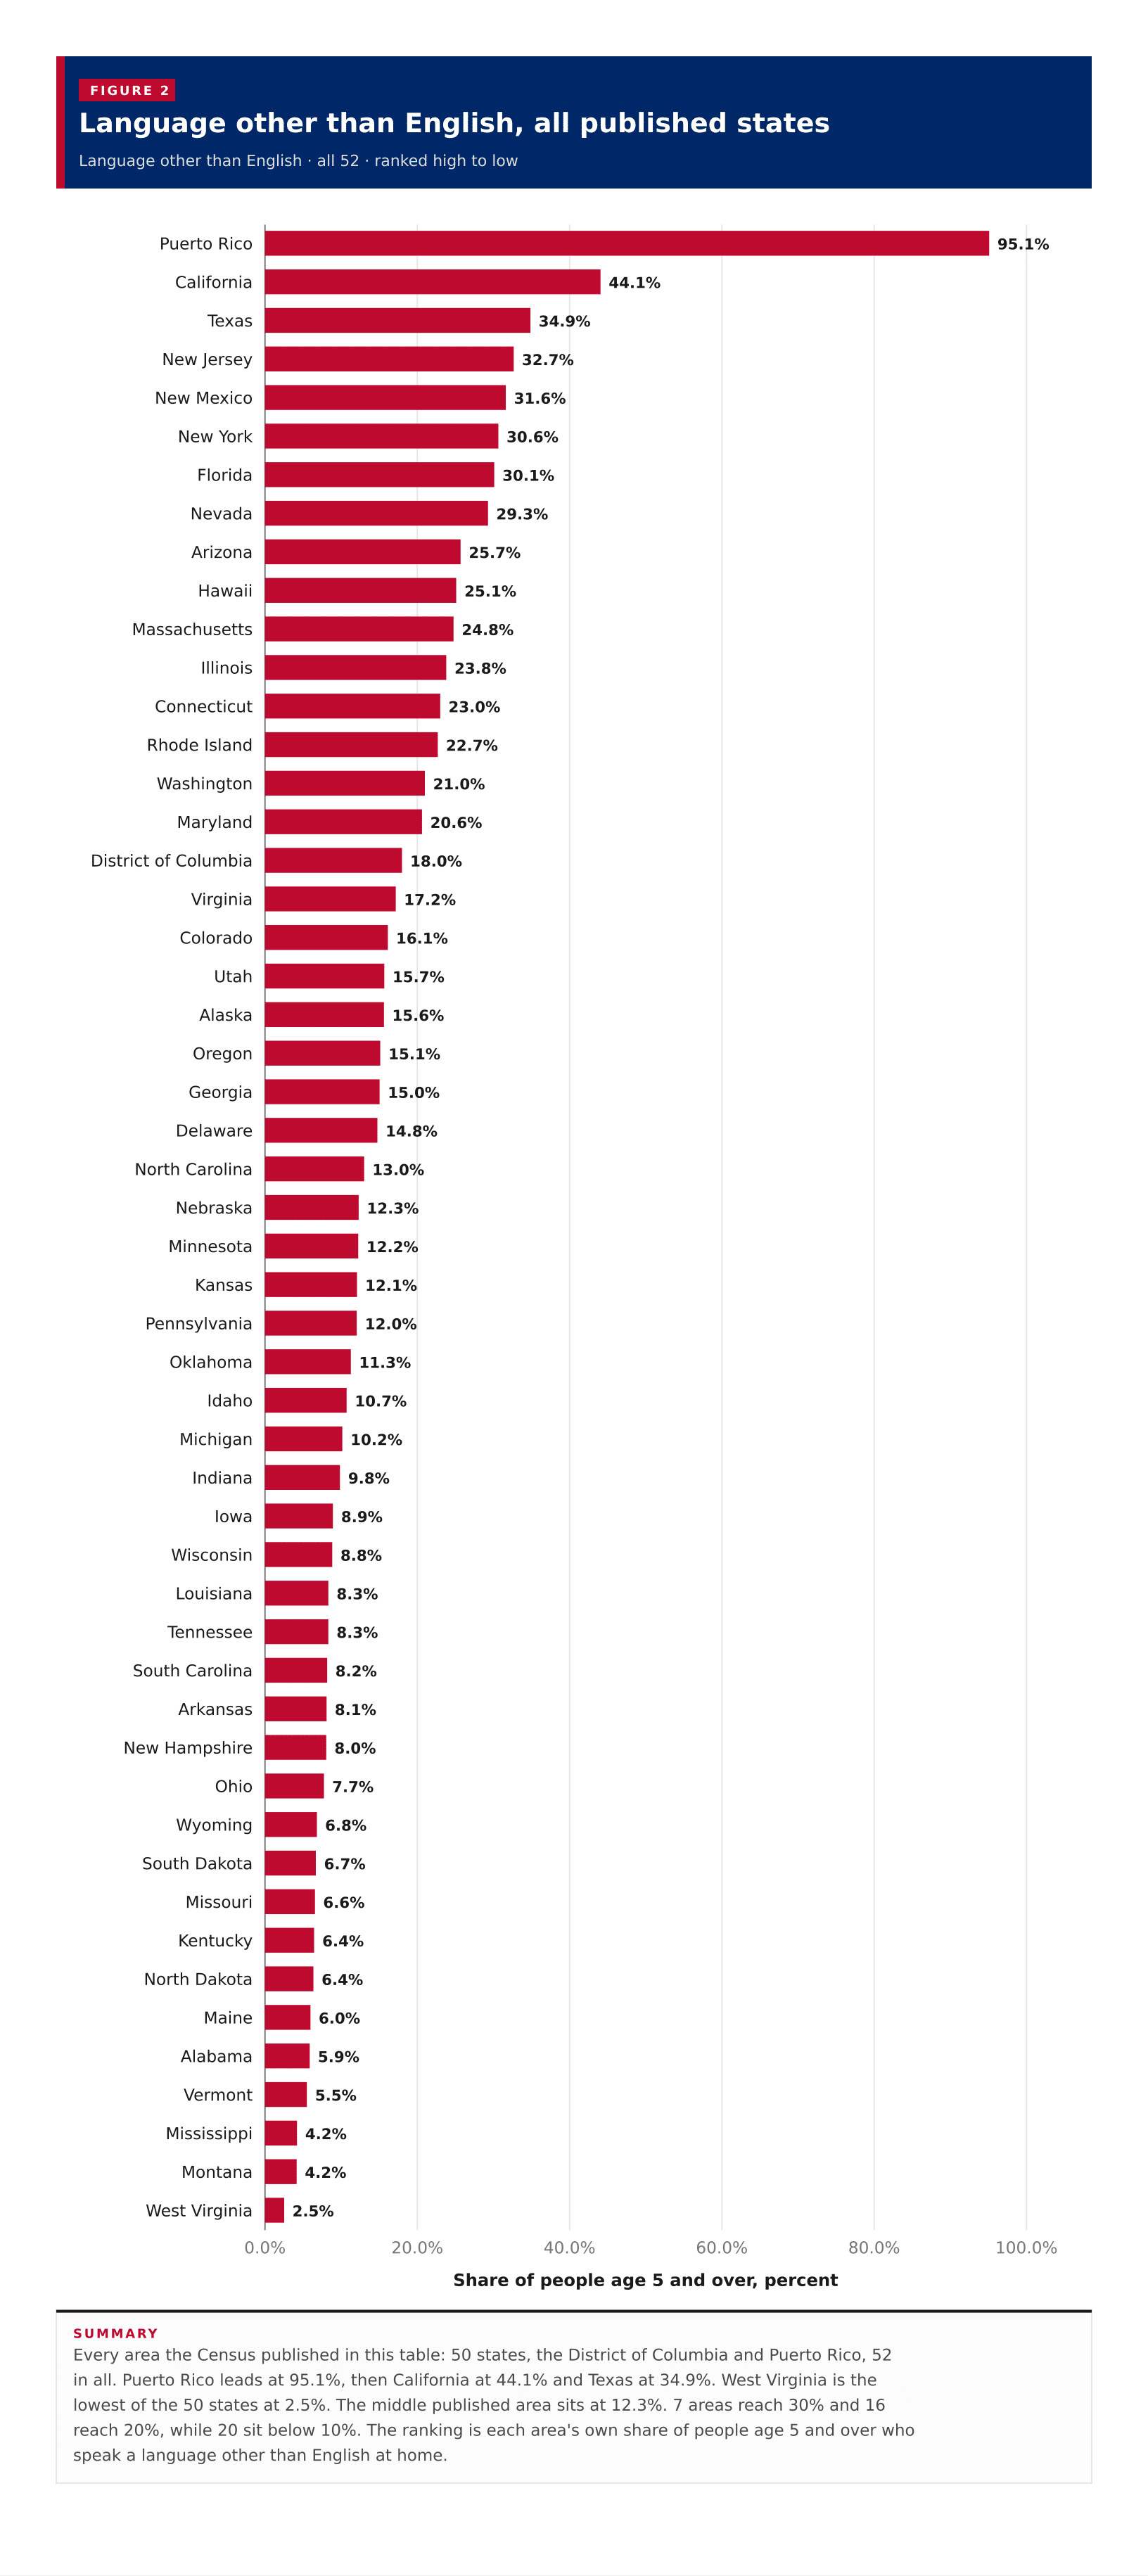
Language other than English, all published statesEvery area the Census published in this table: 50 states, the District of Columbia and Puerto Rico, 52 in all. Puerto Rico leads at 95.1%, then California at 44.1% and Texas at 34.9%. West Virginia is the lowest of the 50 states at 2.5%. The middle published area sits at 12.3%. 7 areas reach 30% and 16 reach 20%, while 20 sit below 10%. The ranking is each area's own share of people age 5 and over who speak a language other than English at home.0.0%20.0%40.0%60.0%80.0%100.0%Share of people age 5 and over, percent95.1%Puerto Rico44.1%California34.9%Texas32.7%New Jersey31.6%New Mexico30.6%New York30.1%Florida29.3%Nevada25.7%Arizona25.1%Hawaii24.8%Massachusetts23.8%Illinois23.0%Connecticut22.7%Rhode Island21.0%Washington20.6%Maryland18.0%District of Columbia17.2%Virginia16.1%Colorado15.7%Utah15.6%Alaska15.1%Oregon15.0%Georgia14.8%Delaware13.0%North Carolina12.3%Nebraska12.2%Minnesota12.1%Kansas12.0%Pennsylvania11.3%Oklahoma10.7%Idaho10.2%Michigan9.8%Indiana8.9%Iowa8.8%Wisconsin8.3%Louisiana8.3%Tennessee8.2%South Carolina8.1%Arkansas8.0%New Hampshire7.7%Ohio6.8%Wyoming6.7%South Dakota6.6%Missouri6.4%Kentucky6.4%North Dakota6.0%Maine5.9%Alabama5.5%Vermont4.2%Mississippi4.2%Montana2.5%West Virginia
Summary

Every area the Census published in this table: 50 states, the District of Columbia and Puerto Rico, 52 in all. Puerto Rico leads at 95.1%, then California at 44.1% and Texas at 34.9%. West Virginia is the lowest of the 50 states at 2.5%. The middle published area sits at 12.3%. 7 areas reach 30% and 16 reach 20%, while 20 sit below 10%. The ranking is each area's own share of people age 5 and over who speak a language other than English at home.

Figure 2

Spanish spoken at home, all published states

Spanish · all 52 · ranked high to low

52 items
View100%
DownloadPDFImageCSV
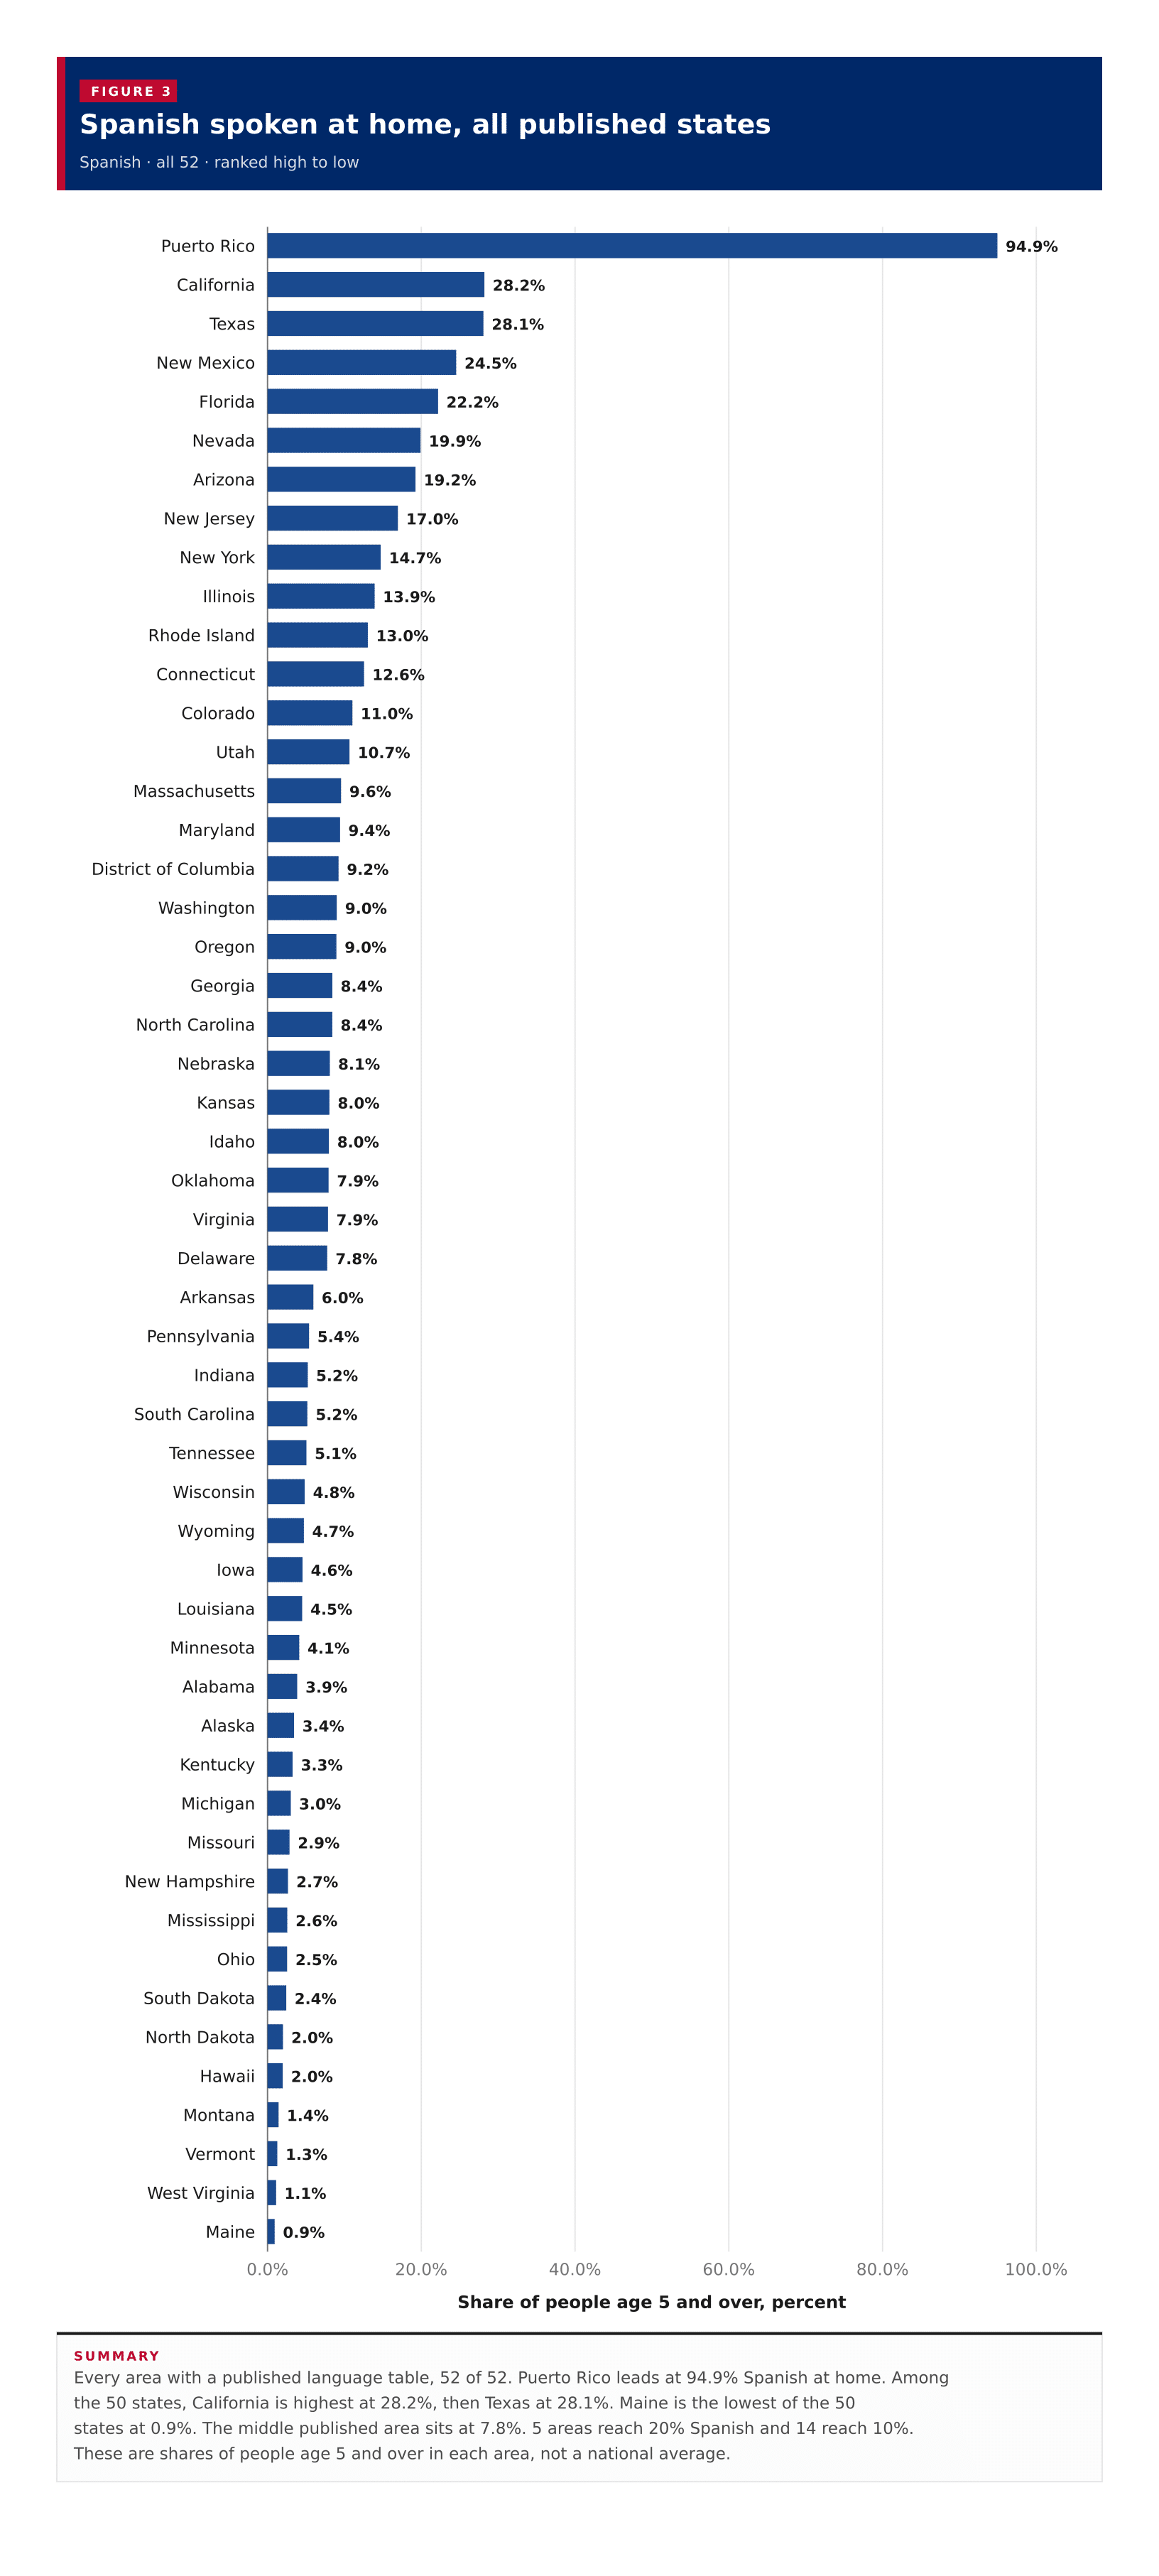
Spanish spoken at home, all published statesEvery area with a published language table, 52 of 52. Puerto Rico leads at 94.9% Spanish at home. Among the 50 states, California is highest at 28.2%, then Texas at 28.1%. Maine is the lowest of the 50 states at 0.9%. The middle published area sits at 7.8%. 5 areas reach 20% Spanish and 14 reach 10%. These are shares of people age 5 and over in each area, not a national average.0.0%20.0%40.0%60.0%80.0%100.0%Share of people age 5 and over, percent94.9%Puerto Rico28.2%California28.1%Texas24.5%New Mexico22.2%Florida19.9%Nevada19.2%Arizona17.0%New Jersey14.7%New York13.9%Illinois13.0%Rhode Island12.6%Connecticut11.0%Colorado10.7%Utah9.6%Massachusetts9.4%Maryland9.2%District of Columbia9.0%Washington9.0%Oregon8.4%Georgia8.4%North Carolina8.1%Nebraska8.0%Kansas8.0%Idaho7.9%Oklahoma7.9%Virginia7.8%Delaware6.0%Arkansas5.4%Pennsylvania5.2%Indiana5.2%South Carolina5.1%Tennessee4.8%Wisconsin4.7%Wyoming4.6%Iowa4.5%Louisiana4.1%Minnesota3.9%Alabama3.4%Alaska3.3%Kentucky3.0%Michigan2.9%Missouri2.7%New Hampshire2.6%Mississippi2.5%Ohio2.4%South Dakota2.0%North Dakota2.0%Hawaii1.4%Montana1.3%Vermont1.1%West Virginia0.9%Maine
Summary

Every area with a published language table, 52 of 52. Puerto Rico leads at 94.9% Spanish at home. Among the 50 states, California is highest at 28.2%, then Texas at 28.1%. Maine is the lowest of the 50 states at 0.9%. The middle published area sits at 7.8%. 5 areas reach 20% Spanish and 14 reach 10%. These are shares of people age 5 and over in each area, not a national average.

Figure 3

Spanish against other non-English languages

Other non-English languages against spanish · one point per row, 52 of 52 plotted

52 items
View100%
DownloadPDFImageCSV
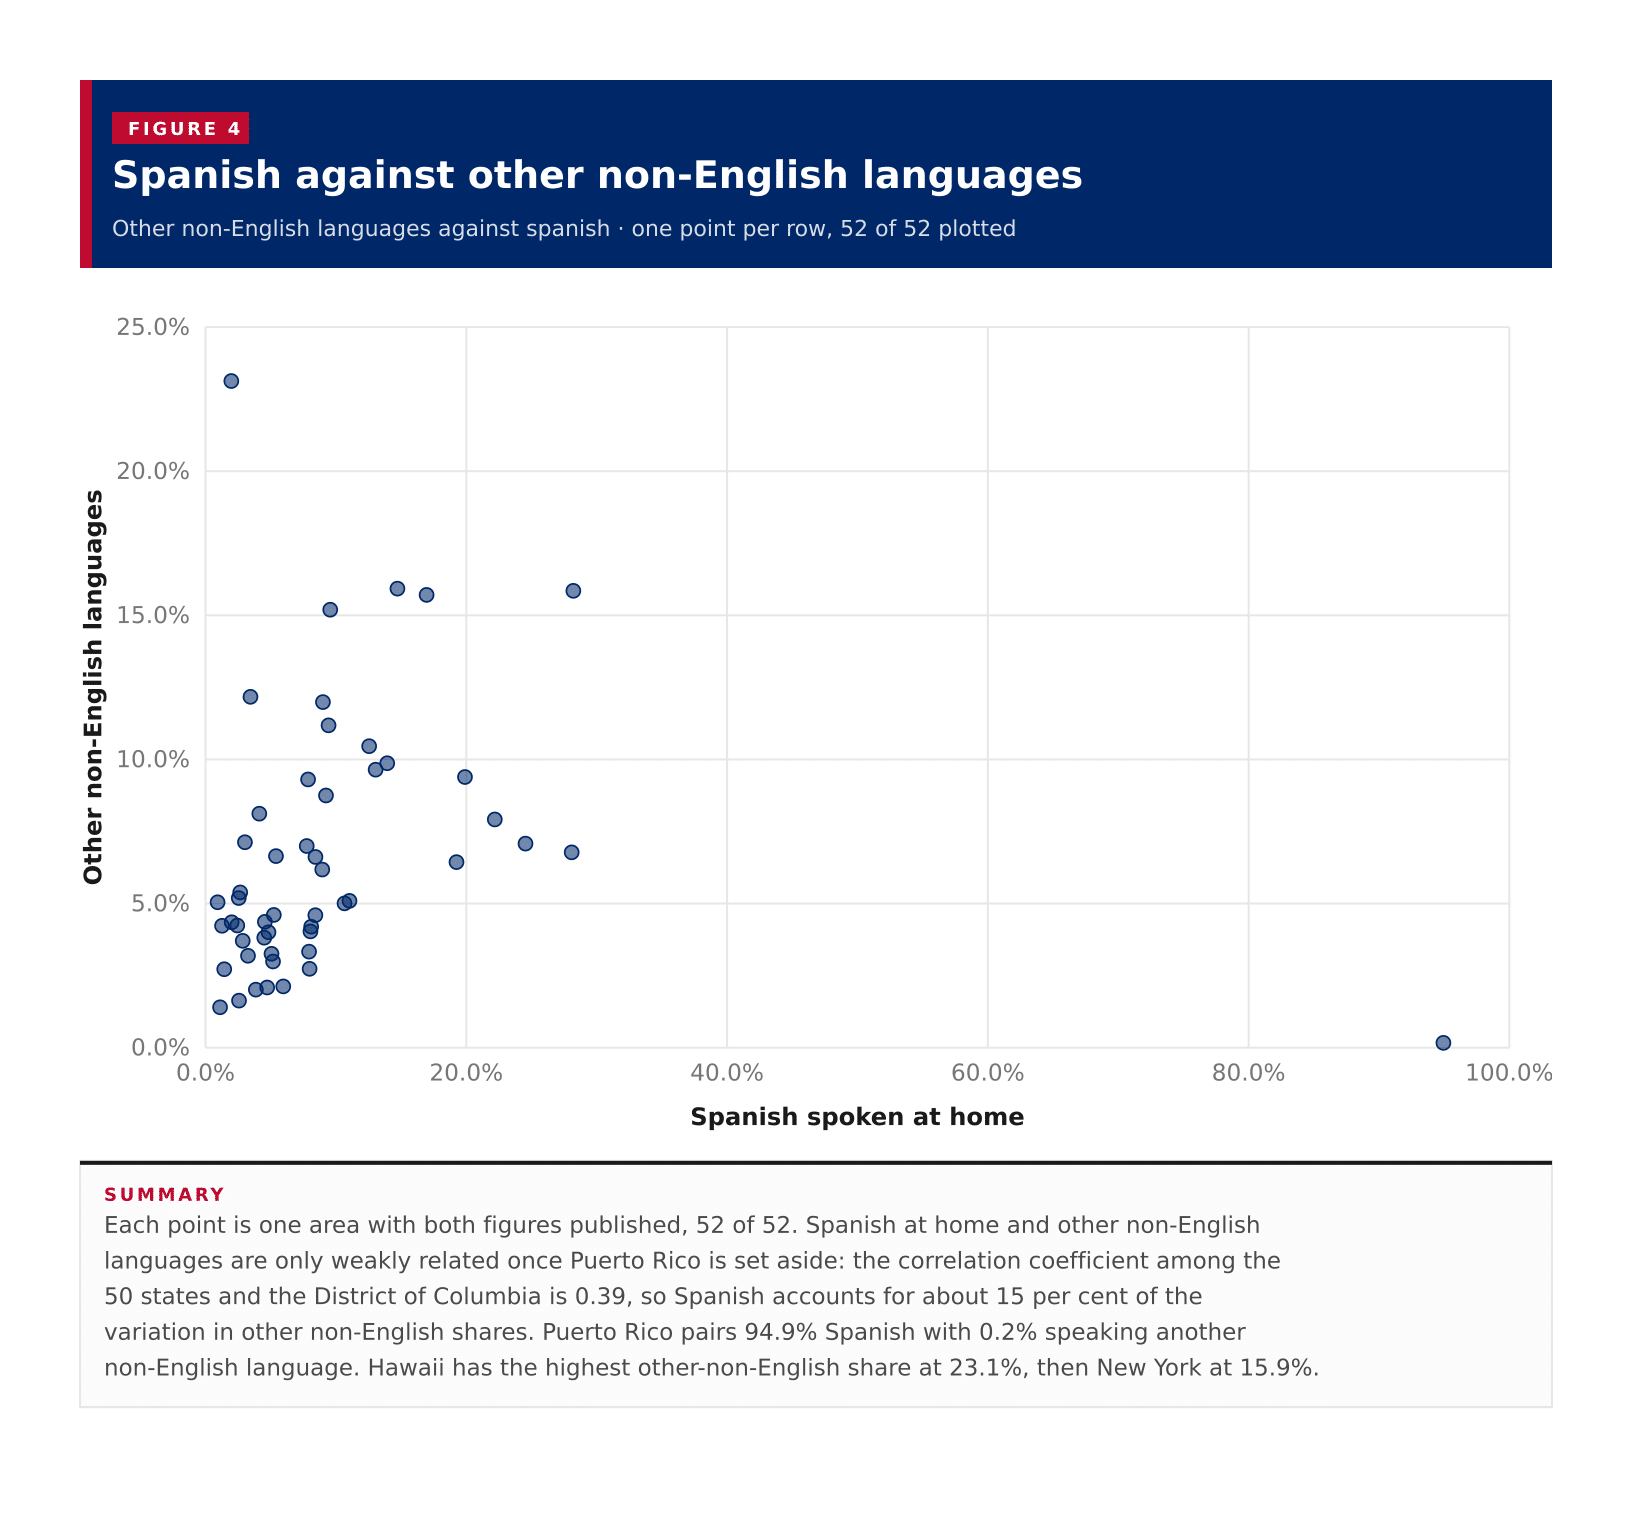
Spanish against other non-English languagesEach point is one area with both figures published, 52 of 52. Spanish at home and other non-English languages are only weakly related once Puerto Rico is set aside: the correlation coefficient among the 50 states and the District of Columbia is 0.39, so Spanish accounts for about 15 per cent of the variation in other non-English shares. Puerto Rico pairs 94.9% Spanish with 0.2% speaking another non-English language. Hawaii has the highest other-non-English share at 23.1%, then New York at 15.9%.0.0%5.0%10.0%15.0%20.0%25.0%0.0%20.0%40.0%60.0%80.0%100.0%Other non-English languagesSpanish spoken at home
Summary

Each point is one area with both figures published, 52 of 52. Spanish at home and other non-English languages are only weakly related once Puerto Rico is set aside: the correlation coefficient among the 50 states and the District of Columbia is 0.39, so Spanish accounts for about 15 per cent of the variation in other non-English shares. Puerto Rico pairs 94.9% Spanish with 0.2% speaking another non-English language. Hawaii has the highest other-non-English share at 23.1%, then New York at 15.9%.

Table 1

All states

52 rows · 18 columns · sorted by language other than English, high to low

52 rows
View100%
DownloadPDFImageCSV
Summary

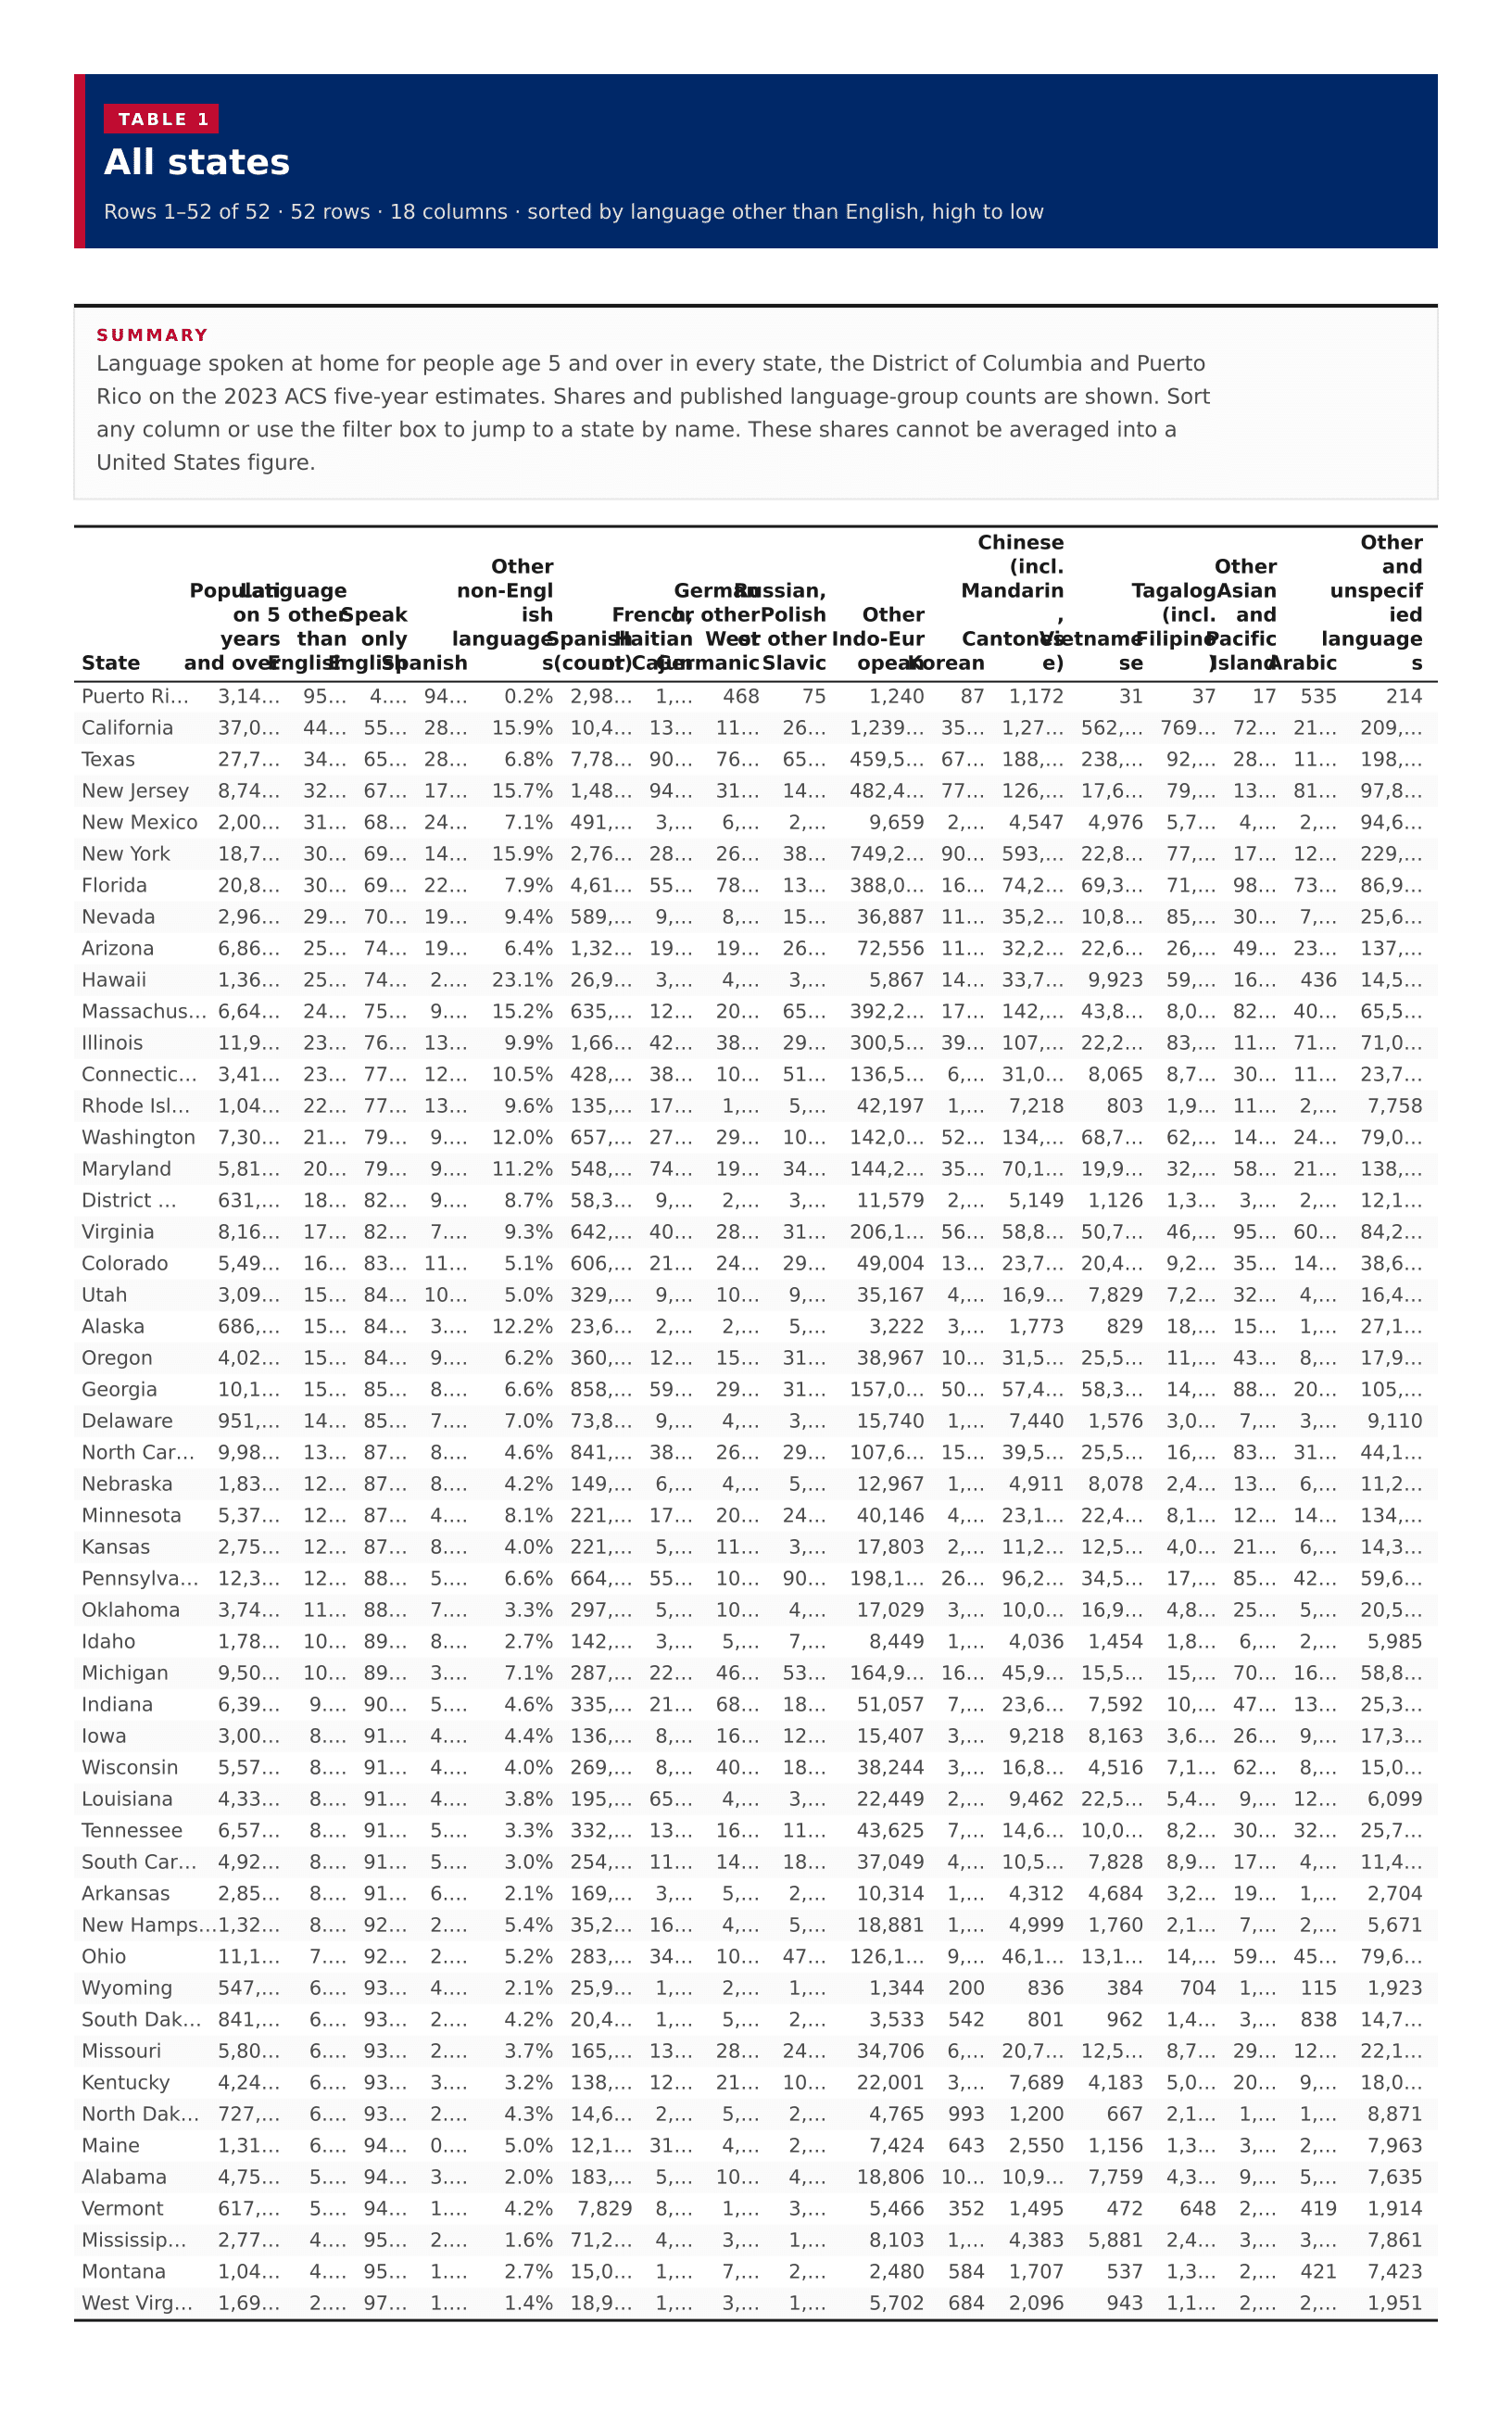
Language spoken at home for people age 5 and over in every state, the District of Columbia and Puerto Rico on the 2023 ACS five-year estimates. Shares and published language-group counts are shown. Sort any column or use the filter box to jump to a state by name. These shares cannot be averaged into a United States figure.

All states
?????
Puerto Rico3,147,83095.1%4.9%94.9%0.2%2,988,5591,321468751,240871,172313717535214
California37,028,64444.1%55.9%28.2%15.9%10,446,277136,413118,885264,8651,239,326355,4941,274,086562,701769,480726,747211,800209,279
Texas27,712,10134.9%65.1%28.1%6.8%7,782,80290,86276,53065,700459,57367,152188,675238,91792,275284,376114,705198,794
New Jersey8,740,61432.7%67.3%17.0%15.7%1,482,12394,10731,497148,170482,44377,563126,06017,69079,291136,96581,35797,848
New Mexico2,001,81931.6%68.4%24.5%7.1%491,2753,7546,1172,8339,6592,0904,5474,9765,7084,7822,63694,605
New York18,769,35830.6%69.4%14.7%15.9%2,762,664280,614265,973383,695749,28990,209593,07522,81077,225174,814121,719229,791
Florida20,814,55330.1%69.9%22.2%7.9%4,618,042552,72078,501137,501388,00516,66374,21769,39971,76898,52573,57986,902
Nevada2,964,04329.3%70.7%19.9%9.4%589,8159,4498,71815,44836,88711,71535,23510,88585,89730,9697,43025,668
Arizona6,868,67625.7%74.3%19.2%6.4%1,322,11119,50419,77426,69072,55611,92532,21822,62326,92249,07123,374137,425
Hawaii1,363,61425.1%74.9%2.0%23.1%26,9953,5254,2743,4425,86714,81233,7579,92359,329165,52143614,515
Massachusetts6,642,06024.8%75.2%9.6%15.2%635,368129,88720,44065,709392,25517,974142,64043,8018,09282,09640,72665,584
Illinois11,984,02323.8%76.2%13.9%9.9%1,669,90542,12038,095294,304300,54339,231107,14322,21883,603112,76871,42671,078
Connecticut3,417,10823.0%77.0%12.6%10.5%428,93838,91910,10351,265136,5716,51731,0088,0658,78530,67611,78723,710
Rhode Island1,041,55822.7%77.3%13.0%9.6%135,88617,6111,8595,61442,1971,1707,2188031,99611,5542,6747,758
Washington7,303,55121.0%79.0%9.0%12.0%657,75627,58029,807109,747142,07752,583134,06068,74062,311145,16524,52579,065
Maryland5,811,39820.6%79.4%9.4%11.2%548,41274,05319,42234,900144,22435,57670,11919,93532,41258,34721,856138,979
District of Columbia631,16318.0%82.0%9.2%8.7%58,3159,9222,5833,45211,5792,1245,1491,1261,3763,5972,17412,137
Virginia8,162,21817.2%82.8%7.9%9.3%642,10840,18228,85831,067206,17056,65558,80050,76446,38295,84360,53484,264
Colorado5,495,30416.1%83.9%11.0%5.1%606,80421,53724,30129,79149,00413,18923,74920,4389,23835,90514,05238,614
Utah3,093,04115.7%84.3%10.7%5.0%329,8049,10710,4189,88235,1674,58016,9537,8297,26532,2804,89616,425
Alaska686,14615.6%84.4%3.4%12.2%23,6652,4362,8425,5103,2223,7961,77382918,75415,3581,80427,195
Oregon4,026,22915.1%84.9%9.0%6.2%360,50712,62115,93331,78538,96710,28031,55625,56611,76843,3538,98217,953
Georgia10,183,47915.0%85.0%8.4%6.6%858,77259,83829,62331,646157,00150,02457,44958,37714,76888,25620,747105,980
Delaware951,32714.8%85.2%7.8%7.0%73,8519,7174,4303,18315,7401,7837,4401,5763,0707,2153,2789,110
North Carolina9,986,02713.0%87.0%8.4%4.6%841,34738,71026,79029,143107,68315,73739,52725,56516,84083,56031,14844,131
Nebraska1,838,92112.3%87.7%8.1%4.2%149,0336,0264,7025,38212,9671,2964,9118,0782,45413,7186,40611,214
Minnesota5,374,61112.2%87.8%4.1%8.1%221,80017,89120,42924,09140,1464,12923,15922,4558,138126,27214,792134,742
Kansas2,758,10912.1%87.9%8.0%4.0%221,9885,17811,8823,95017,8032,96411,27812,5424,04521,0156,22514,355
Pennsylvania12,301,13912.0%88.0%5.4%6.6%664,66955,253109,80190,999198,11526,46096,23734,53617,85285,65042,88259,619
Oklahoma3,747,61411.3%88.7%7.9%3.3%297,6715,49210,5294,81017,0293,07810,03716,9534,81825,7805,73320,547
Idaho1,780,03010.7%89.3%8.0%2.7%142,1013,2055,6567,3578,4491,6204,0361,4541,8366,3742,7025,985
Michigan9,502,05410.2%89.8%3.0%7.1%287,43122,63046,28253,397164,99216,95445,97415,52615,03770,013167,43858,889
Indiana6,399,9299.8%90.2%5.2%4.6%335,20521,47268,18218,57351,0577,92223,6587,59210,12047,24913,45125,356
Iowa3,007,3578.9%91.1%4.6%4.4%136,9058,89916,73612,19115,4073,3059,2188,1633,60026,6749,78317,302
Wisconsin5,571,5728.8%91.2%4.8%4.0%269,0208,70240,00718,01138,2443,38416,8874,5167,14962,9178,15615,067
Louisiana4,331,9548.3%91.7%4.5%3.8%195,22165,9364,7463,57622,4492,3809,46222,5545,4019,63612,9626,099
Tennessee6,576,4078.3%91.7%5.1%3.3%332,84313,82916,92111,13043,6257,24514,69710,0508,29030,25732,30925,745
South Carolina4,924,9068.2%91.8%5.2%3.0%254,99911,95614,37318,24137,0494,67910,5987,8288,95117,1024,95611,443
Arkansas2,850,2138.1%91.9%6.0%2.1%169,9903,5925,7992,07210,3141,9994,3124,6843,23819,8961,9142,704
New Hampshire1,324,6298.0%92.0%2.7%5.4%35,23916,1994,3215,66918,8811,6824,9991,7602,1387,4452,5655,671
Ohio11,104,4307.7%92.3%2.5%5.2%283,12334,270100,14447,640126,1309,17546,16413,15314,87659,92045,21379,649
Wyoming547,8136.8%93.2%4.7%2.1%25,9021,1712,0461,2671,3442008363847041,4431151,923
South Dakota841,0736.7%93.3%2.4%4.2%20,4921,0865,7982,7723,5335428019621,4103,16283814,729
Missouri5,808,2666.6%93.4%2.9%3.7%165,84013,73028,44224,93334,7066,78820,75712,5928,74829,85712,49322,163
Kentucky4,243,3626.4%93.6%3.3%3.2%138,28312,04221,48010,69022,0013,5327,6894,1835,02020,8929,63718,066
North Dakota727,9896.4%93.6%2.0%4.3%14,6122,1655,3112,1574,7659931,2006672,1571,8701,5108,871
Maine1,314,4856.0%94.0%0.9%5.0%12,17931,8054,7232,9177,4246432,5501,1561,3813,5812,1547,963
Alabama4,759,8365.9%94.1%3.9%2.0%183,7745,92910,3614,10018,80610,84810,9317,7594,3939,0495,9347,635
Vermont617,2015.5%94.5%1.3%4.2%7,8298,2401,9393,1185,4663521,4954726482,0324191,914
Mississippi2,774,2934.2%95.8%2.6%1.6%71,2954,2473,2941,0438,1031,1904,3835,8812,4833,3253,4307,861
Montana1,046,2404.2%95.8%1.4%2.7%15,0281,9497,8142,1142,4805841,7075371,3072,1234217,423
West Virginia1,695,1542.5%97.5%1.1%1.4%18,9391,9203,0091,1765,7026842,0969431,1842,6832,3781,951

Image files

Download all

Figure 1

Language other than English, US states
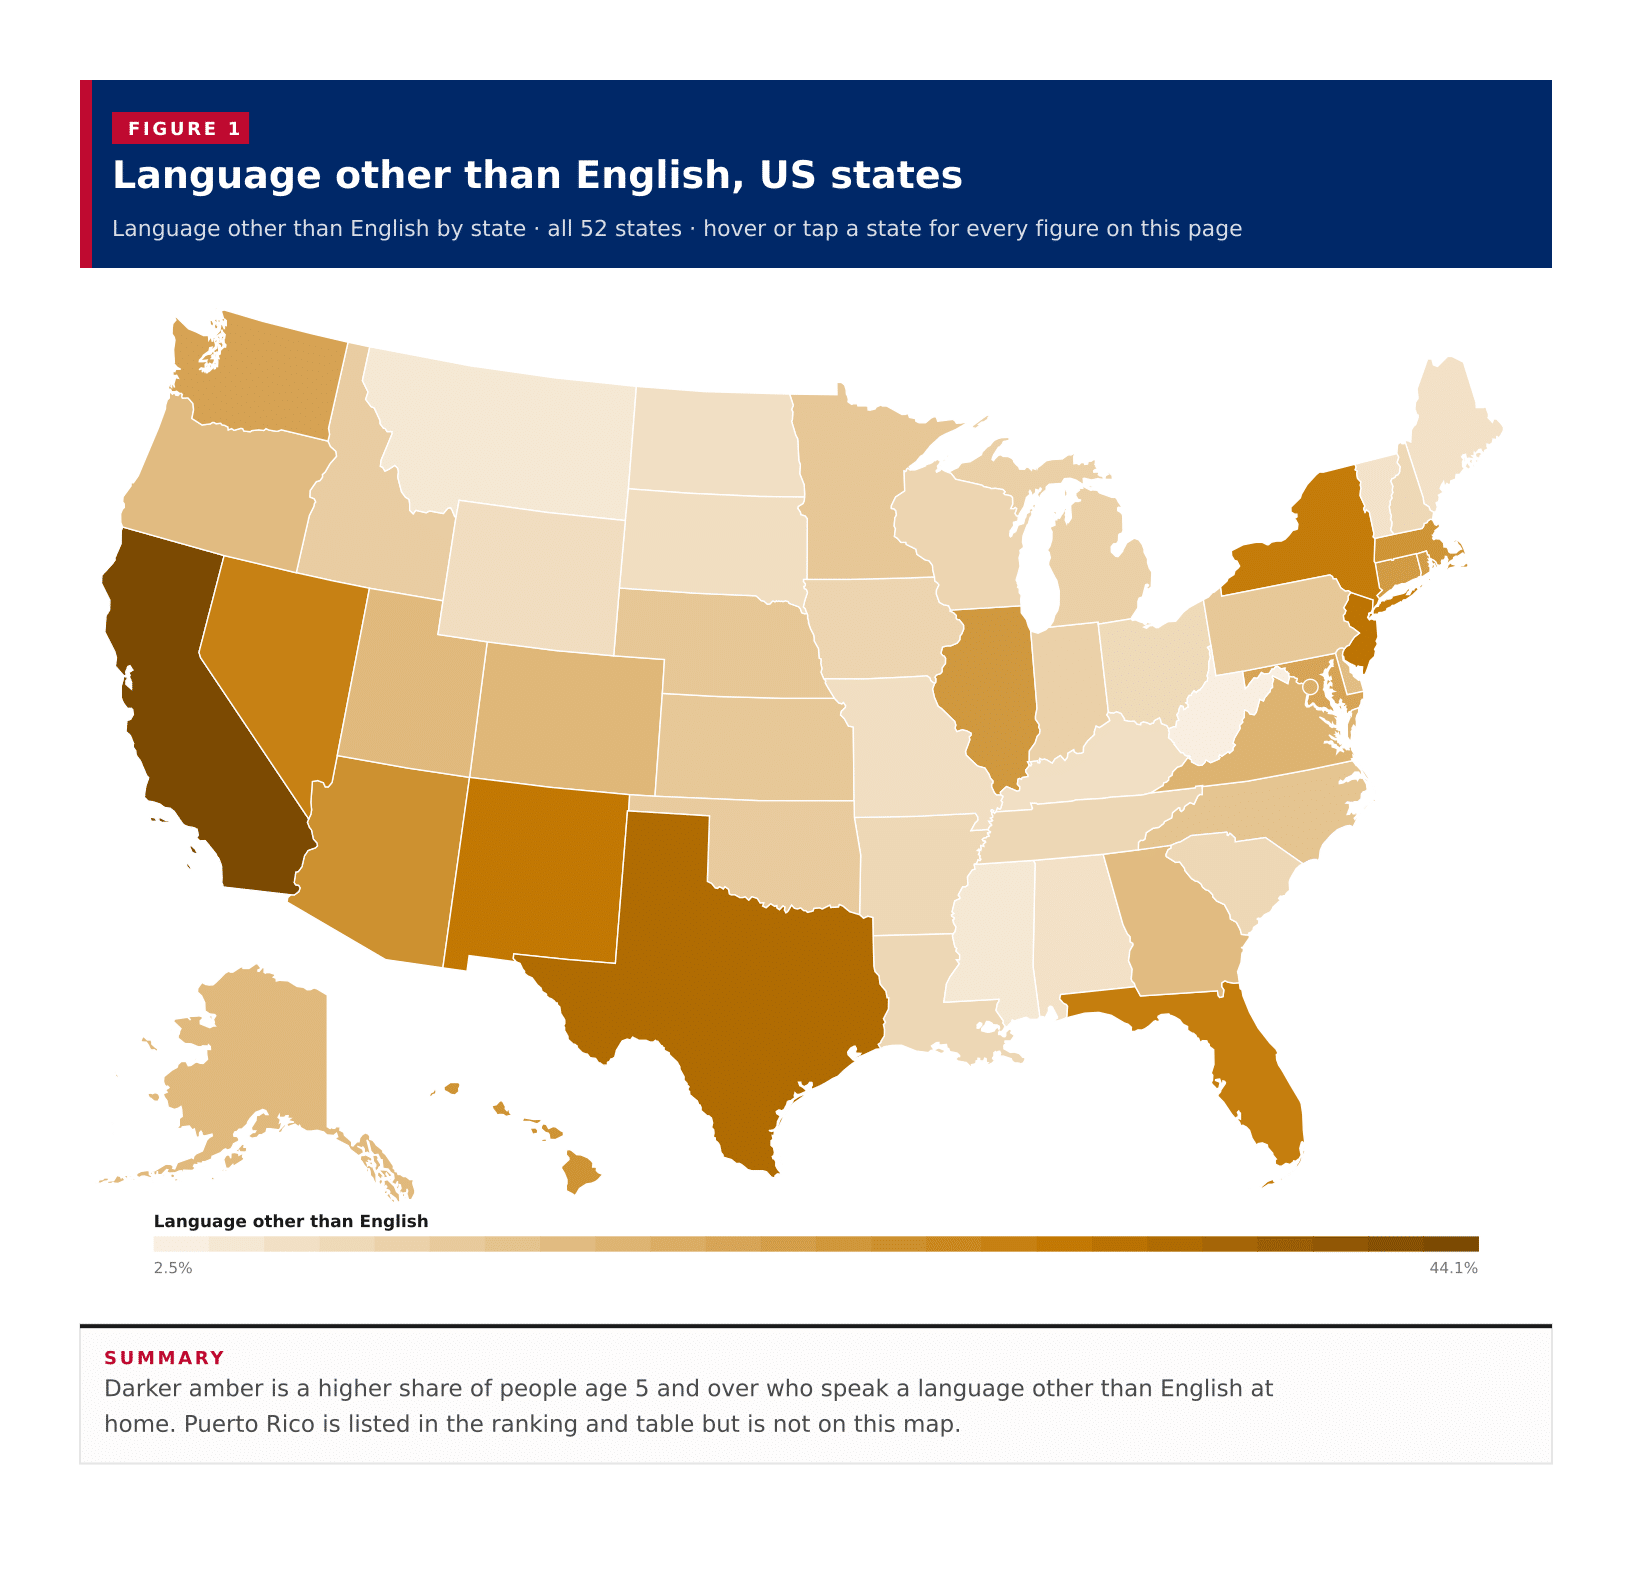
Figure 1: Language other than English, US states
DownloadPDFImageCSV

Figure 2

Language other than English, all published states

Figure 2: Language other than English, all published states
DownloadPDFImageCSV

Figure 3

Spanish spoken at home, all published states

Figure 3: Spanish spoken at home, all published states
DownloadPDFImageCSV

Figure 4

Spanish against other non-English languages

Figure 4: Spanish against other non-English languages
DownloadPDFImageCSV

About this data

  • The universe is people age 5 years and over. Language is what is spoken at home, not ancestry or ability to speak English.
  • Shares are each area's own residents. They cannot be averaged across states to produce a United States figure, because states differ in size.
  • The Census published 50 states, the District of Columbia and Puerto Rico. None of the language-group estimates used here were suppressed.
  • C16001 is the collapsed language table. It groups languages into published categories such as Spanish, Chinese, Tagalog and other Indo-European languages rather than listing every language separately.
  • Puerto Rico is listed in the ranking and table. On the map, Alaska and Hawaii appear as insets; Puerto Rico is not drawn on this US state map.
  • A 90 percent margin of error is shown for the population 5 years and over and for the Spanish count. Computed shares do not carry a published margin.