Households with children by US state

Summary

Share of households with children under 18, US states

Share with children under 18 by state · all 52 states · hover or tap a state for every figure on this page

52 items
View100%
DownloadPDFImageCSV
StatesUtah
Share of households with children under 18, US statesDarker amber is a higher share of households with one or more people under 18. Puerto Rico is listed in the ranking and table but is not on this map.Alabama · Share with children under 18: 29.1% · Households with children: 572,509 · With children (margin of error): 5,794 · Total households: 1,969,105 · Total households (margin of error): 6,574 · Households with no children: 1,396,596 · No children (margin of error): 5,081 · Family households with children: 568,207 · Married-couple with children: 352,670Alaska · Share with children under 18: 31.9% · Households with children: 85,391 · With children (margin of error): 1,613 · Total households: 267,865 · Total households (margin of error): 1,441 · Households with no children: 182,474 · No children (margin of error): 1,833 · Family households with children: 84,678 · Married-couple with children: 57,733Arizona · Share with children under 18: 29.3% · Households with children: 820,480 · With children (margin of error): 5,891 · Total households: 2,796,790 · Total households (margin of error): 6,018 · Households with no children: 1,976,310 · No children (margin of error): 5,735 · Family households with children: 811,642 · Married-couple with children: 515,065Arkansas · Share with children under 18: 30.9% · Households with children: 367,640 · With children (margin of error): 4,165 · Total households: 1,189,160 · Total households (margin of error): 4,619 · Households with no children: 821,520 · No children (margin of error): 4,302 · Family households with children: 363,741 · Married-couple with children: 231,062California · Share with children under 18: 32.9% · Households with children: 4,418,376 · With children (margin of error): 21,132 · Total households: 13,434,847 · Total households (margin of error): 19,805 · Households with no children: 9,016,471 · No children (margin of error): 11,524 · Family households with children: 4,384,028 · Married-couple with children: 2,983,999Colorado · Share with children under 18: 28.9% · Households with children: 672,594 · With children (margin of error): 5,178 · Total households: 2,325,576 · Total households (margin of error): 4,759 · Households with no children: 1,652,982 · No children (margin of error): 4,952 · Family households with children: 667,599 · Married-couple with children: 477,723Connecticut · Share with children under 18: 28.7% · Households with children: 407,848 · With children (margin of error): 4,161 · Total households: 1,420,170 · Total households (margin of error): 3,490 · Households with no children: 1,012,322 · No children (margin of error): 4,360 · Family households with children: 404,355 · Married-couple with children: 266,923Delaware · Share with children under 18: 27.5% · Households with children: 108,860 · With children (margin of error): 1,959 · Total households: 396,209 · Total households (margin of error): 1,648 · Households with no children: 287,349 · No children (margin of error): 2,266 · Family households with children: 108,136 · Married-couple with children: 65,482Florida · Share with children under 18: 26.5% · Households with children: 2,269,215 · With children (margin of error): 17,912 · Total households: 8,550,911 · Total households (margin of error): 21,145 · Households with no children: 6,281,696 · No children (margin of error): 13,869 · Family households with children: 2,248,225 · Married-couple with children: 1,407,164Georgia · Share with children under 18: 32.1% · Households with children: 1,285,547 · With children (margin of error): 10,917 · Total households: 4,008,013 · Total households (margin of error): 9,372 · Households with no children: 2,722,466 · No children (margin of error): 9,444 · Family households with children: 1,274,490 · Married-couple with children: 795,339Hawaii · Share with children under 18: 30.6% · Households with children: 149,627 · With children (margin of error): 2,150 · Total households: 488,991 · Total households (margin of error): 1,924 · Households with no children: 339,364 · No children (margin of error): 2,521 · Family households with children: 148,474 · Married-couple with children: 100,987Idaho · Share with children under 18: 32.1% · Households with children: 222,713 · With children (margin of error): 2,703 · Total households: 693,821 · Total households (margin of error): 2,298 · Households with no children: 471,108 · No children (margin of error): 3,190 · Family households with children: 221,060 · Married-couple with children: 162,555Illinois · Share with children under 18: 29.1% · Households with children: 1,453,064 · With children (margin of error): 8,401 · Total households: 5,001,904 · Total households (margin of error): 7,673 · Households with no children: 3,548,840 · No children (margin of error): 8,116 · Family households with children: 1,439,809 · Married-couple with children: 953,421Indiana · Share with children under 18: 30.1% · Households with children: 807,357 · With children (margin of error): 5,881 · Total households: 2,681,537 · Total households (margin of error): 6,532 · Households with no children: 1,874,180 · No children (margin of error): 5,712 · Family households with children: 797,927 · Married-couple with children: 520,493Iowa · Share with children under 18: 28.6% · Households with children: 373,466 · With children (margin of error): 3,178 · Total households: 1,303,763 · Total households (margin of error): 3,538 · Households with no children: 930,297 · No children (margin of error): 3,247 · Family households with children: 369,660 · Married-couple with children: 253,133Kansas · Share with children under 18: 30.5% · Households with children: 353,703 · With children (margin of error): 3,272 · Total households: 1,160,715 · Total households (margin of error): 3,961 · Households with no children: 807,012 · No children (margin of error): 3,733 · Family households with children: 350,538 · Married-couple with children: 241,217Kentucky · Share with children under 18: 30.2% · Households with children: 540,445 · With children (margin of error): 4,532 · Total households: 1,791,991 · Total households (margin of error): 5,353 · Households with no children: 1,251,546 · No children (margin of error): 4,955 · Family households with children: 534,585 · Married-couple with children: 341,017Louisiana · Share with children under 18: 30.7% · Households with children: 547,288 · With children (margin of error): 5,003 · Total households: 1,783,168 · Total households (margin of error): 5,717 · Households with no children: 1,235,880 · No children (margin of error): 5,120 · Family households with children: 543,298 · Married-couple with children: 307,072Maine · Share with children under 18: 24.0% · Households with children: 141,557 · With children (margin of error): 2,009 · Total households: 589,085 · Total households (margin of error): 2,383 · Households with no children: 447,528 · No children (margin of error): 2,419 · Family households with children: 139,655 · Married-couple with children: 94,483Maryland · Share with children under 18: 31.0% · Households with children: 725,244 · With children (margin of error): 5,373 · Total households: 2,339,510 · Total households (margin of error): 4,595 · Households with no children: 1,614,266 · No children (margin of error): 5,144 · Family households with children: 718,801 · Married-couple with children: 469,014Massachusetts · Share with children under 18: 28.2% · Households with children: 778,542 · With children (margin of error): 4,848 · Total households: 2,762,070 · Total households (margin of error): 5,223 · Households with no children: 1,983,528 · No children (margin of error): 5,801 · Family households with children: 773,129 · Married-couple with children: 524,670Michigan · Share with children under 18: 27.4% · Households with children: 1,105,841 · With children (margin of error): 6,940 · Total households: 4,040,168 · Total households (margin of error): 8,515 · Households with no children: 2,934,327 · No children (margin of error): 6,877 · Family households with children: 1,095,267 · Married-couple with children: 708,285Minnesota · Share with children under 18: 29.1% · Households with children: 664,943 · With children (margin of error): 4,515 · Total households: 2,282,967 · Total households (margin of error): 5,281 · Households with no children: 1,618,024 · No children (margin of error): 4,794 · Family households with children: 658,763 · Married-couple with children: 461,878Mississippi · Share with children under 18: 31.4% · Households with children: 355,673 · With children (margin of error): 5,124 · Total households: 1,131,760 · Total households (margin of error): 5,057 · Households with no children: 776,087 · No children (margin of error): 4,287 · Family households with children: 352,334 · Married-couple with children: 200,768Missouri · Share with children under 18: 28.7% · Households with children: 714,244 · With children (margin of error): 5,405 · Total households: 2,484,834 · Total households (margin of error): 6,166 · Households with no children: 1,770,590 · No children (margin of error): 5,433 · Family households with children: 705,344 · Married-couple with children: 463,095Montana · Share with children under 18: 25.7% · Households with children: 116,504 · With children (margin of error): 1,837 · Total households: 452,683 · Total households (margin of error): 1,926 · Households with no children: 336,179 · No children (margin of error): 2,336 · Family households with children: 115,322 · Married-couple with children: 79,708Nebraska · Share with children under 18: 30.4% · Households with children: 239,535 · With children (margin of error): 2,174 · Total households: 786,885 · Total households (margin of error): 2,232 · Households with no children: 547,350 · No children (margin of error): 2,577 · Family households with children: 237,075 · Married-couple with children: 164,803Nevada · Share with children under 18: 29.7% · Households with children: 352,039 · With children (margin of error): 4,136 · Total households: 1,183,393 · Total households (margin of error): 3,022 · Households with no children: 831,354 · No children (margin of error): 4,046 · Family households with children: 348,301 · Married-couple with children: 211,032New Hampshire · Share with children under 18: 26.4% · Households with children: 145,513 · With children (margin of error): 2,184 · Total households: 551,186 · Total households (margin of error): 2,292 · Households with no children: 405,673 · No children (margin of error): 2,809 · Family households with children: 143,813 · Married-couple with children: 102,074New Jersey · Share with children under 18: 31.4% · Households with children: 1,093,381 · With children (margin of error): 6,433 · Total households: 3,478,355 · Total households (margin of error): 4,714 · Households with no children: 2,384,974 · No children (margin of error): 6,439 · Family households with children: 1,086,820 · Married-couple with children: 760,478New Mexico · Share with children under 18: 28.1% · Households with children: 231,791 · With children (margin of error): 3,498 · Total households: 825,021 · Total households (margin of error): 3,033 · Households with no children: 593,230 · No children (margin of error): 3,745 · Family households with children: 230,159 · Married-couple with children: 127,426New York · Share with children under 18: 27.8% · Households with children: 2,130,918 · With children (margin of error): 11,775 · Total households: 7,668,956 · Total households (margin of error): 12,766 · Households with no children: 5,538,038 · No children (margin of error): 10,539 · Family households with children: 2,114,156 · Married-couple with children: 1,357,854North Carolina · Share with children under 18: 29.4% · Households with children: 1,232,974 · With children (margin of error): 9,797 · Total households: 4,186,924 · Total households (margin of error): 10,494 · Households with no children: 2,953,950 · No children (margin of error): 7,396 · Family households with children: 1,222,090 · Married-couple with children: 787,117North Dakota · Share with children under 18: 27.5% · Households with children: 89,555 · With children (margin of error): 1,634 · Total households: 325,079 · Total households (margin of error): 1,663 · Households with no children: 235,524 · No children (margin of error): 2,263 · Family households with children: 88,944 · Married-couple with children: 63,438Ohio · Share with children under 18: 28.3% · Households with children: 1,364,656 · With children (margin of error): 7,583 · Total households: 4,829,571 · Total households (margin of error): 8,204 · Households with no children: 3,464,915 · No children (margin of error): 7,304 · Family households with children: 1,349,681 · Married-couple with children: 844,154Oklahoma · Share with children under 18: 31.6% · Households with children: 486,983 · With children (margin of error): 3,272 · Total households: 1,542,780 · Total households (margin of error): 3,468 · Households with no children: 1,055,797 · No children (margin of error): 3,388 · Family households with children: 482,158 · Married-couple with children: 310,959Oregon · Share with children under 18: 27.6% · Households with children: 468,986 · With children (margin of error): 4,495 · Total households: 1,701,548 · Total households (margin of error): 3,556 · Households with no children: 1,232,562 · No children (margin of error): 4,830 · Family households with children: 464,006 · Married-couple with children: 310,874Pennsylvania · Share with children under 18: 27.3% · Households with children: 1,428,576 · With children (margin of error): 8,350 · Total households: 5,235,339 · Total households (margin of error): 9,438 · Households with no children: 3,806,763 · No children (margin of error): 7,794 · Family households with children: 1,416,072 · Married-couple with children: 917,990Rhode Island · Share with children under 18: 27.0% · Households with children: 117,976 · With children (margin of error): 1,975 · Total households: 436,902 · Total households (margin of error): 1,822 · Households with no children: 318,926 · No children (margin of error): 2,517 · Family households with children: 116,883 · Married-couple with children: 73,407South Carolina · Share with children under 18: 28.6% · Households with children: 592,611 · With children (margin of error): 6,019 · Total households: 2,070,390 · Total households (margin of error): 5,976 · Households with no children: 1,477,779 · No children (margin of error): 5,762 · Family households with children: 586,279 · Married-couple with children: 363,830South Dakota · Share with children under 18: 29.1% · Households with children: 104,416 · With children (margin of error): 1,577 · Total households: 358,552 · Total households (margin of error): 1,643 · Households with no children: 254,136 · No children (margin of error): 2,093 · Family households with children: 103,197 · Married-couple with children: 70,984Tennessee · Share with children under 18: 29.6% · Households with children: 818,373 · With children (margin of error): 7,236 · Total households: 2,768,743 · Total households (margin of error): 7,134 · Households with no children: 1,950,370 · No children (margin of error): 6,891 · Family households with children: 809,709 · Married-couple with children: 516,143Texas · Share with children under 18: 35.1% · Households with children: 3,773,746 · With children (margin of error): 19,921 · Total households: 10,747,240 · Total households (margin of error): 15,647 · Households with no children: 6,973,494 · No children (margin of error): 13,891 · Family households with children: 3,750,343 · Married-couple with children: 2,508,943Utah · Share with children under 18: 38.6% · Households with children: 422,506 · With children (margin of error): 2,924 · Total households: 1,094,896 · Total households (margin of error): 2,787 · Households with no children: 672,390 · No children (margin of error): 3,483 · Family households with children: 420,141 · Married-couple with children: 330,862Vermont · Share with children under 18: 23.7% · Households with children: 63,966 · With children (margin of error): 1,151 · Total households: 269,466 · Total households (margin of error): 1,559 · Households with no children: 205,500 · No children (margin of error): 1,720 · Family households with children: 63,519 · Married-couple with children: 42,386Virginia · Share with children under 18: 30.6% · Households with children: 1,016,683 · With children (margin of error): 7,206 · Total households: 3,326,260 · Total households (margin of error): 8,075 · Households with no children: 2,309,577 · No children (margin of error): 6,360 · Family households with children: 1,007,979 · Married-couple with children: 692,805Washington · Share with children under 18: 29.8% · Households with children: 899,385 · With children (margin of error): 6,701 · Total households: 3,020,558 · Total households (margin of error): 5,770 · Households with no children: 2,121,173 · No children (margin of error): 6,577 · Family households with children: 889,397 · Married-couple with children: 625,772West Virginia · Share with children under 18: 26.3% · Households with children: 189,606 · With children (margin of error): 2,746 · Total households: 721,448 · Total households (margin of error): 2,890 · Households with no children: 531,842 · No children (margin of error): 2,669 · Family households with children: 187,836 · Married-couple with children: 121,421Wisconsin · Share with children under 18: 26.6% · Households with children: 650,296 · With children (margin of error): 4,662 · Total households: 2,446,028 · Total households (margin of error): 5,477 · Households with no children: 1,795,732 · No children (margin of error): 5,025 · Family households with children: 643,559 · Married-couple with children: 426,926Wyoming · Share with children under 18: 28.5% · Households with children: 67,764 · With children (margin of error): 1,390 · Total households: 238,176 · Total households (margin of error): 1,220 · Households with no children: 170,412 · No children (margin of error): 1,495 · Family households with children: 67,198 · Married-couple with children: 47,945District of Columbia · Share with children under 18: 20.0% · Households with children: 64,200 · With children (margin of error): 2,168 · Total households: 321,556 · Total households (margin of error): 1,499 · Households with no children: 257,356 · No children (margin of error): 2,245 · Family households with children: 63,835 · Married-couple with children: 32,723District of Columbia · Share with children under 18: 20.0% · Households with children: 64,200 · With children (margin of error): 2,168 · Total households: 321,556 · Total households (margin of error): 1,499 · Households with no children: 257,356 · No children (margin of error): 2,245 · Family households with children: 63,835 · Married-couple with children: 32,723Share with children under 1820.0%38.6%
Summary

Darker amber is a higher share of households with one or more people under 18. Puerto Rico is listed in the ranking and table but is not on this map.

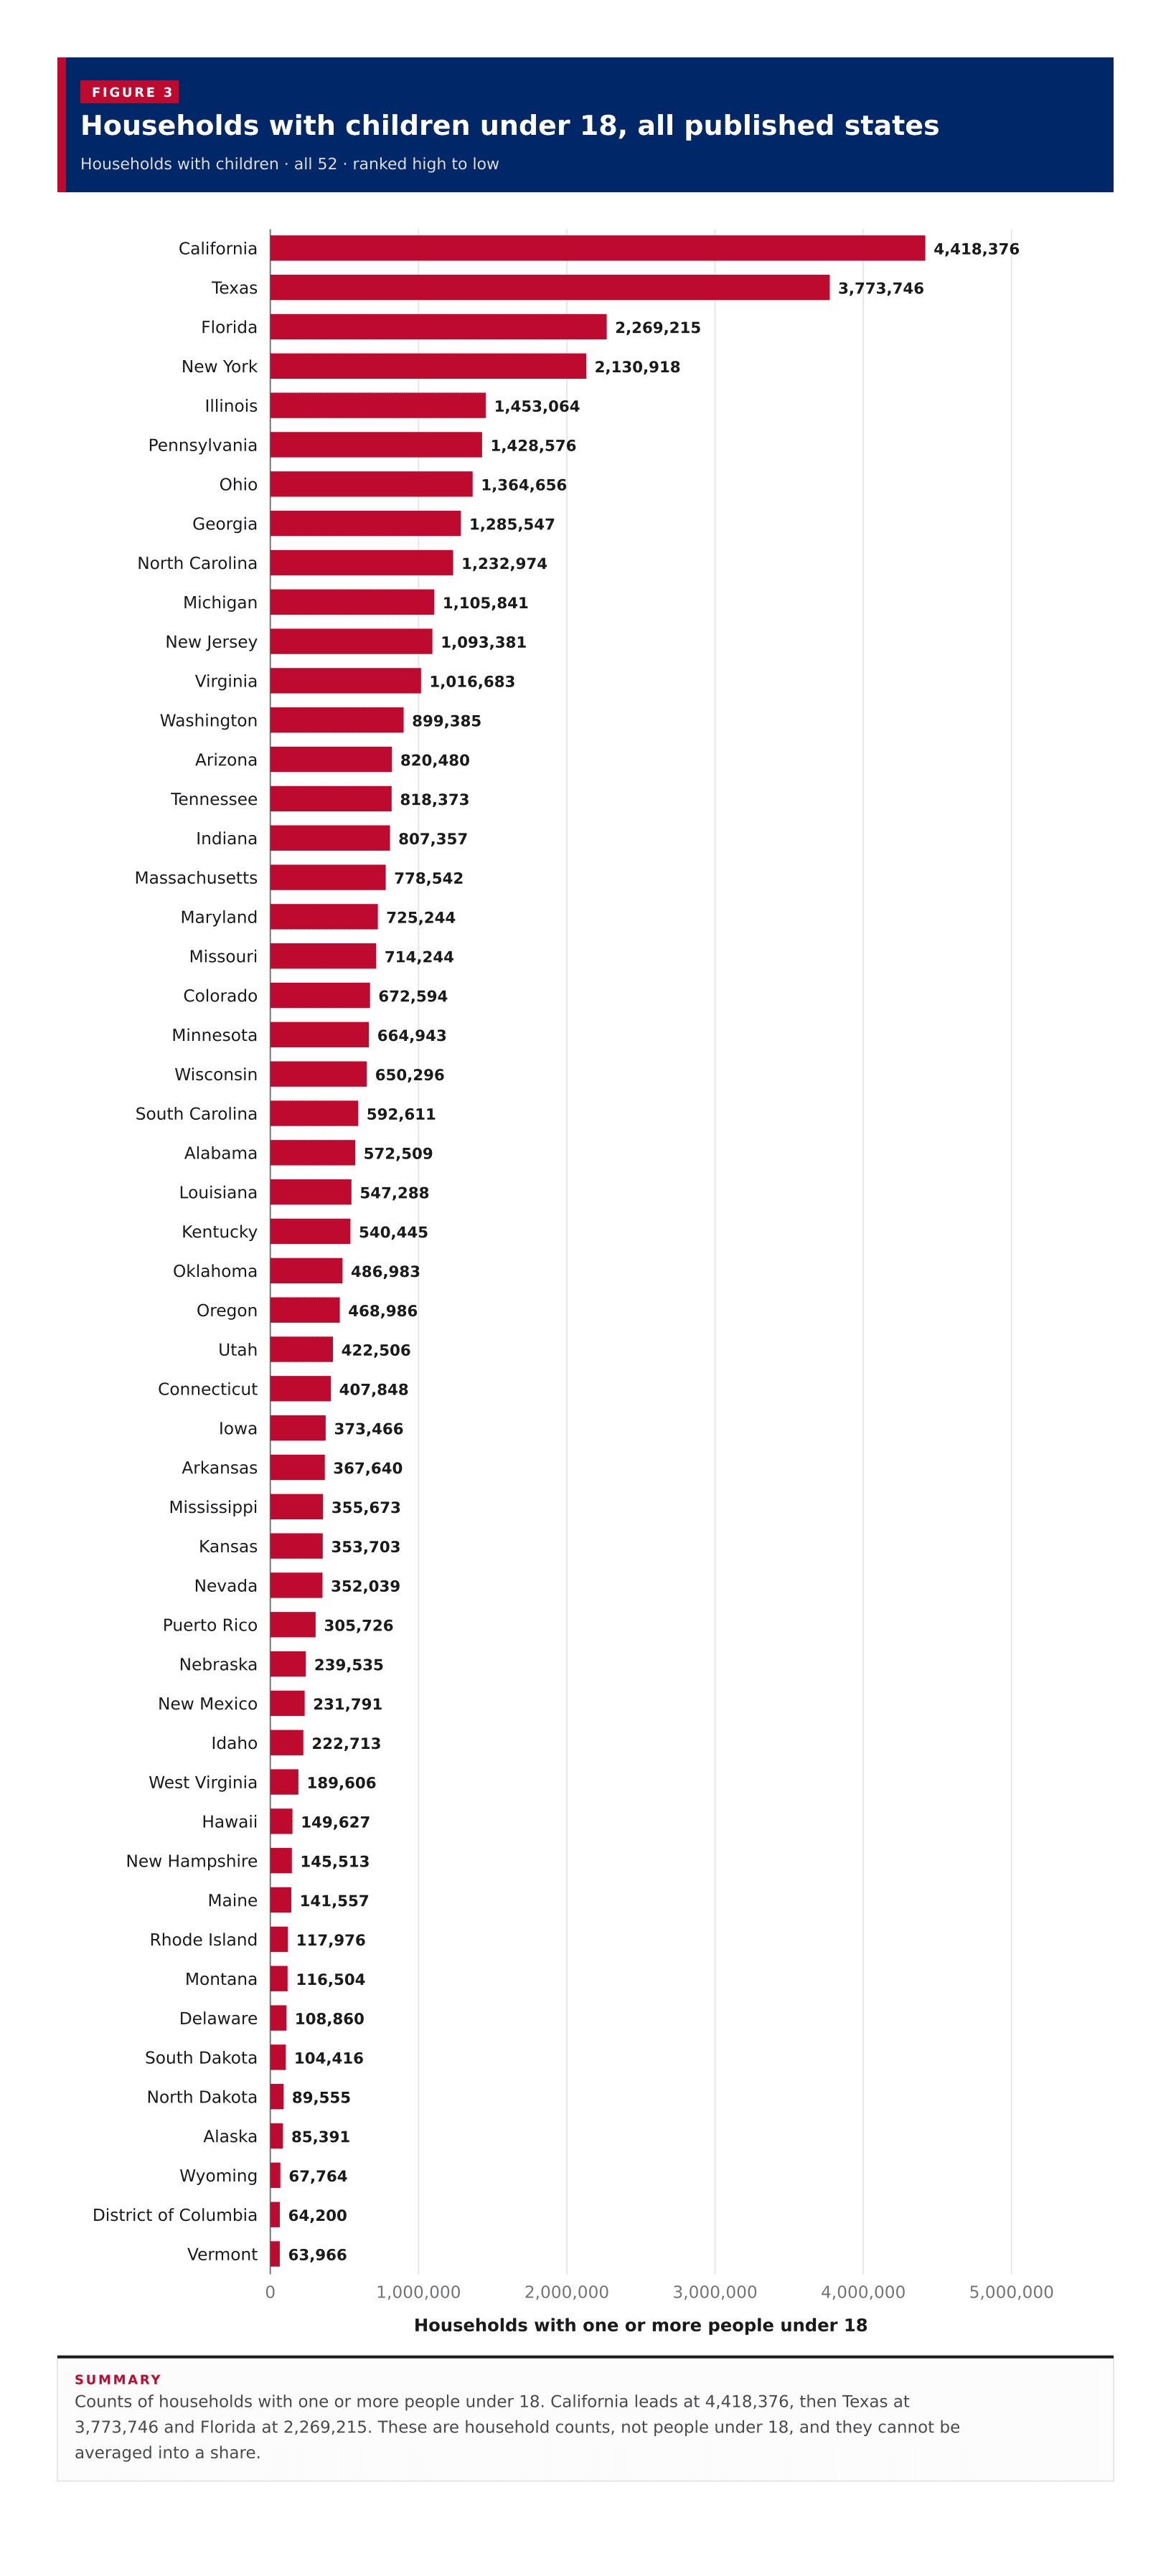
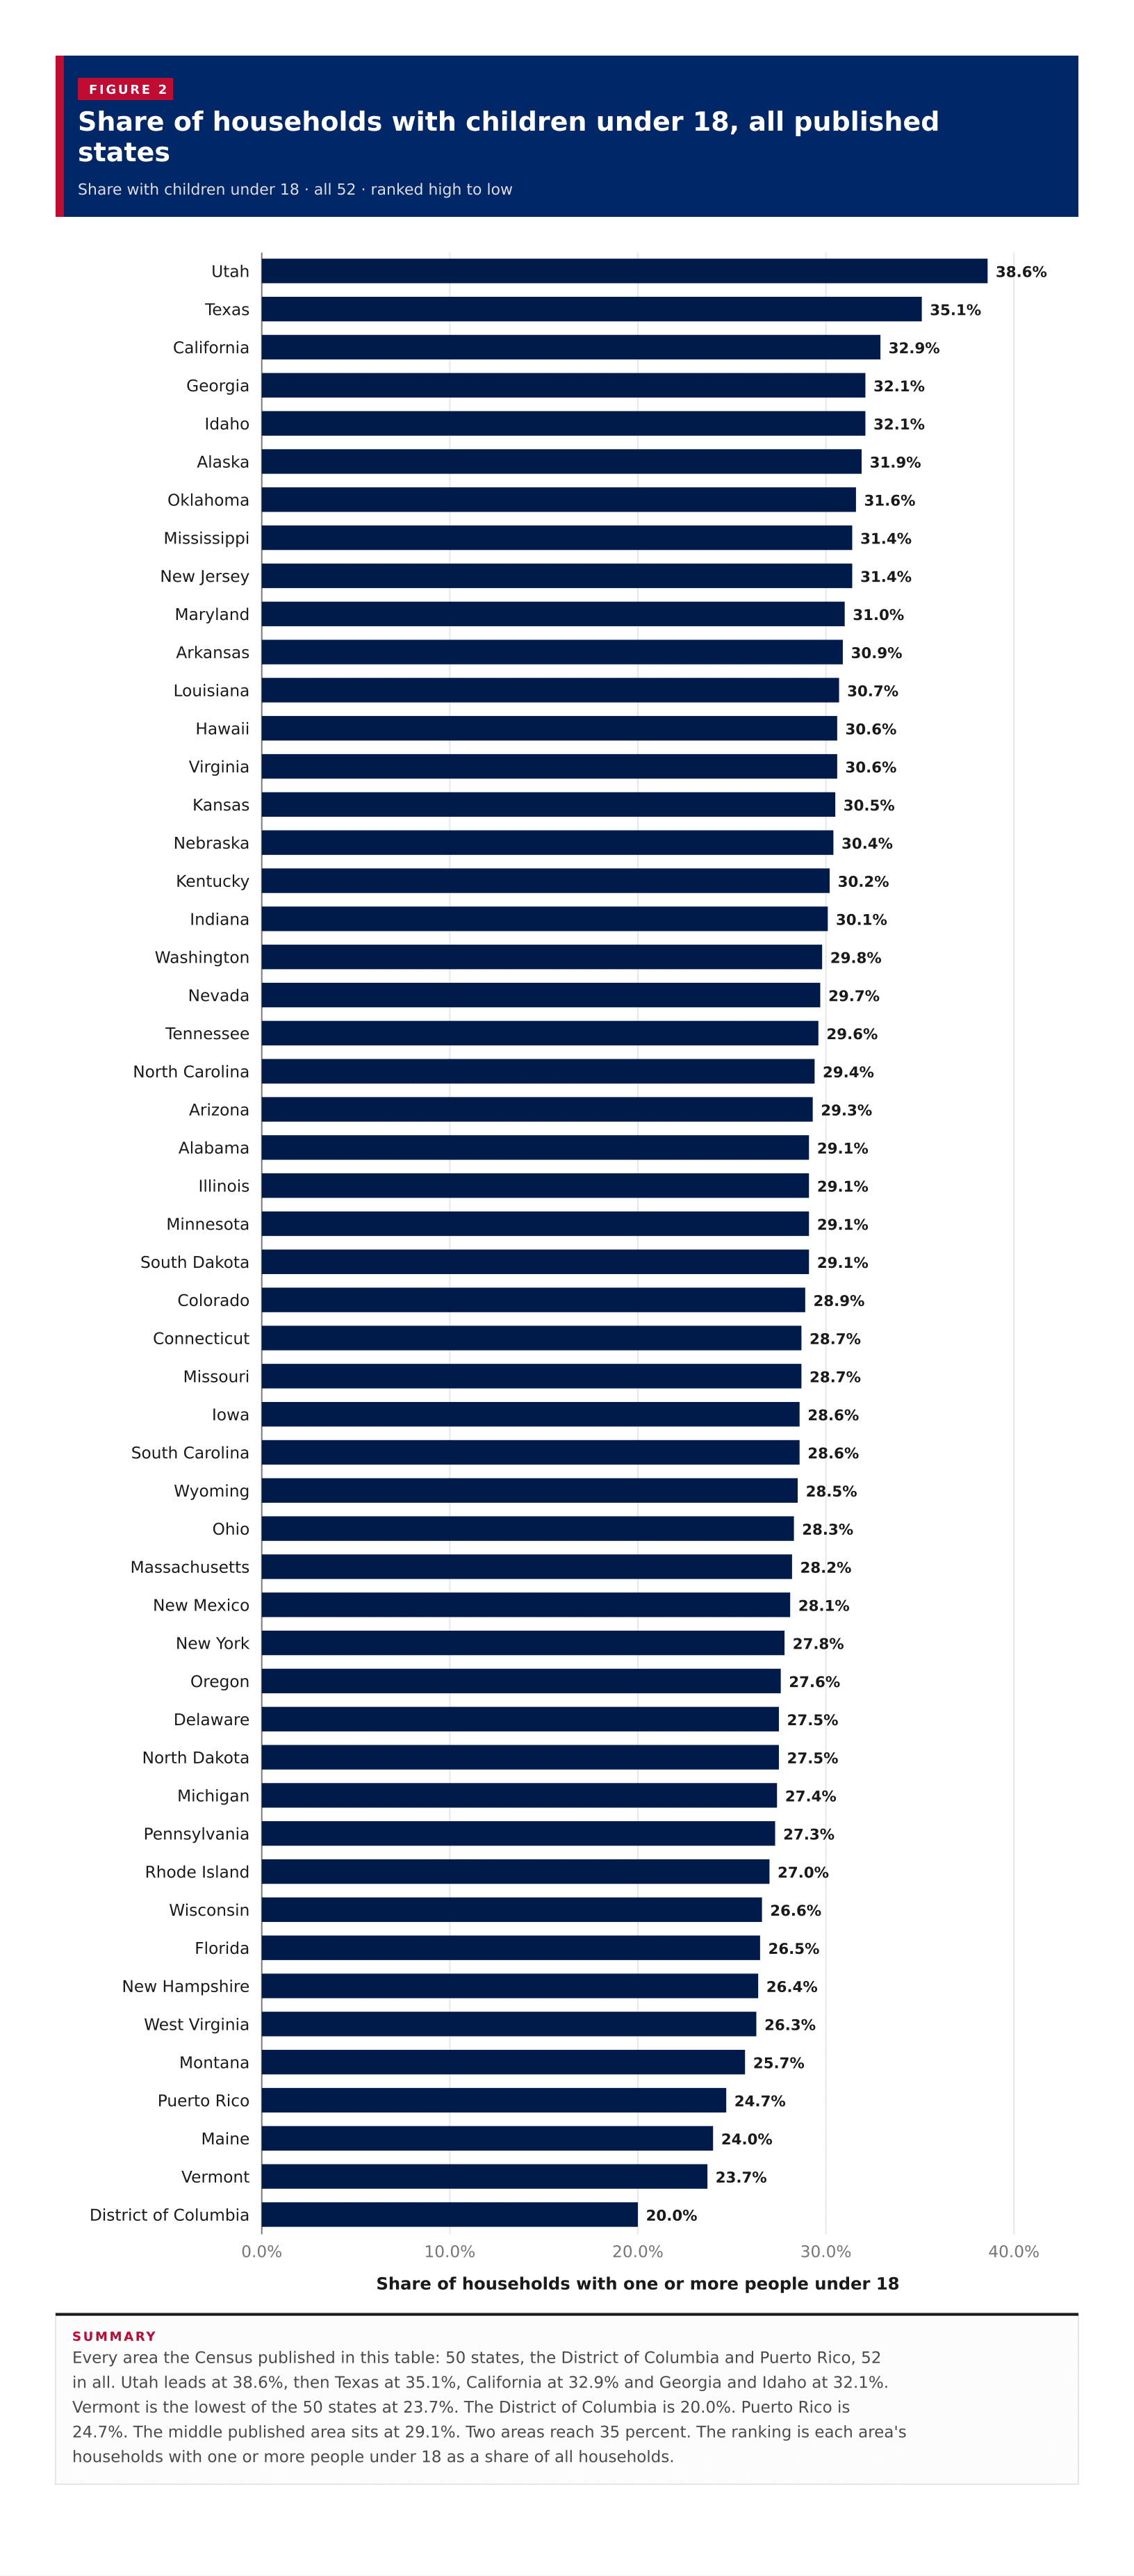
Utah has the highest share of households with one or more people under 18 among the 52 published areas on the 2023 ACS five-year estimates: 38.6%. Texas is next at 35.1%, then California at 32.9% and Georgia and Idaho both at 32.1%. A typical published area sits at 29.1%, the midpoint of those 52 shares, not a United States household rate. Vermont is the lowest of the 50 states at 23.7%. Puerto Rico is 24.7%, and the District of Columbia, which this table also returns, is 20.0%. California has the largest count of such households, 4,418,376, ahead of Texas at 3,773,746 and Florida at 2,269,215. The share is households with children divided by all households in that area.

In short

38.6%Utahhighest share with children under 18
29.1%typical published areathe middle of the 52 shares, not an average
23.7%Vermontlowest of the 50 states
20.0%District of Columbialowest figure the Census published
4,418,376Californialargest count of households with children
Figure 1

Share of households with children under 18, all published states

Share with children under 18 · all 52 · ranked high to low

52 items
View100%
DownloadPDFImageCSV
Share of households with children under 18, all published statesEvery area the Census published in this table: 50 states, the District of Columbia and Puerto Rico, 52 in all. Utah leads at 38.6%, then Texas at 35.1%, California at 32.9% and Georgia and Idaho at 32.1%. Vermont is the lowest of the 50 states at 23.7%. The District of Columbia is 20.0%. Puerto Rico is 24.7%. The middle published area sits at 29.1%. Two areas reach 35 percent. The ranking is each area's households with one or more people under 18 as a share of all households.0.0%10.0%20.0%30.0%40.0%Share of households with one or more people under 1838.6%Utah35.1%Texas32.9%California32.1%Georgia32.1%Idaho31.9%Alaska31.6%Oklahoma31.4%Mississippi31.4%New Jersey31.0%Maryland30.9%Arkansas30.7%Louisiana30.6%Hawaii30.6%Virginia30.5%Kansas30.4%Nebraska30.2%Kentucky30.1%Indiana29.8%Washington29.7%Nevada29.6%Tennessee29.4%North Carolina29.3%Arizona29.1%Alabama29.1%Illinois29.1%Minnesota29.1%South Dakota28.9%Colorado28.7%Connecticut28.7%Missouri28.6%Iowa28.6%South Carolina28.5%Wyoming28.3%Ohio28.2%Massachusetts28.1%New Mexico27.8%New York27.6%Oregon27.5%Delaware27.5%North Dakota27.4%Michigan27.3%Pennsylvania27.0%Rhode Island26.6%Wisconsin26.5%Florida26.4%New Hampshire26.3%West Virginia25.7%Montana24.7%Puerto Rico24.0%Maine23.7%Vermont20.0%District of Columbia
Summary

Every area the Census published in this table: 50 states, the District of Columbia and Puerto Rico, 52 in all. Utah leads at 38.6%, then Texas at 35.1%, California at 32.9% and Georgia and Idaho at 32.1%. Vermont is the lowest of the 50 states at 23.7%. The District of Columbia is 20.0%. Puerto Rico is 24.7%. The middle published area sits at 29.1%. Two areas reach 35 percent. The ranking is each area's households with one or more people under 18 as a share of all households.

Figure 2

Households with children under 18, all published states

Households with children · all 52 · ranked high to low

52 items
View100%
DownloadPDFImageCSV
Households with children under 18, all published statesCounts of households with one or more people under 18. California leads at 4,418,376, then Texas at 3,773,746 and Florida at 2,269,215. These are household counts, not people under 18, and they cannot be averaged into a share.01,000,0002,000,0003,000,0004,000,0005,000,000Households with one or more people under 184,418,376California3,773,746Texas2,269,215Florida2,130,918New York1,453,064Illinois1,428,576Pennsylvania1,364,656Ohio1,285,547Georgia1,232,974North Carolina1,105,841Michigan1,093,381New Jersey1,016,683Virginia899,385Washington820,480Arizona818,373Tennessee807,357Indiana778,542Massachusetts725,244Maryland714,244Missouri672,594Colorado664,943Minnesota650,296Wisconsin592,611South Carolina572,509Alabama547,288Louisiana540,445Kentucky486,983Oklahoma468,986Oregon422,506Utah407,848Connecticut373,466Iowa367,640Arkansas355,673Mississippi353,703Kansas352,039Nevada305,726Puerto Rico239,535Nebraska231,791New Mexico222,713Idaho189,606West Virginia149,627Hawaii145,513New Hampshire141,557Maine117,976Rhode Island116,504Montana108,860Delaware104,416South Dakota89,555North Dakota85,391Alaska67,764Wyoming64,200District of Columbia63,966Vermont
Summary

Counts of households with one or more people under 18. California leads at 4,418,376, then Texas at 3,773,746 and Florida at 2,269,215. These are household counts, not people under 18, and they cannot be averaged into a share.

Table 1

All states

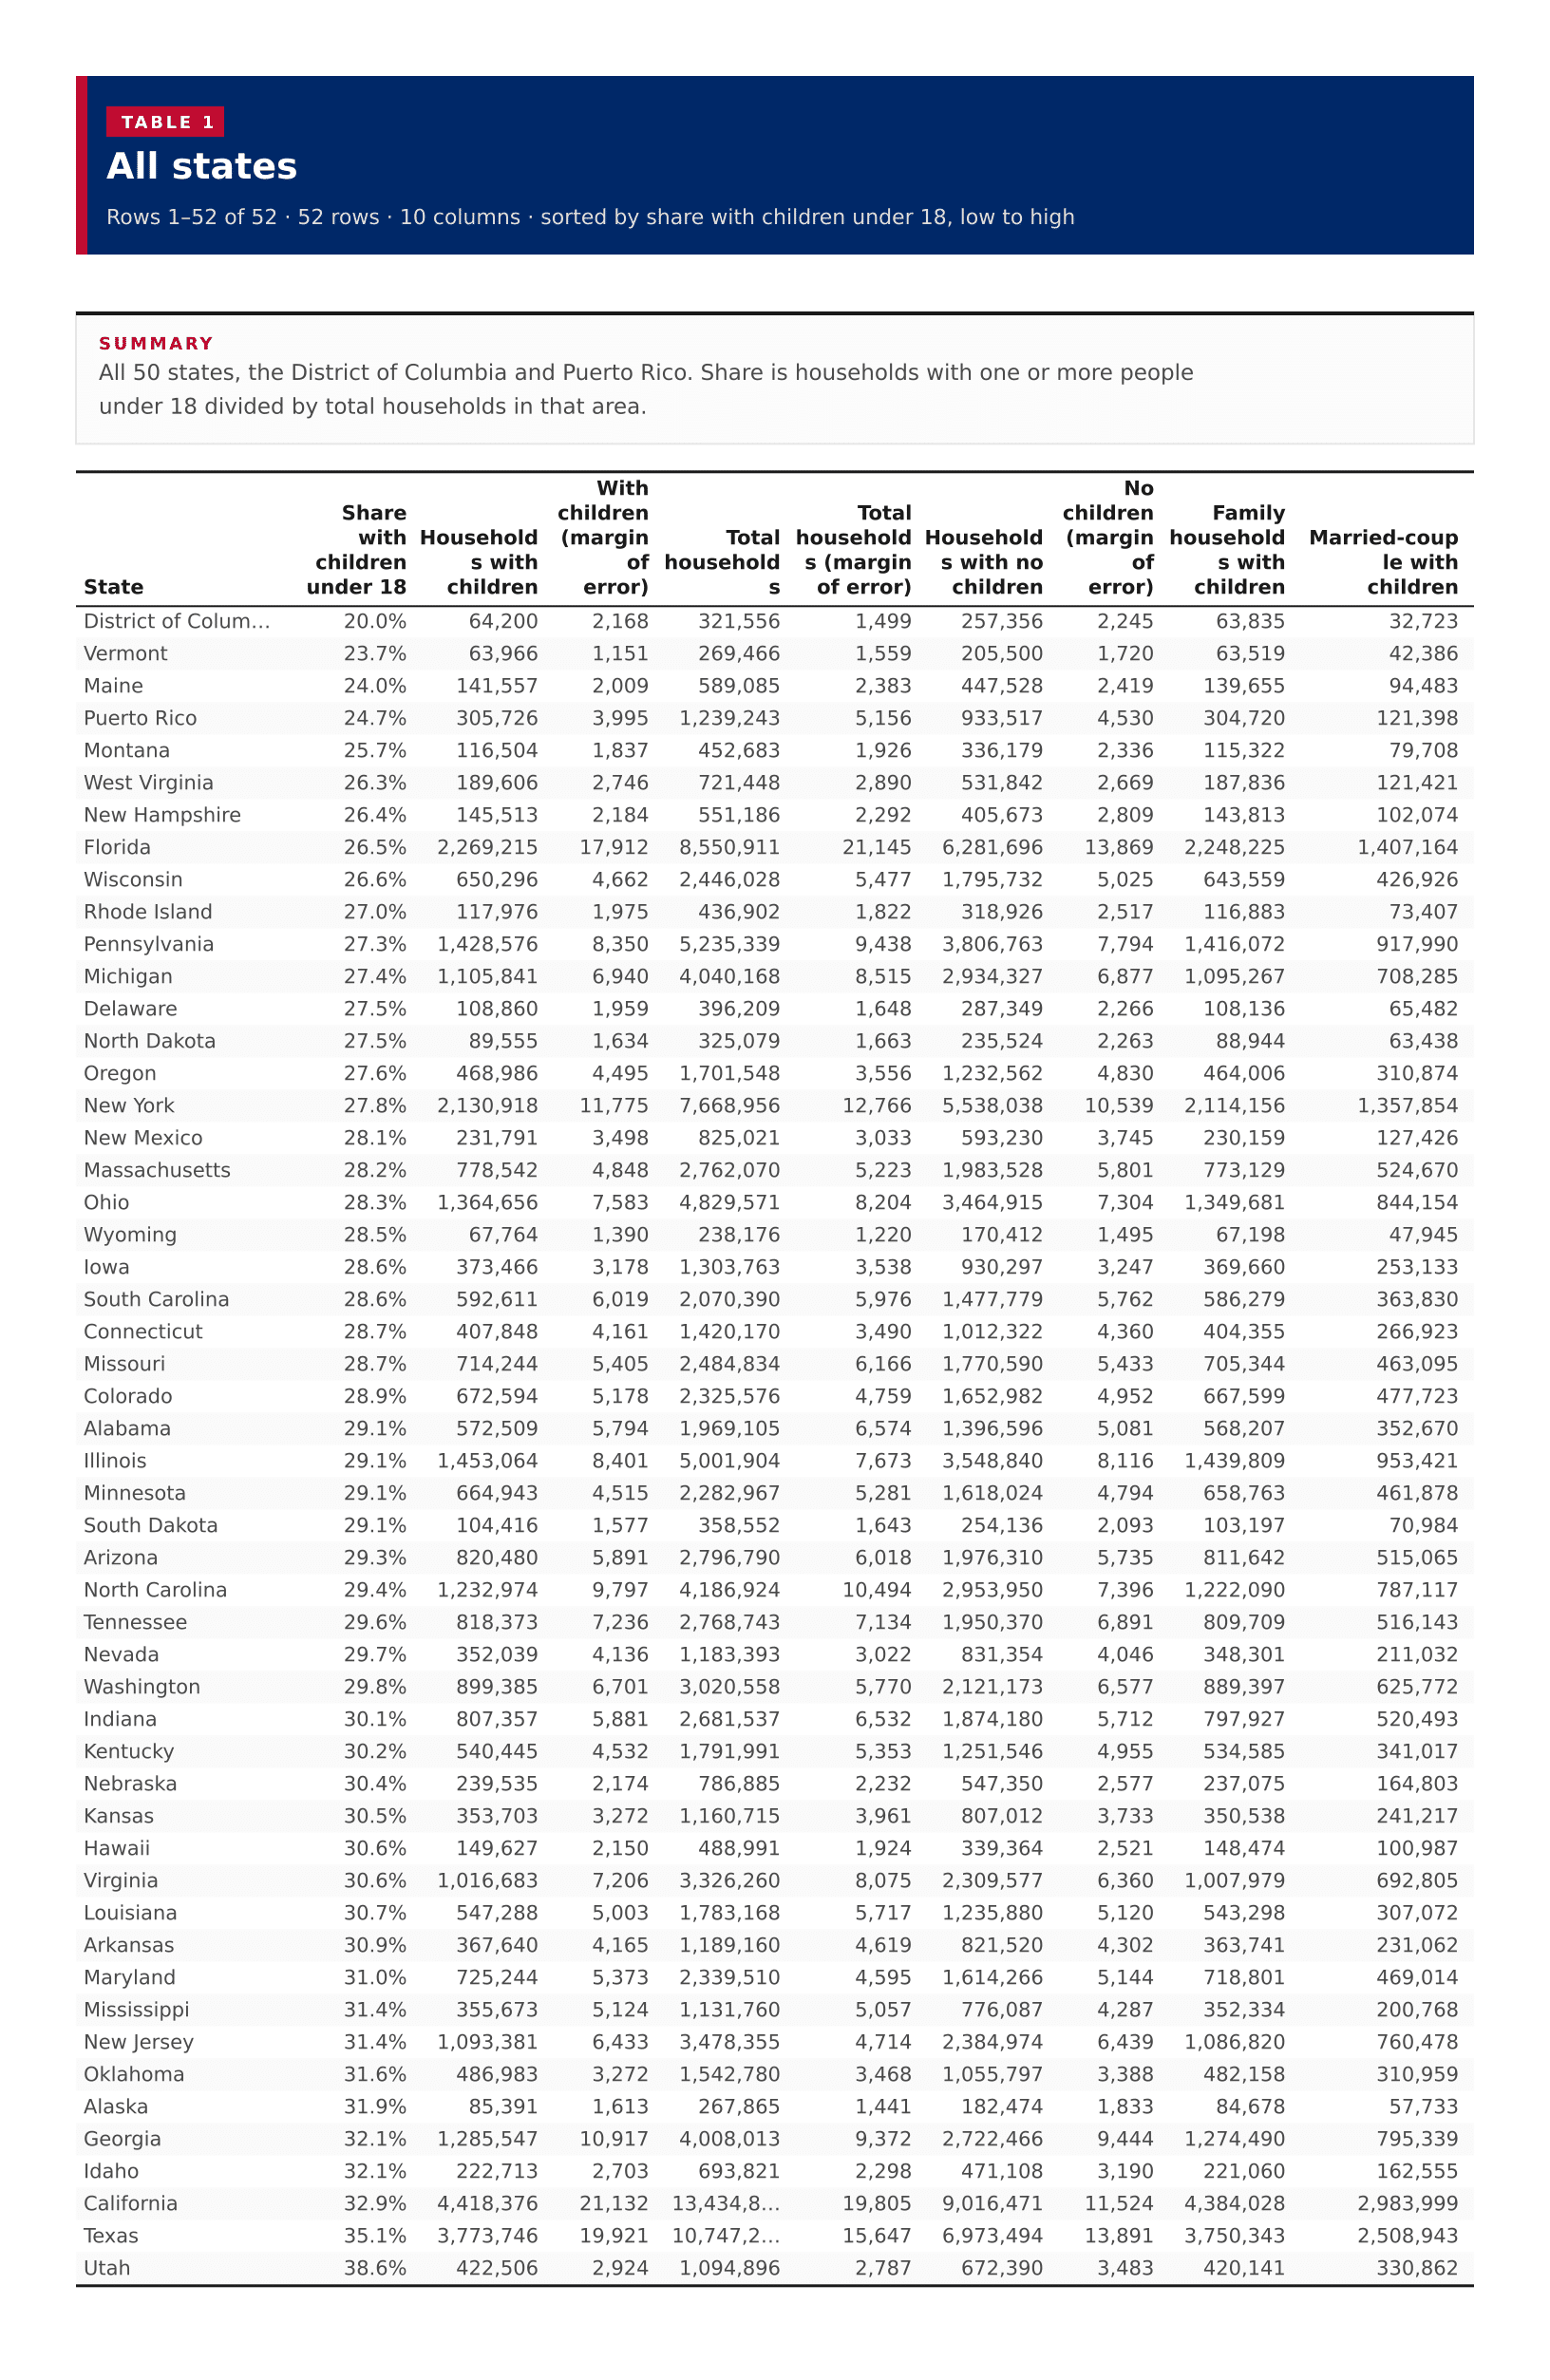
52 rows · 10 columns · sorted by share with children under 18, low to high

52 rows
View100%
DownloadPDFImageCSV
Summary

All 50 states, the District of Columbia and Puerto Rico. Share is households with one or more people under 18 divided by total households in that area.

All states
?????????
District of Columbia20.0%64,2002,168321,5561,499257,3562,24563,83532,723
Vermont23.7%63,9661,151269,4661,559205,5001,72063,51942,386
Maine24.0%141,5572,009589,0852,383447,5282,419139,65594,483
Puerto Rico24.7%305,7263,9951,239,2435,156933,5174,530304,720121,398
Montana25.7%116,5041,837452,6831,926336,1792,336115,32279,708
West Virginia26.3%189,6062,746721,4482,890531,8422,669187,836121,421
New Hampshire26.4%145,5132,184551,1862,292405,6732,809143,813102,074
Florida26.5%2,269,21517,9128,550,91121,1456,281,69613,8692,248,2251,407,164
Wisconsin26.6%650,2964,6622,446,0285,4771,795,7325,025643,559426,926
Rhode Island27.0%117,9761,975436,9021,822318,9262,517116,88373,407
Pennsylvania27.3%1,428,5768,3505,235,3399,4383,806,7637,7941,416,072917,990
Michigan27.4%1,105,8416,9404,040,1688,5152,934,3276,8771,095,267708,285
Delaware27.5%108,8601,959396,2091,648287,3492,266108,13665,482
North Dakota27.5%89,5551,634325,0791,663235,5242,26388,94463,438
Oregon27.6%468,9864,4951,701,5483,5561,232,5624,830464,006310,874
New York27.8%2,130,91811,7757,668,95612,7665,538,03810,5392,114,1561,357,854
New Mexico28.1%231,7913,498825,0213,033593,2303,745230,159127,426
Massachusetts28.2%778,5424,8482,762,0705,2231,983,5285,801773,129524,670
Ohio28.3%1,364,6567,5834,829,5718,2043,464,9157,3041,349,681844,154
Wyoming28.5%67,7641,390238,1761,220170,4121,49567,19847,945
Iowa28.6%373,4663,1781,303,7633,538930,2973,247369,660253,133
South Carolina28.6%592,6116,0192,070,3905,9761,477,7795,762586,279363,830
Connecticut28.7%407,8484,1611,420,1703,4901,012,3224,360404,355266,923
Missouri28.7%714,2445,4052,484,8346,1661,770,5905,433705,344463,095
Colorado28.9%672,5945,1782,325,5764,7591,652,9824,952667,599477,723
Alabama29.1%572,5095,7941,969,1056,5741,396,5965,081568,207352,670
Illinois29.1%1,453,0648,4015,001,9047,6733,548,8408,1161,439,809953,421
Minnesota29.1%664,9434,5152,282,9675,2811,618,0244,794658,763461,878
South Dakota29.1%104,4161,577358,5521,643254,1362,093103,19770,984
Arizona29.3%820,4805,8912,796,7906,0181,976,3105,735811,642515,065
North Carolina29.4%1,232,9749,7974,186,92410,4942,953,9507,3961,222,090787,117
Tennessee29.6%818,3737,2362,768,7437,1341,950,3706,891809,709516,143
Nevada29.7%352,0394,1361,183,3933,022831,3544,046348,301211,032
Washington29.8%899,3856,7013,020,5585,7702,121,1736,577889,397625,772
Indiana30.1%807,3575,8812,681,5376,5321,874,1805,712797,927520,493
Kentucky30.2%540,4454,5321,791,9915,3531,251,5464,955534,585341,017
Nebraska30.4%239,5352,174786,8852,232547,3502,577237,075164,803
Kansas30.5%353,7033,2721,160,7153,961807,0123,733350,538241,217
Hawaii30.6%149,6272,150488,9911,924339,3642,521148,474100,987
Virginia30.6%1,016,6837,2063,326,2608,0752,309,5776,3601,007,979692,805
Louisiana30.7%547,2885,0031,783,1685,7171,235,8805,120543,298307,072
Arkansas30.9%367,6404,1651,189,1604,619821,5204,302363,741231,062
Maryland31.0%725,2445,3732,339,5104,5951,614,2665,144718,801469,014
Mississippi31.4%355,6735,1241,131,7605,057776,0874,287352,334200,768
New Jersey31.4%1,093,3816,4333,478,3554,7142,384,9746,4391,086,820760,478
Oklahoma31.6%486,9833,2721,542,7803,4681,055,7973,388482,158310,959
Alaska31.9%85,3911,613267,8651,441182,4741,83384,67857,733
Georgia32.1%1,285,54710,9174,008,0139,3722,722,4669,4441,274,490795,339
Idaho32.1%222,7132,703693,8212,298471,1083,190221,060162,555
California32.9%4,418,37621,13213,434,84719,8059,016,47111,5244,384,0282,983,999
Texas35.1%3,773,74619,92110,747,24015,6476,973,49413,8913,750,3432,508,943
Utah38.6%422,5062,9241,094,8962,787672,3903,483420,141330,862

Image files

Download all

Figure 1

Share of households with children under 18, US states
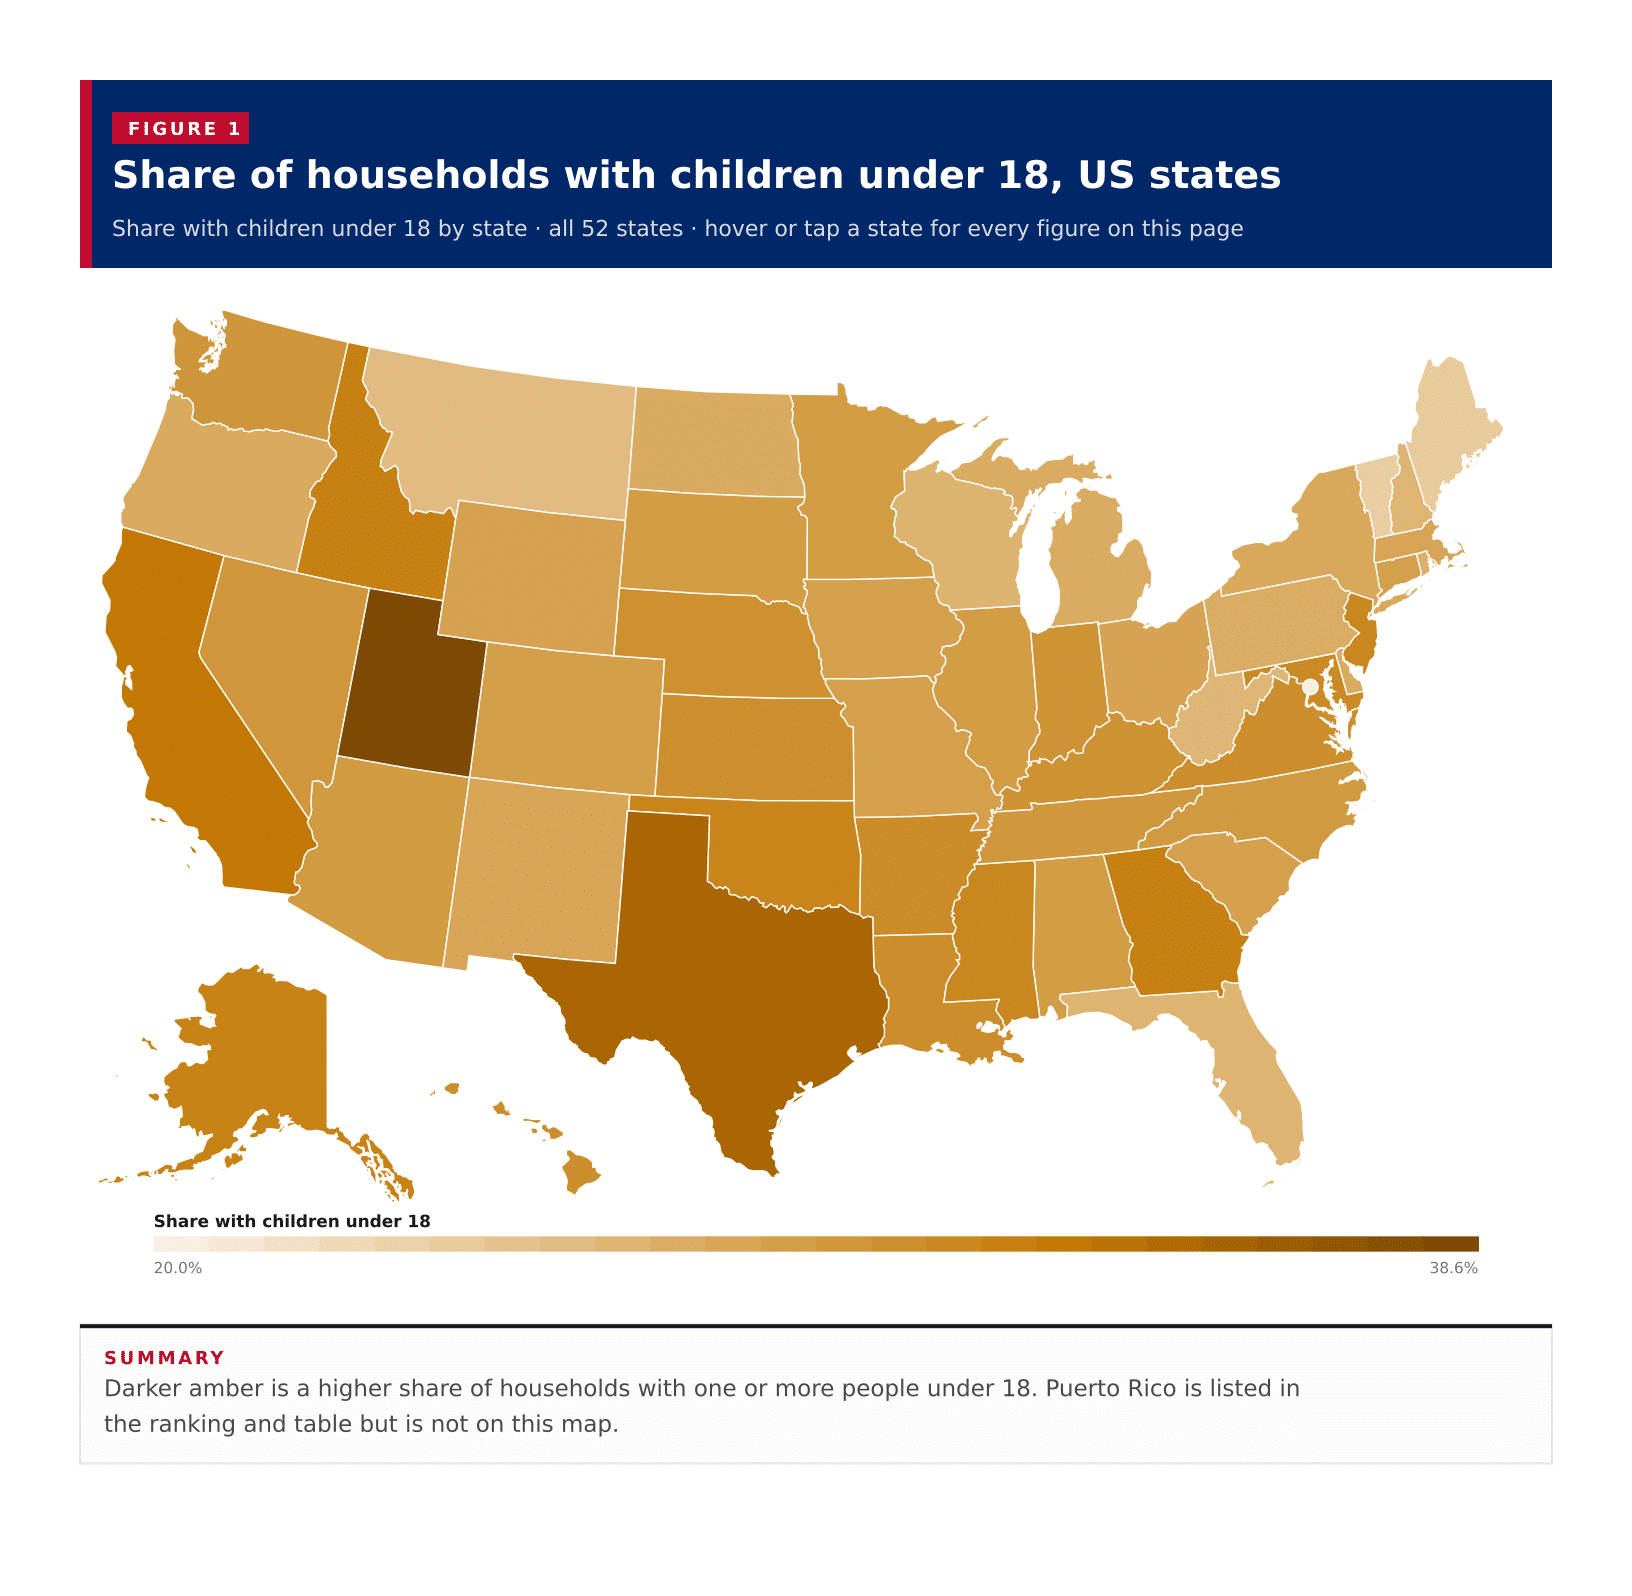
Figure 1: Share of households with children under 18, US states
DownloadPDFImageCSV

Figure 2

Share of households with children under 18, all published states

Figure 2: Share of households with children under 18, all published states
DownloadPDFImageCSV

Figure 3

Households with children under 18, all published states

Figure 3: Households with children under 18, all published states
DownloadPDFImageCSV

About this data

  • Households with children are households with one or more people under 18 years, from ACS table B11005. The person under 18 need not be the householder's own child.
  • The share is households with one or more people under 18 divided by all households in that area. A state share is for that area alone, so these percentages cannot be averaged into a United States household rate.
  • A midpoint of the 52 published shares is the middle of those area rates, not a national figure built from every US household.
  • The Census published 50 states, the District of Columbia and Puerto Rico. None of the household counts were suppressed, and the main margins of error are ordinary sampling errors rather than ACS controlled-estimate sentinels.
  • Puerto Rico is in the ranking and table. Alaska and Hawaii appear on the ranking; on the map they are shown in inset.
  • Family and married-couple columns are the ACS household-type split of households that include someone under 18.