Figure 1
Hispanic or Latino share, US states
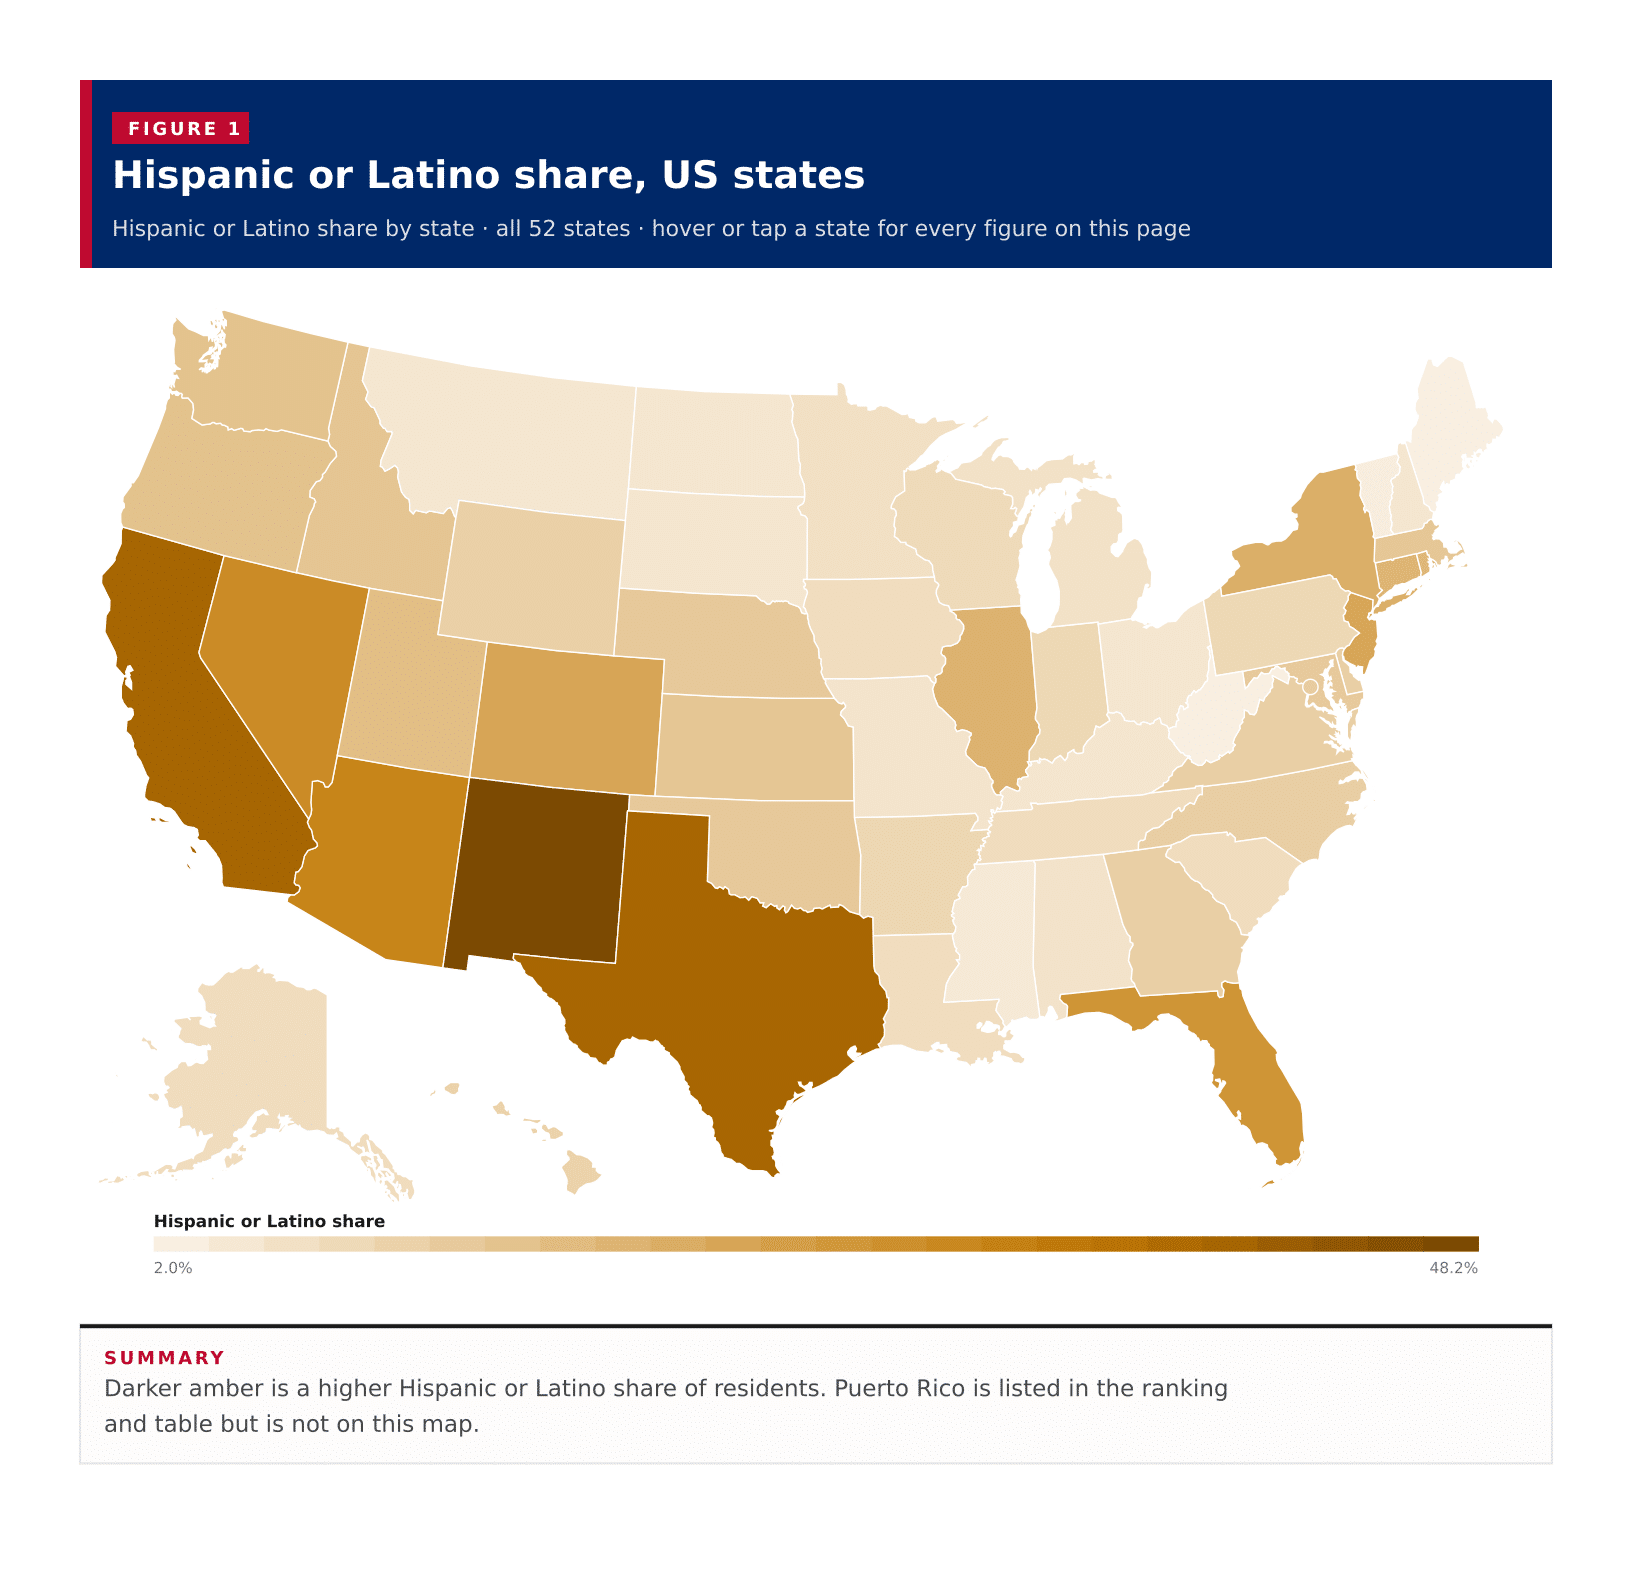
Hispanic or Latino share by state · all 52 states · hover or tap a state for every figure on this page
New Mexico is the most Hispanic of the 50 states on the 2023 ACS five-year estimates: 48.2 percent of residents are Hispanic or Latino, ahead of California at 39.8 percent and Texas at 39.5 percent. California still has the largest Hispanic population in count, 15,630,830, then Texas at 11,697,134 and Florida at 5,865,737. Those three states hold just over half of the Hispanic residents in the 50 states and the District of Columbia. A typical published area is 10.7 percent Hispanic or Latino, the midpoint of the 52 figures. West Virginia is the lowest of the 50 states at 2.0 percent, just under Maine and Vermont. Puerto Rico, which this table also returns, is 98.8 percent Hispanic or Latino. These figures are Hispanic or Latino origin, an ethnicity the Census asks separately from race, not a race table.
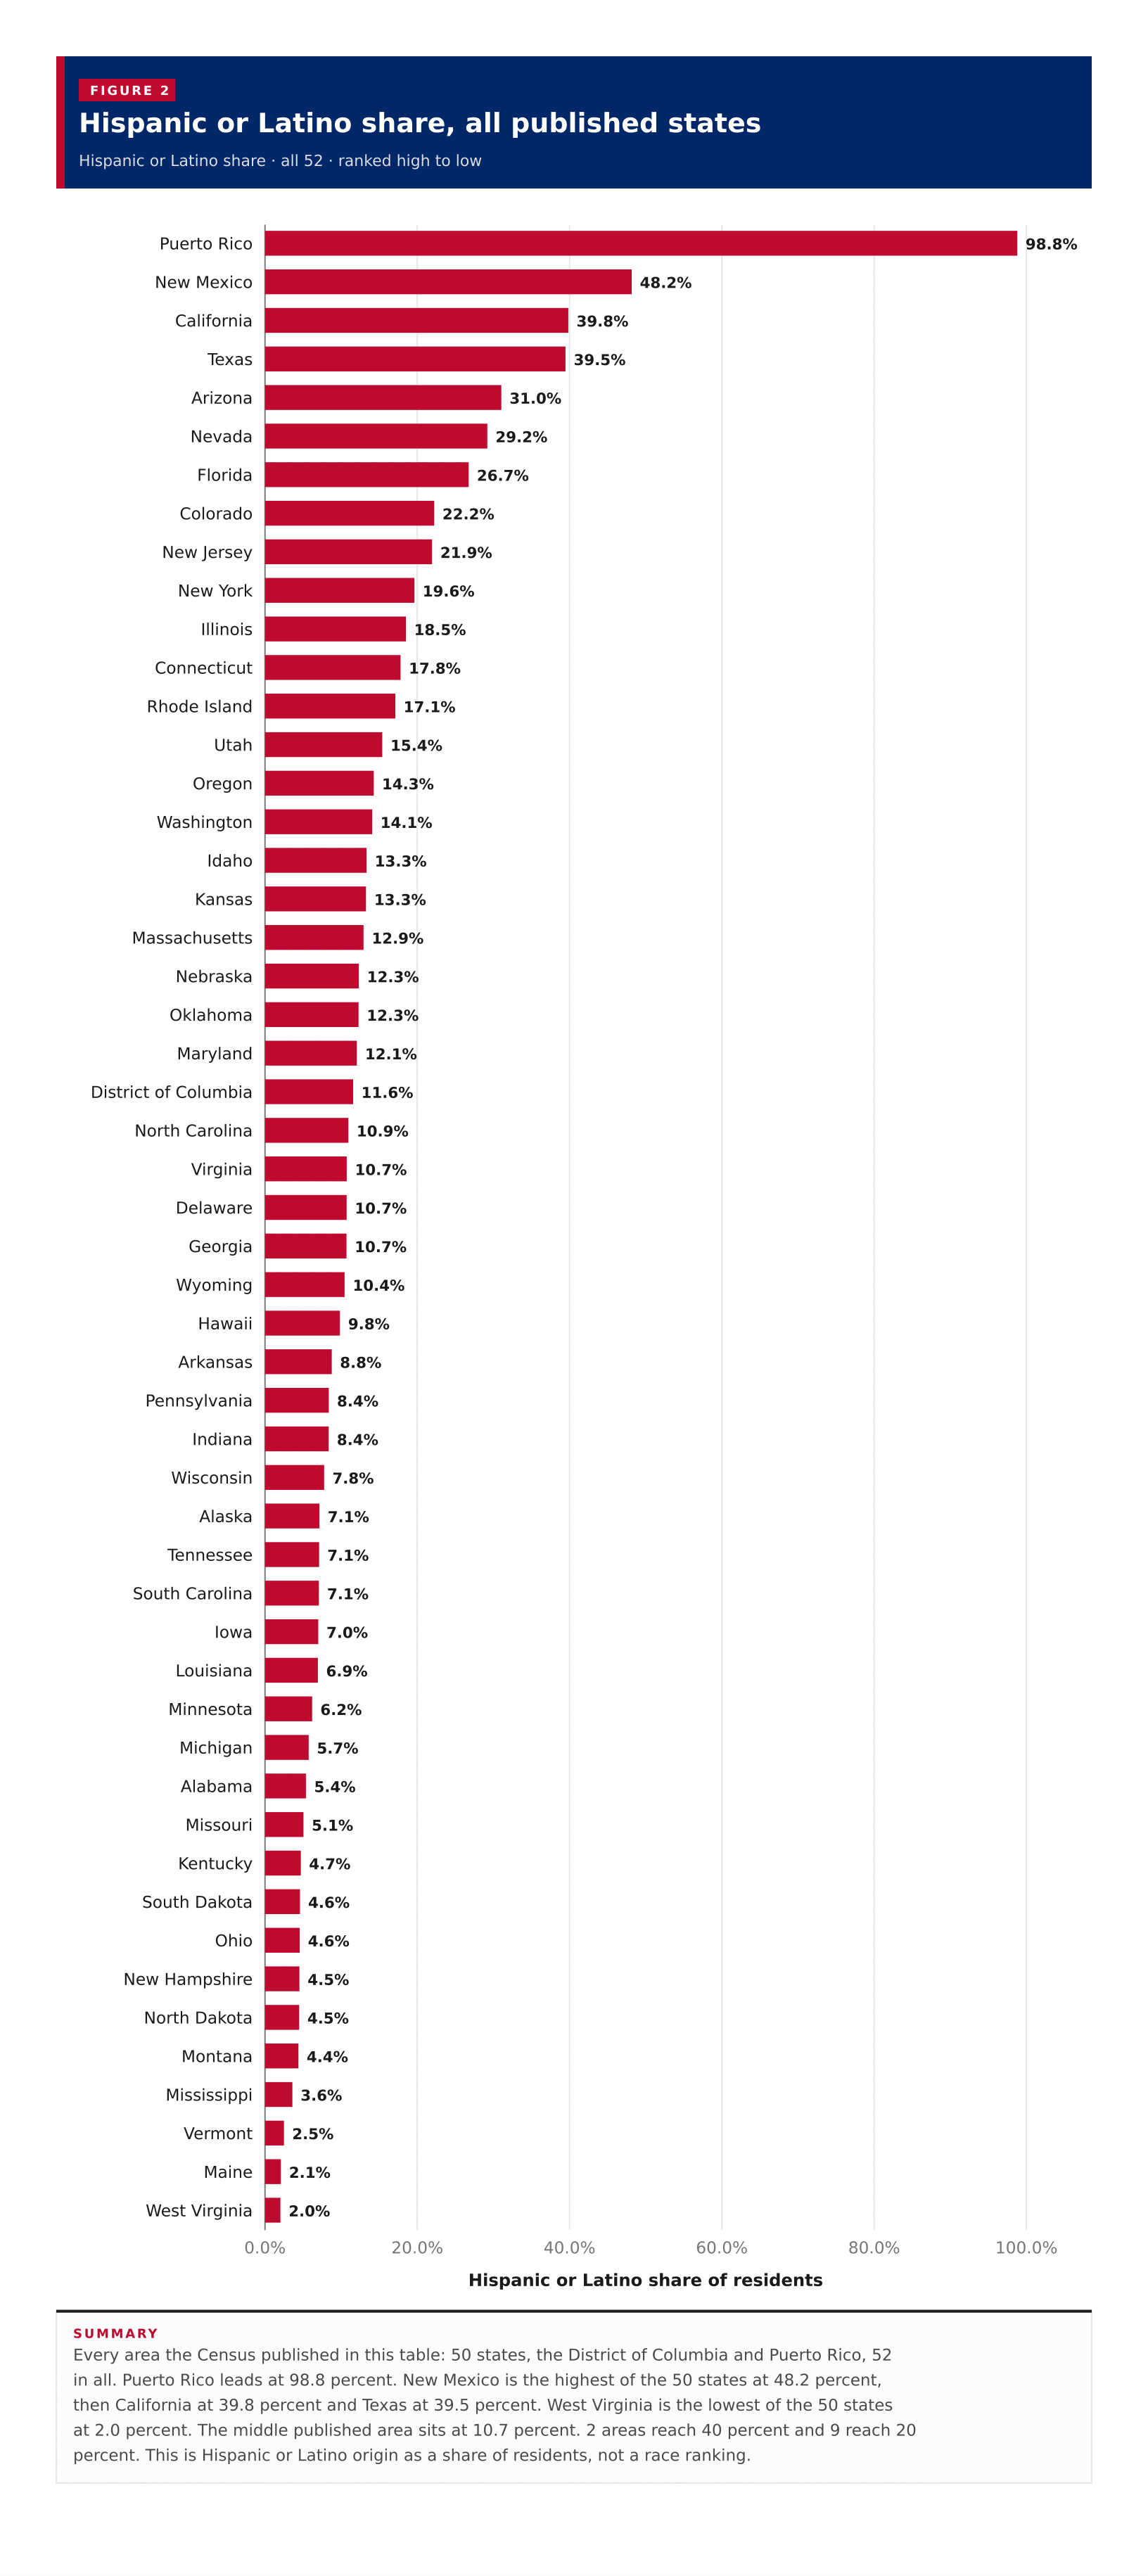
Hispanic or Latino share · all 52 · ranked high to low
Every area the Census published in this table: 50 states, the District of Columbia and Puerto Rico, 52 in all. Puerto Rico leads at 98.8 percent. New Mexico is the highest of the 50 states at 48.2 percent, then California at 39.8 percent and Texas at 39.5 percent. West Virginia is the lowest of the 50 states at 2.0 percent. The middle published area sits at 10.7 percent. 2 areas reach 40 percent and 9 reach 20 percent. This is Hispanic or Latino origin as a share of residents, not a race ranking.
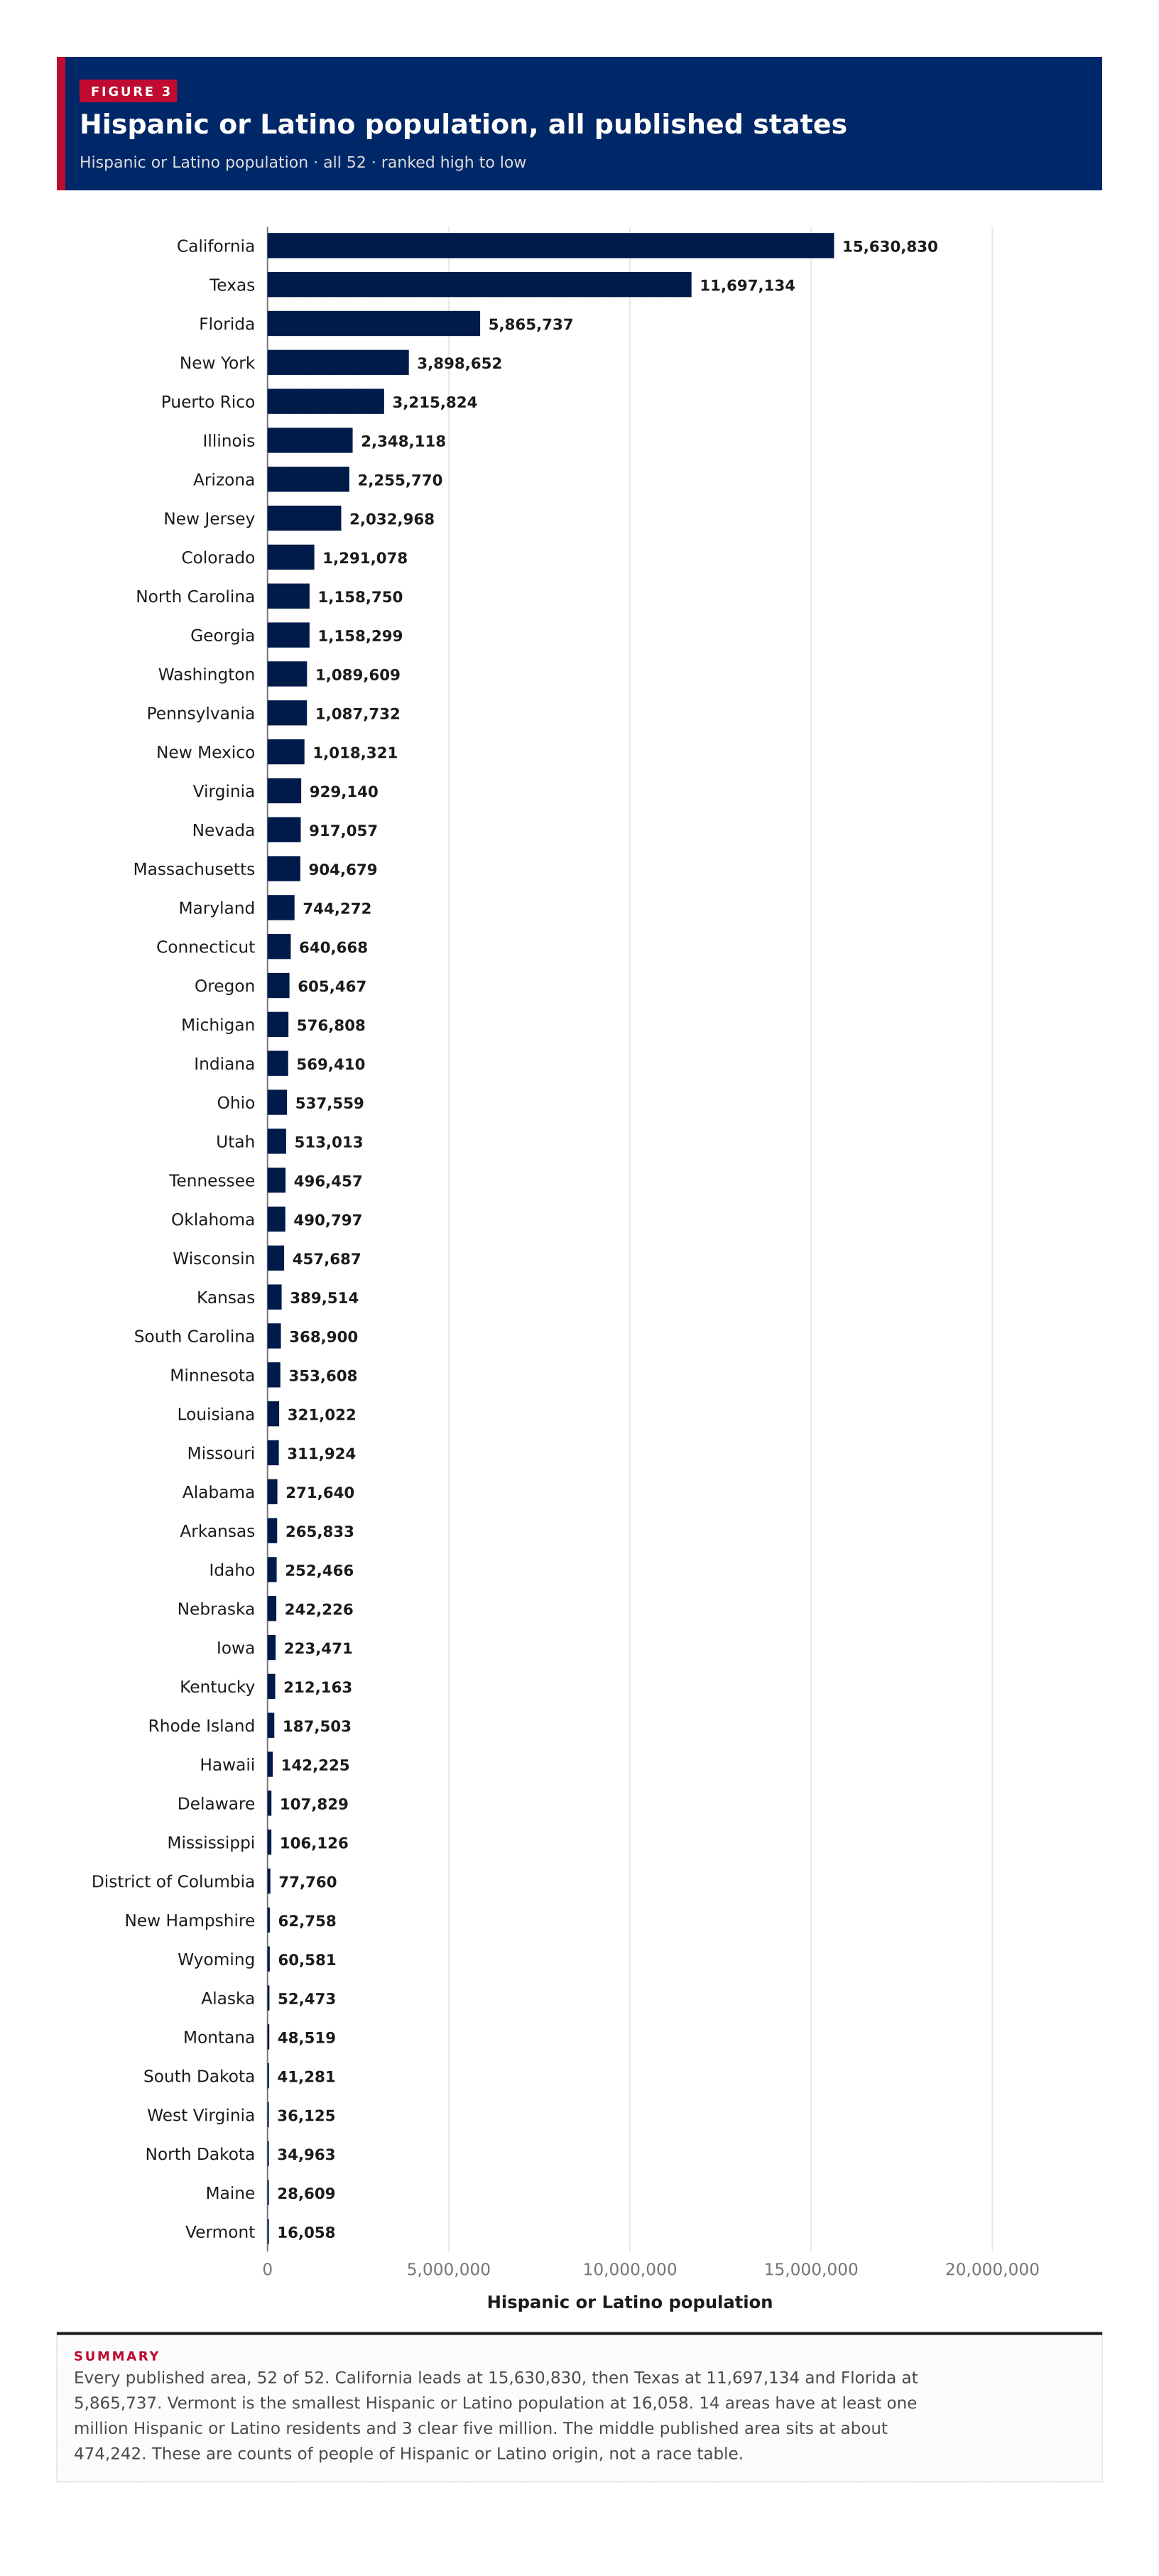
Hispanic or Latino population · all 52 · ranked high to low
Every published area, 52 of 52. California leads at 15,630,830, then Texas at 11,697,134 and Florida at 5,865,737. Vermont is the smallest Hispanic or Latino population at 16,058. 14 areas have at least one million Hispanic or Latino residents and 3 clear five million. The middle published area sits at about 474,242. These are counts of people of Hispanic or Latino origin, not a race table.
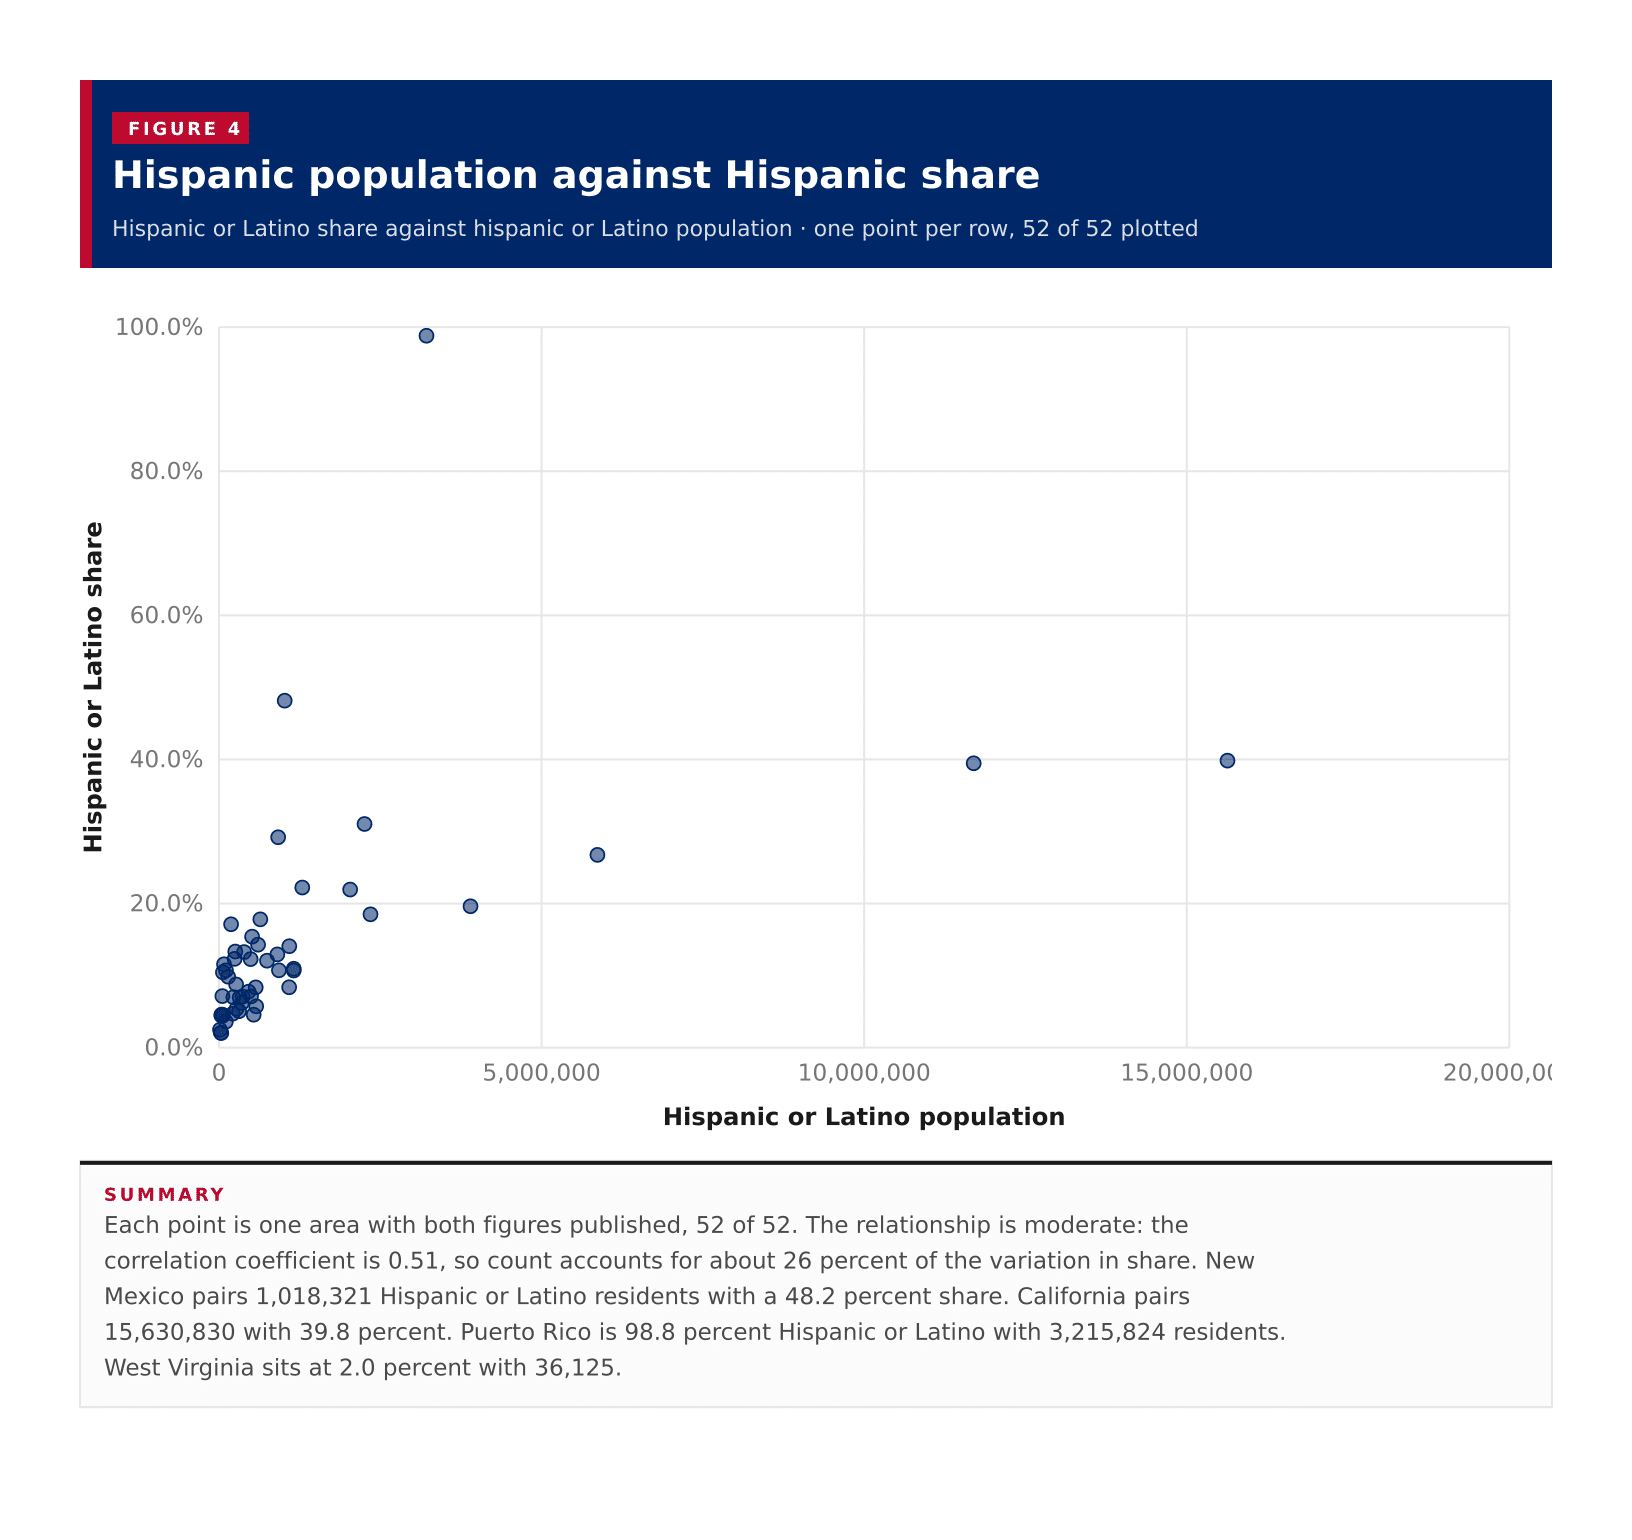
Hispanic or Latino share against hispanic or Latino population · one point per row, 52 of 52 plotted
Each point is one area with both figures published, 52 of 52. The relationship is moderate: the correlation coefficient is 0.51, so count accounts for about 26 percent of the variation in share. New Mexico pairs 1,018,321 Hispanic or Latino residents with a 48.2 percent share. California pairs 15,630,830 with 39.8 percent. Puerto Rico is 98.8 percent Hispanic or Latino with 3,215,824 residents. West Virginia sits at 2.0 percent with 36,125.
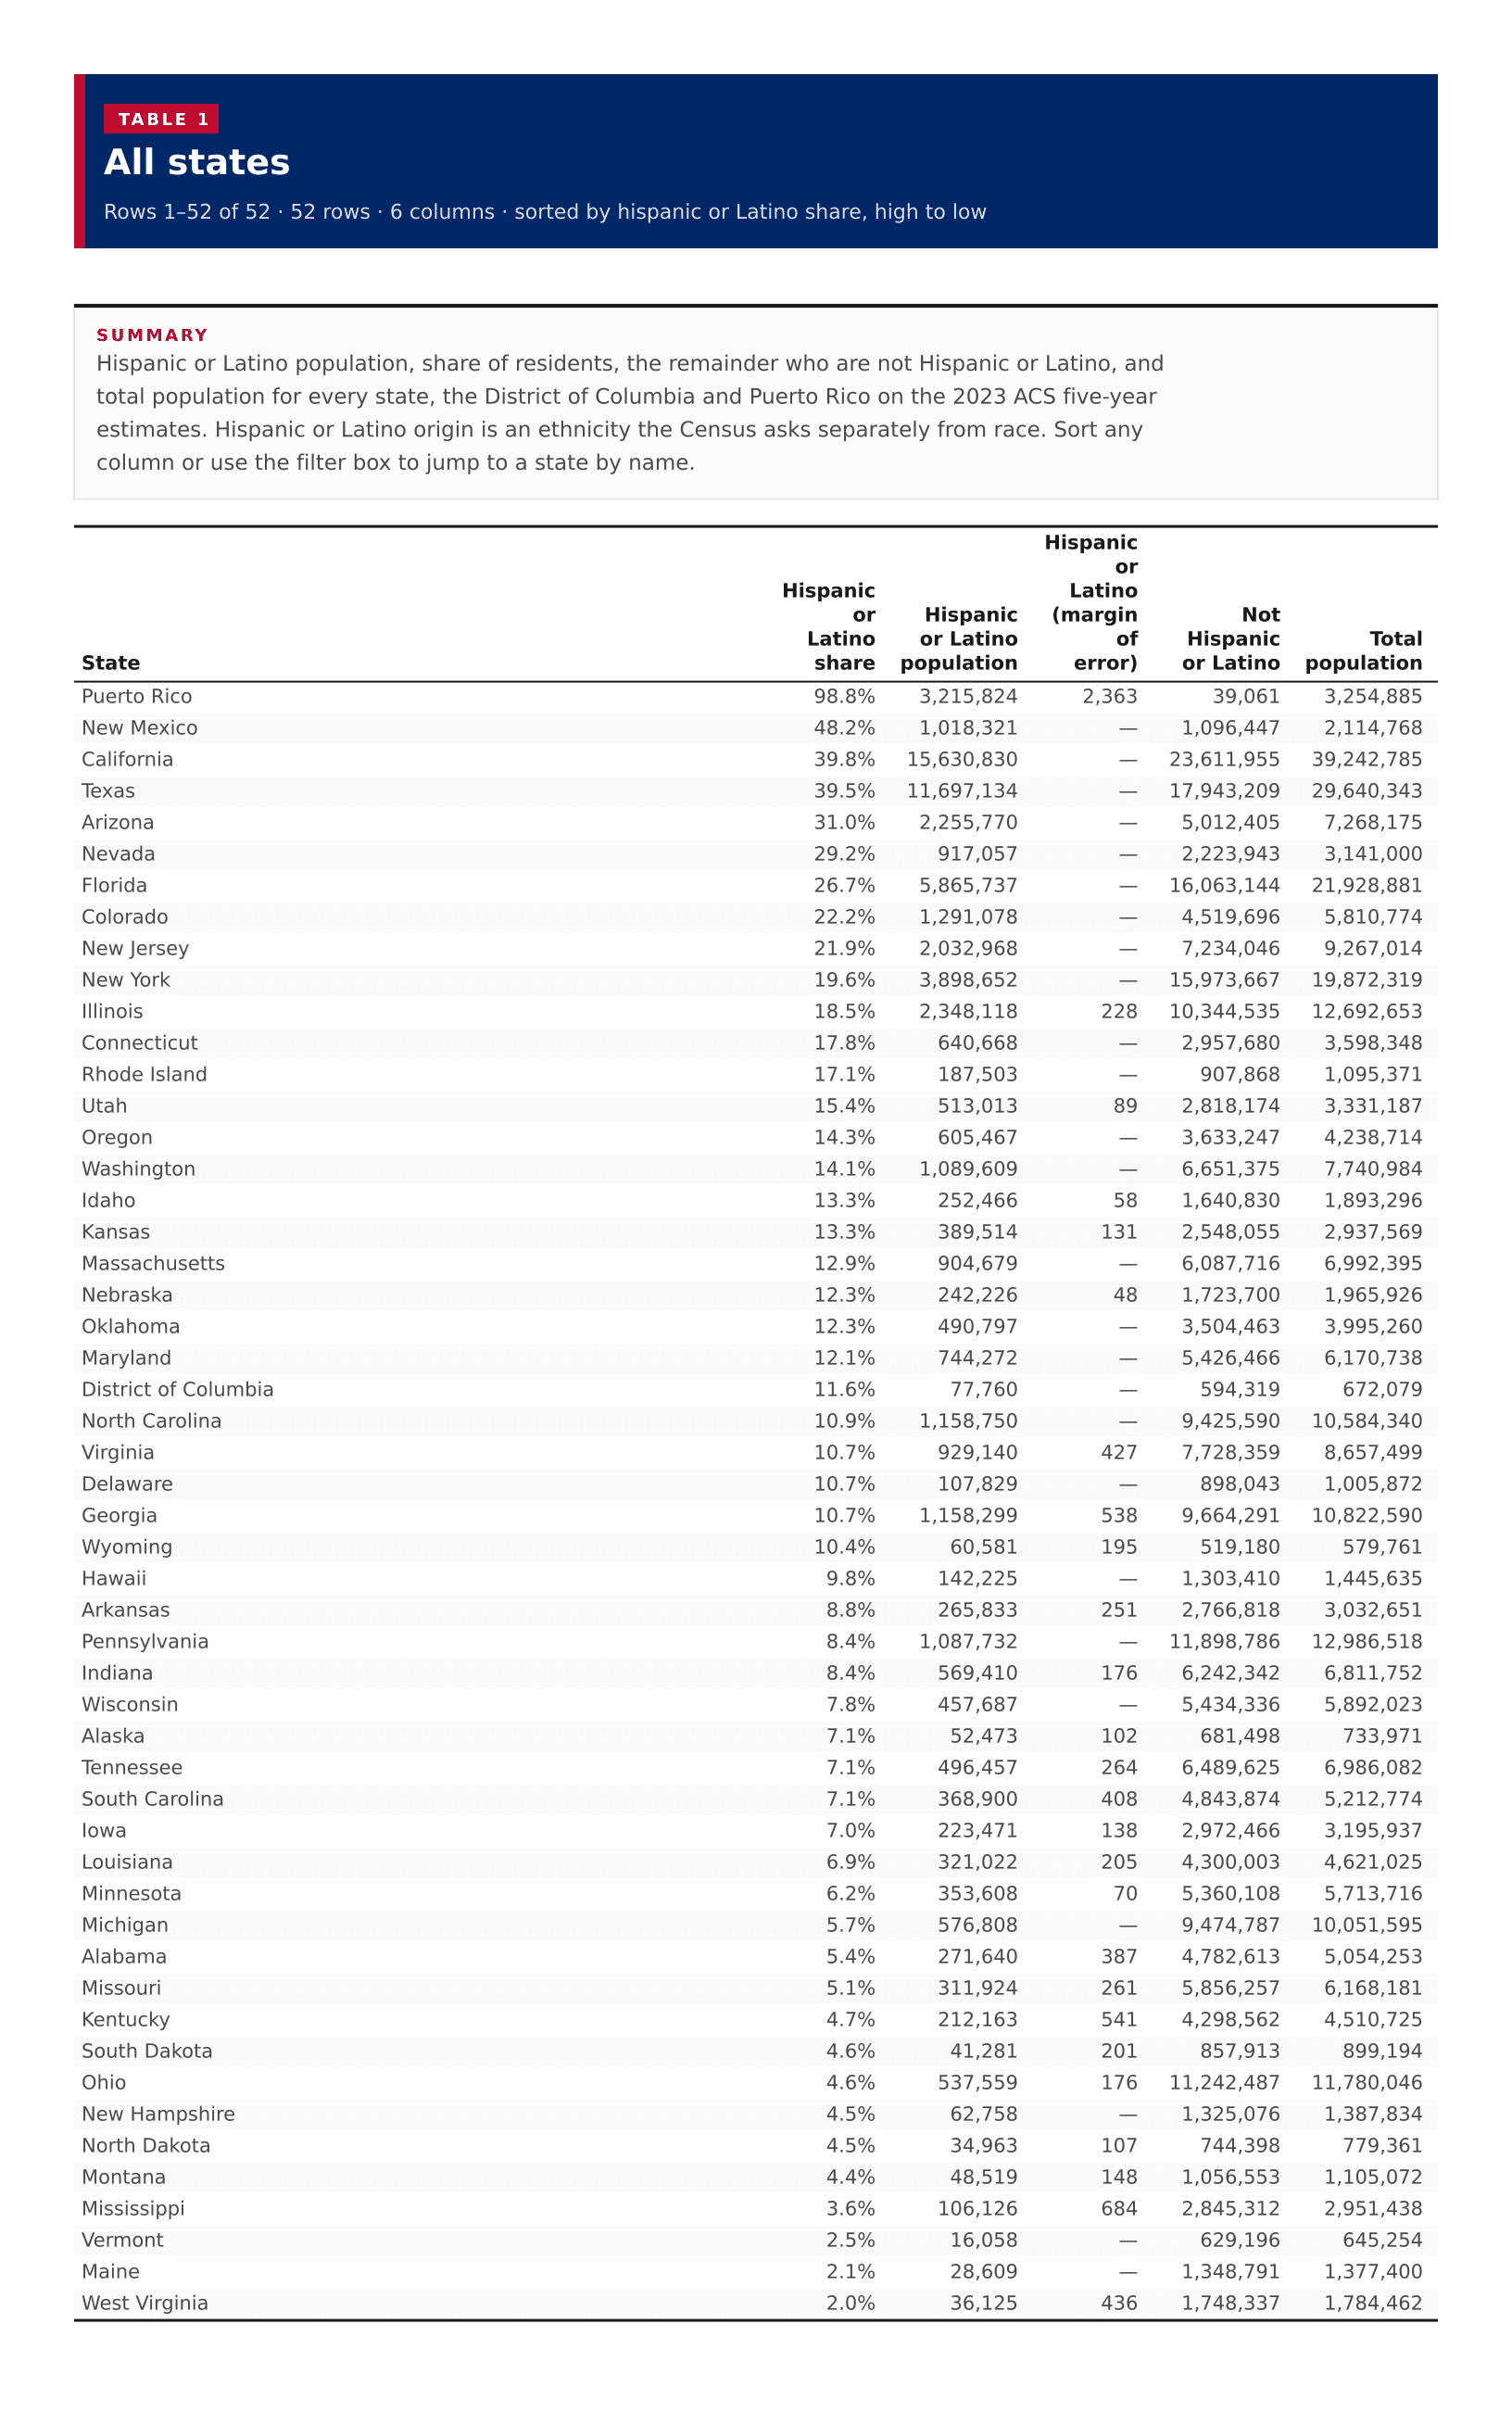
52 rows · 6 columns · sorted by hispanic or Latino share, high to low
Hispanic or Latino population, share of residents, the remainder who are not Hispanic or Latino, and total population for every state, the District of Columbia and Puerto Rico on the 2023 ACS five-year estimates. Hispanic or Latino origin is an ethnicity the Census asks separately from race. Sort any column or use the filter box to jump to a state by name.
| ? | ? | ? | ? | ? | |
|---|---|---|---|---|---|
| Puerto Rico | 98.8% | 3,215,824 | 2,363 | 39,061 | 3,254,885 |
| New Mexico | 48.2% | 1,018,321 | , | 1,096,447 | 2,114,768 |
| California | 39.8% | 15,630,830 | , | 23,611,955 | 39,242,785 |
| Texas | 39.5% | 11,697,134 | , | 17,943,209 | 29,640,343 |
| Arizona | 31.0% | 2,255,770 | , | 5,012,405 | 7,268,175 |
| Nevada | 29.2% | 917,057 | , | 2,223,943 | 3,141,000 |
| Florida | 26.7% | 5,865,737 | , | 16,063,144 | 21,928,881 |
| Colorado | 22.2% | 1,291,078 | , | 4,519,696 | 5,810,774 |
| New Jersey | 21.9% | 2,032,968 | , | 7,234,046 | 9,267,014 |
| New York | 19.6% | 3,898,652 | , | 15,973,667 | 19,872,319 |
| Illinois | 18.5% | 2,348,118 | 228 | 10,344,535 | 12,692,653 |
| Connecticut | 17.8% | 640,668 | , | 2,957,680 | 3,598,348 |
| Rhode Island | 17.1% | 187,503 | , | 907,868 | 1,095,371 |
| Utah | 15.4% | 513,013 | 89 | 2,818,174 | 3,331,187 |
| Oregon | 14.3% | 605,467 | , | 3,633,247 | 4,238,714 |
| Washington | 14.1% | 1,089,609 | , | 6,651,375 | 7,740,984 |
| Idaho | 13.3% | 252,466 | 58 | 1,640,830 | 1,893,296 |
| Kansas | 13.3% | 389,514 | 131 | 2,548,055 | 2,937,569 |
| Massachusetts | 12.9% | 904,679 | , | 6,087,716 | 6,992,395 |
| Nebraska | 12.3% | 242,226 | 48 | 1,723,700 | 1,965,926 |
| Oklahoma | 12.3% | 490,797 | , | 3,504,463 | 3,995,260 |
| Maryland | 12.1% | 744,272 | , | 5,426,466 | 6,170,738 |
| District of Columbia | 11.6% | 77,760 | , | 594,319 | 672,079 |
| North Carolina | 10.9% | 1,158,750 | , | 9,425,590 | 10,584,340 |
| Virginia | 10.7% | 929,140 | 427 | 7,728,359 | 8,657,499 |
| Delaware | 10.7% | 107,829 | , | 898,043 | 1,005,872 |
| Georgia | 10.7% | 1,158,299 | 538 | 9,664,291 | 10,822,590 |
| Wyoming | 10.4% | 60,581 | 195 | 519,180 | 579,761 |
| Hawaii | 9.8% | 142,225 | , | 1,303,410 | 1,445,635 |
| Arkansas | 8.8% | 265,833 | 251 | 2,766,818 | 3,032,651 |
| Pennsylvania | 8.4% | 1,087,732 | , | 11,898,786 | 12,986,518 |
| Indiana | 8.4% | 569,410 | 176 | 6,242,342 | 6,811,752 |
| Wisconsin | 7.8% | 457,687 | , | 5,434,336 | 5,892,023 |
| Alaska | 7.1% | 52,473 | 102 | 681,498 | 733,971 |
| Tennessee | 7.1% | 496,457 | 264 | 6,489,625 | 6,986,082 |
| South Carolina | 7.1% | 368,900 | 408 | 4,843,874 | 5,212,774 |
| Iowa | 7.0% | 223,471 | 138 | 2,972,466 | 3,195,937 |
| Louisiana | 6.9% | 321,022 | 205 | 4,300,003 | 4,621,025 |
| Minnesota | 6.2% | 353,608 | 70 | 5,360,108 | 5,713,716 |
| Michigan | 5.7% | 576,808 | , | 9,474,787 | 10,051,595 |
| Alabama | 5.4% | 271,640 | 387 | 4,782,613 | 5,054,253 |
| Missouri | 5.1% | 311,924 | 261 | 5,856,257 | 6,168,181 |
| Kentucky | 4.7% | 212,163 | 541 | 4,298,562 | 4,510,725 |
| South Dakota | 4.6% | 41,281 | 201 | 857,913 | 899,194 |
| Ohio | 4.6% | 537,559 | 176 | 11,242,487 | 11,780,046 |
| New Hampshire | 4.5% | 62,758 | , | 1,325,076 | 1,387,834 |
| North Dakota | 4.5% | 34,963 | 107 | 744,398 | 779,361 |
| Montana | 4.4% | 48,519 | 148 | 1,056,553 | 1,105,072 |
| Mississippi | 3.6% | 106,126 | 684 | 2,845,312 | 2,951,438 |
| Vermont | 2.5% | 16,058 | , | 629,196 | 645,254 |
| Maine | 2.1% | 28,609 | , | 1,348,791 | 1,377,400 |
| West Virginia | 2.0% | 36,125 | 436 | 1,748,337 | 1,784,462 |