Foreign-born population by US state

Summary

Foreign-born share of residents, US states

Foreign-born share by state · all 52 states · hover or tap a state for every figure on this page

52 items
View100%
DownloadPDFImageCSV
StatesCalifornia
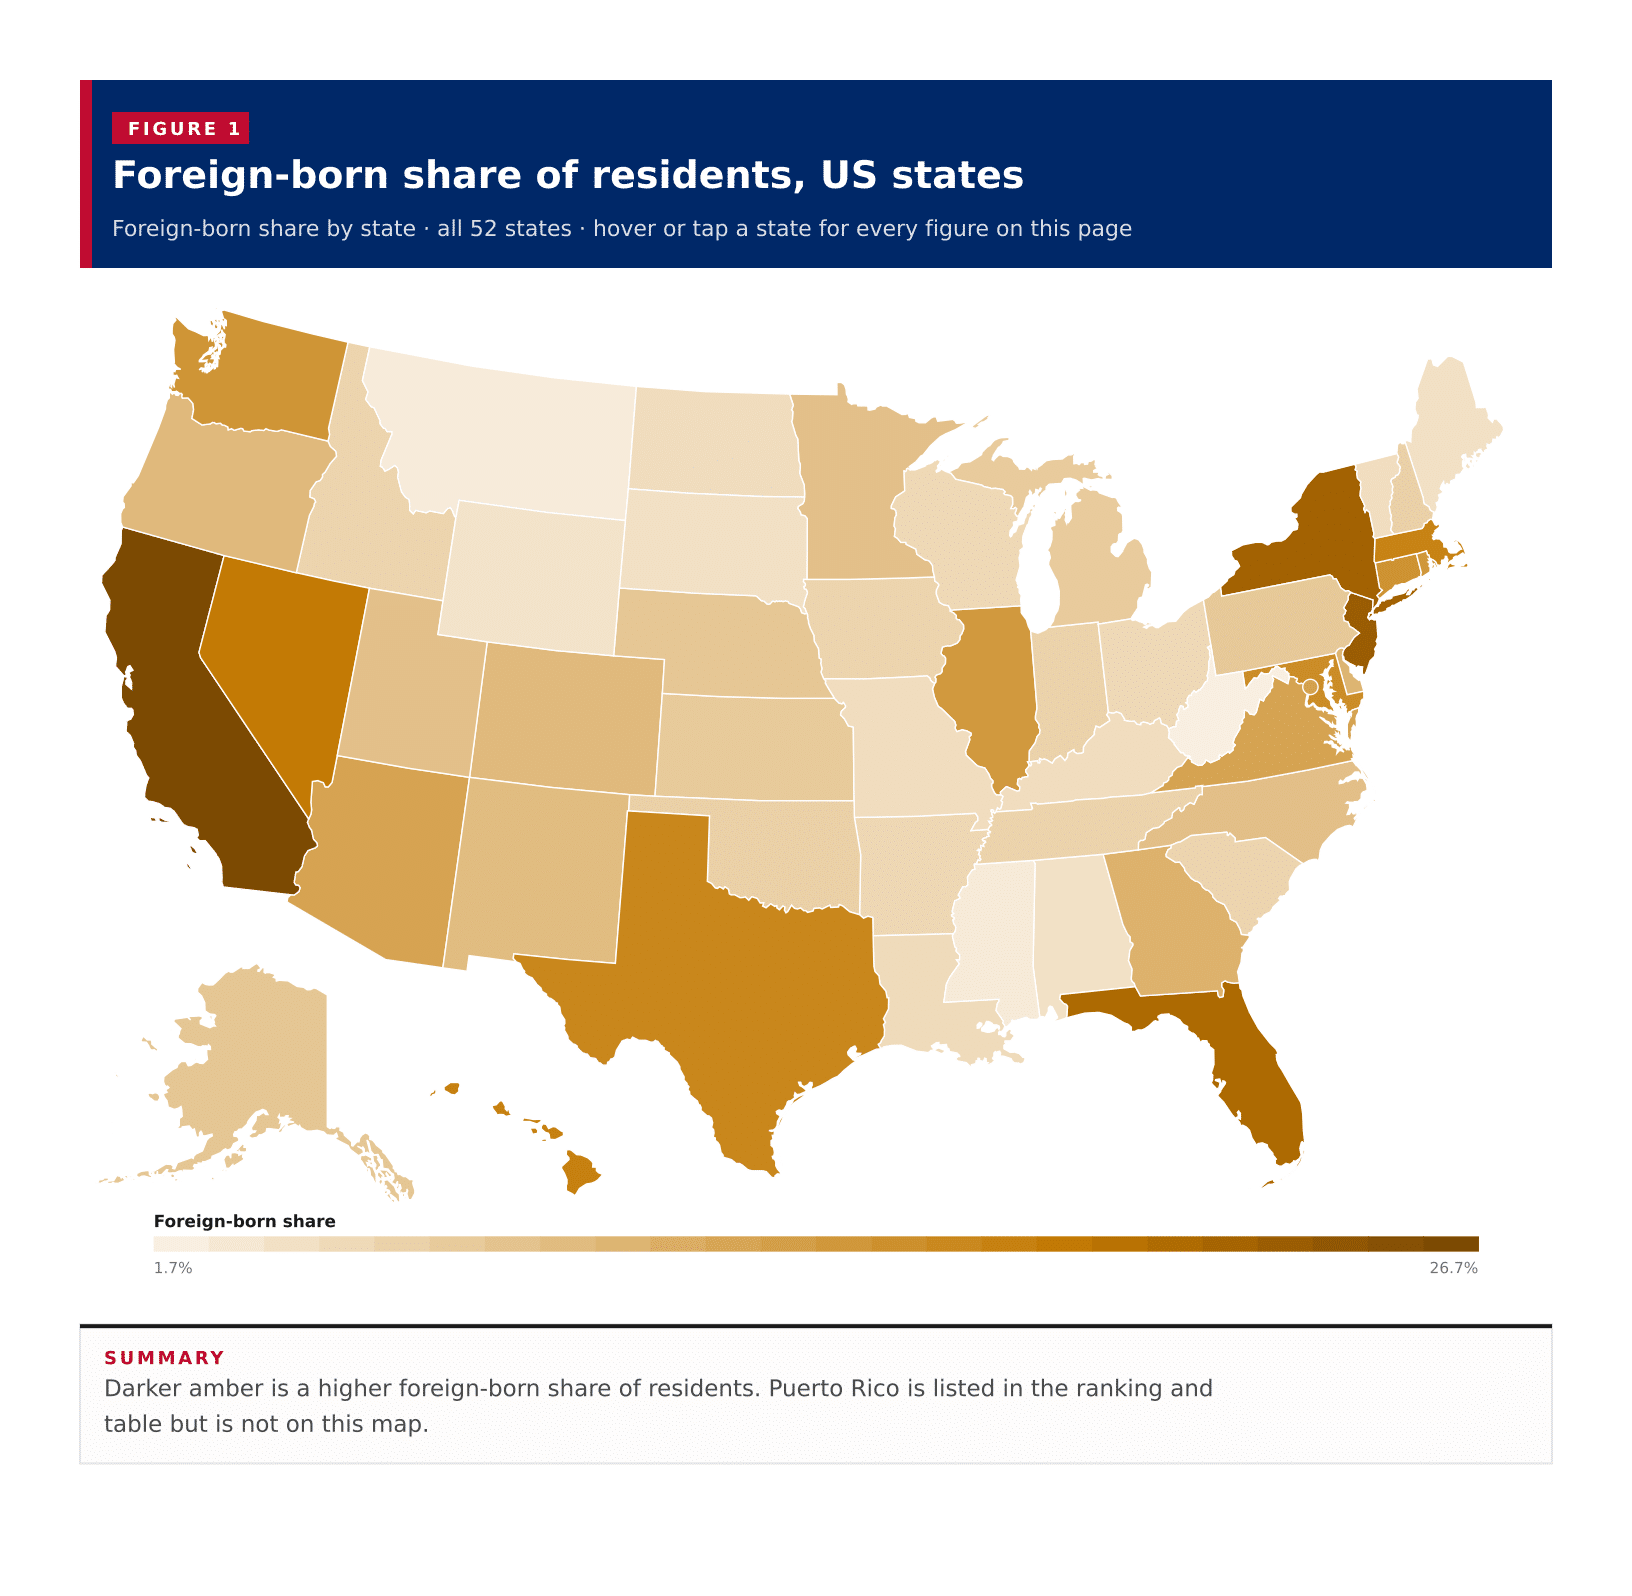
Foreign-born share of residents, US statesDarker amber is a higher foreign-born share of residents. Puerto Rico is listed in the ranking and table but is not on this map.Alabama · Foreign-born share: 3.8% · Foreign-born population: 192,039 · Foreign-born margin of error: 3,595 · Native-born population: 4,862,214 · Total population: 5,054,253Alaska · Foreign-born share: 7.8% · Foreign-born population: 57,131 · Foreign-born margin of error: 2,060 · Native-born population: 676,840 · Total population: 733,971Arizona · Foreign-born share: 12.9% · Foreign-born population: 935,586 · Foreign-born margin of error: 8,543 · Native-born population: 6,332,589 · Total population: 7,268,175Arkansas · Foreign-born share: 5.2% · Foreign-born population: 158,219 · Foreign-born margin of error: 3,321 · Native-born population: 2,874,432 · Total population: 3,032,651California · Foreign-born share: 26.7% · Foreign-born population: 10,479,526 · Foreign-born margin of error: 34,684 · Native-born population: 28,763,259 · Total population: 39,242,785Colorado · Foreign-born share: 9.6% · Foreign-born population: 556,591 · Foreign-born margin of error: 6,532 · Native-born population: 5,254,183 · Total population: 5,810,774Connecticut · Foreign-born share: 15.4% · Foreign-born population: 555,161 · Foreign-born margin of error: 7,881 · Native-born population: 3,043,187 · Total population: 3,598,348Delaware · Foreign-born share: 10.4% · Foreign-born population: 104,694 · Foreign-born margin of error: 3,031 · Native-born population: 901,178 · Total population: 1,005,872Florida · Foreign-born share: 21.4% · Foreign-born population: 4,694,419 · Foreign-born margin of error: 20,973 · Native-born population: 17,234,462 · Total population: 21,928,881Georgia · Foreign-born share: 10.8% · Foreign-born population: 1,172,488 · Foreign-born margin of error: 10,319 · Native-born population: 9,650,102 · Total population: 10,822,590Hawaii · Foreign-born share: 18.1% · Foreign-born population: 261,130 · Foreign-born margin of error: 4,442 · Native-born population: 1,184,505 · Total population: 1,445,635Idaho · Foreign-born share: 5.7% · Foreign-born population: 108,586 · Foreign-born margin of error: 2,815 · Native-born population: 1,784,710 · Total population: 1,893,296Illinois · Foreign-born share: 14.4% · Foreign-born population: 1,833,810 · Foreign-born margin of error: 12,056 · Native-born population: 10,858,843 · Total population: 12,692,653Indiana · Foreign-born share: 5.9% · Foreign-born population: 404,588 · Foreign-born margin of error: 6,116 · Native-born population: 6,407,164 · Total population: 6,811,752Iowa · Foreign-born share: 5.7% · Foreign-born population: 182,594 · Foreign-born margin of error: 3,519 · Native-born population: 3,013,343 · Total population: 3,195,937Kansas · Foreign-born share: 7.2% · Foreign-born population: 211,197 · Foreign-born margin of error: 4,443 · Native-born population: 2,726,372 · Total population: 2,937,569Kentucky · Foreign-born share: 4.4% · Foreign-born population: 199,605 · Foreign-born margin of error: 3,564 · Native-born population: 4,311,120 · Total population: 4,510,725Louisiana · Foreign-born share: 4.7% · Foreign-born population: 218,450 · Foreign-born margin of error: 4,299 · Native-born population: 4,402,575 · Total population: 4,621,025Maine · Foreign-born share: 3.9% · Foreign-born population: 53,627 · Foreign-born margin of error: 1,667 · Native-born population: 1,323,773 · Total population: 1,377,400Maryland · Foreign-born share: 16.3% · Foreign-born population: 1,004,839 · Foreign-born margin of error: 9,997 · Native-born population: 5,165,899 · Total population: 6,170,738Massachusetts · Foreign-born share: 17.7% · Foreign-born population: 1,236,518 · Foreign-born margin of error: 11,974 · Native-born population: 5,755,877 · Total population: 6,992,395Michigan · Foreign-born share: 7.0% · Foreign-born population: 707,414 · Foreign-born margin of error: 7,417 · Native-born population: 9,344,181 · Total population: 10,051,595Minnesota · Foreign-born share: 8.6% · Foreign-born population: 488,897 · Foreign-born margin of error: 6,017 · Native-born population: 5,224,819 · Total population: 5,713,716Mississippi · Foreign-born share: 2.4% · Foreign-born population: 70,565 · Foreign-born margin of error: 2,289 · Native-born population: 2,880,873 · Total population: 2,951,438Missouri · Foreign-born share: 4.4% · Foreign-born population: 269,902 · Foreign-born margin of error: 5,188 · Native-born population: 5,898,279 · Total population: 6,168,181Montana · Foreign-born share: 2.3% · Foreign-born population: 25,327 · Foreign-born margin of error: 1,310 · Native-born population: 1,079,745 · Total population: 1,105,072Nebraska · Foreign-born share: 7.7% · Foreign-born population: 151,436 · Foreign-born margin of error: 3,313 · Native-born population: 1,814,490 · Total population: 1,965,926Nevada · Foreign-born share: 19.0% · Foreign-born population: 595,347 · Foreign-born margin of error: 5,710 · Native-born population: 2,545,653 · Total population: 3,141,000New Hampshire · Foreign-born share: 6.2% · Foreign-born population: 86,095 · Foreign-born margin of error: 2,266 · Native-born population: 1,301,739 · Total population: 1,387,834New Jersey · Foreign-born share: 23.5% · Foreign-born population: 2,181,755 · Foreign-born margin of error: 13,717 · Native-born population: 7,085,259 · Total population: 9,267,014New Mexico · Foreign-born share: 9.2% · Foreign-born population: 195,484 · Foreign-born margin of error: 4,382 · Native-born population: 1,919,284 · Total population: 2,114,768New York · Foreign-born share: 22.6% · Foreign-born population: 4,499,147 · Foreign-born margin of error: 19,576 · Native-born population: 15,373,172 · Total population: 19,872,319North Carolina · Foreign-born share: 8.7% · Foreign-born population: 923,923 · Foreign-born margin of error: 10,165 · Native-born population: 9,660,417 · Total population: 10,584,340North Dakota · Foreign-born share: 4.5% · Foreign-born population: 34,813 · Foreign-born margin of error: 1,427 · Native-born population: 744,548 · Total population: 779,361Ohio · Foreign-born share: 5.0% · Foreign-born population: 593,142 · Foreign-born margin of error: 8,077 · Native-born population: 11,186,904 · Total population: 11,780,046Oklahoma · Foreign-born share: 6.3% · Foreign-born population: 249,771 · Foreign-born margin of error: 3,662 · Native-born population: 3,745,489 · Total population: 3,995,260Oregon · Foreign-born share: 9.7% · Foreign-born population: 410,791 · Foreign-born margin of error: 5,805 · Native-born population: 3,827,923 · Total population: 4,238,714Pennsylvania · Foreign-born share: 7.4% · Foreign-born population: 961,247 · Foreign-born margin of error: 9,631 · Native-born population: 12,025,271 · Total population: 12,986,518Rhode Island · Foreign-born share: 14.8% · Foreign-born population: 162,413 · Foreign-born margin of error: 4,078 · Native-born population: 932,958 · Total population: 1,095,371South Carolina · Foreign-born share: 5.6% · Foreign-born population: 293,556 · Foreign-born margin of error: 5,078 · Native-born population: 4,919,218 · Total population: 5,212,774South Dakota · Foreign-born share: 3.9% · Foreign-born population: 35,218 · Foreign-born margin of error: 1,738 · Native-born population: 863,976 · Total population: 899,194Tennessee · Foreign-born share: 5.9% · Foreign-born population: 411,840 · Foreign-born margin of error: 6,704 · Native-born population: 6,574,242 · Total population: 6,986,082Texas · Foreign-born share: 17.2% · Foreign-born population: 5,095,888 · Foreign-born margin of error: 28,151 · Native-born population: 24,544,455 · Total population: 29,640,343Utah · Foreign-born share: 8.6% · Foreign-born population: 285,013 · Foreign-born margin of error: 4,566 · Native-born population: 3,046,174 · Total population: 3,331,187Vermont · Foreign-born share: 4.3% · Foreign-born population: 27,968 · Foreign-born margin of error: 1,335 · Native-born population: 617,286 · Total population: 645,254Virginia · Foreign-born share: 12.9% · Foreign-born population: 1,120,207 · Foreign-born margin of error: 10,777 · Native-born population: 7,537,292 · Total population: 8,657,499Washington · Foreign-born share: 15.1% · Foreign-born population: 1,170,683 · Foreign-born margin of error: 10,599 · Native-born population: 6,570,301 · Total population: 7,740,984West Virginia · Foreign-born share: 1.7% · Foreign-born population: 30,515 · Foreign-born margin of error: 1,534 · Native-born population: 1,753,947 · Total population: 1,784,462Wisconsin · Foreign-born share: 5.1% · Foreign-born population: 299,804 · Foreign-born margin of error: 4,901 · Native-born population: 5,592,219 · Total population: 5,892,023Wyoming · Foreign-born share: 3.5% · Foreign-born population: 20,364 · Foreign-born margin of error: 1,110 · Native-born population: 559,397 · Total population: 579,761District of Columbia · Foreign-born share: 13.3% · Foreign-born population: 89,578 · Foreign-born margin of error: 2,732 · Native-born population: 582,501 · Total population: 672,079District of Columbia · Foreign-born share: 13.3% · Foreign-born population: 89,578 · Foreign-born margin of error: 2,732 · Native-born population: 582,501 · Total population: 672,079Foreign-born share1.7%26.7%
Summary

Darker amber is a higher foreign-born share of residents. Puerto Rico is listed in the ranking and table but is not on this map.

A typical published area has 7.6 percent of residents born outside the United States, the midpoint of the 50 states, the District of Columbia and Puerto Rico on the 2023 ACS five-year estimates. The United States as a whole sits higher at 13.9 percent, because California, Texas, Florida and New York are both large and high-share. California leads at 26.7 percent, 10,479,526 people. New Jersey, New York and Florida also clear 20 percent. West Virginia is the lowest of the 50 states at 1.7 percent. Puerto Rico, which this table also returns, is 2.7 percent. These are each area's own foreign-born share of residents, not an average of state rates.

In short

7.6%typical published areathe middle area, not an average
13.9%United States50 states and DC, not an average of state rates
26.7%Californiahighest foreign-born share, 10,479,526 people
1.7%West Virginialowest of the 50 states
4areas at or above 20 percentCalifornia, New Jersey, New York and Florida
Figure 1

Foreign-born share of residents, all published states

Foreign-born share · all 52 · ranked high to low

52 items
View100%
DownloadPDFImageCSV
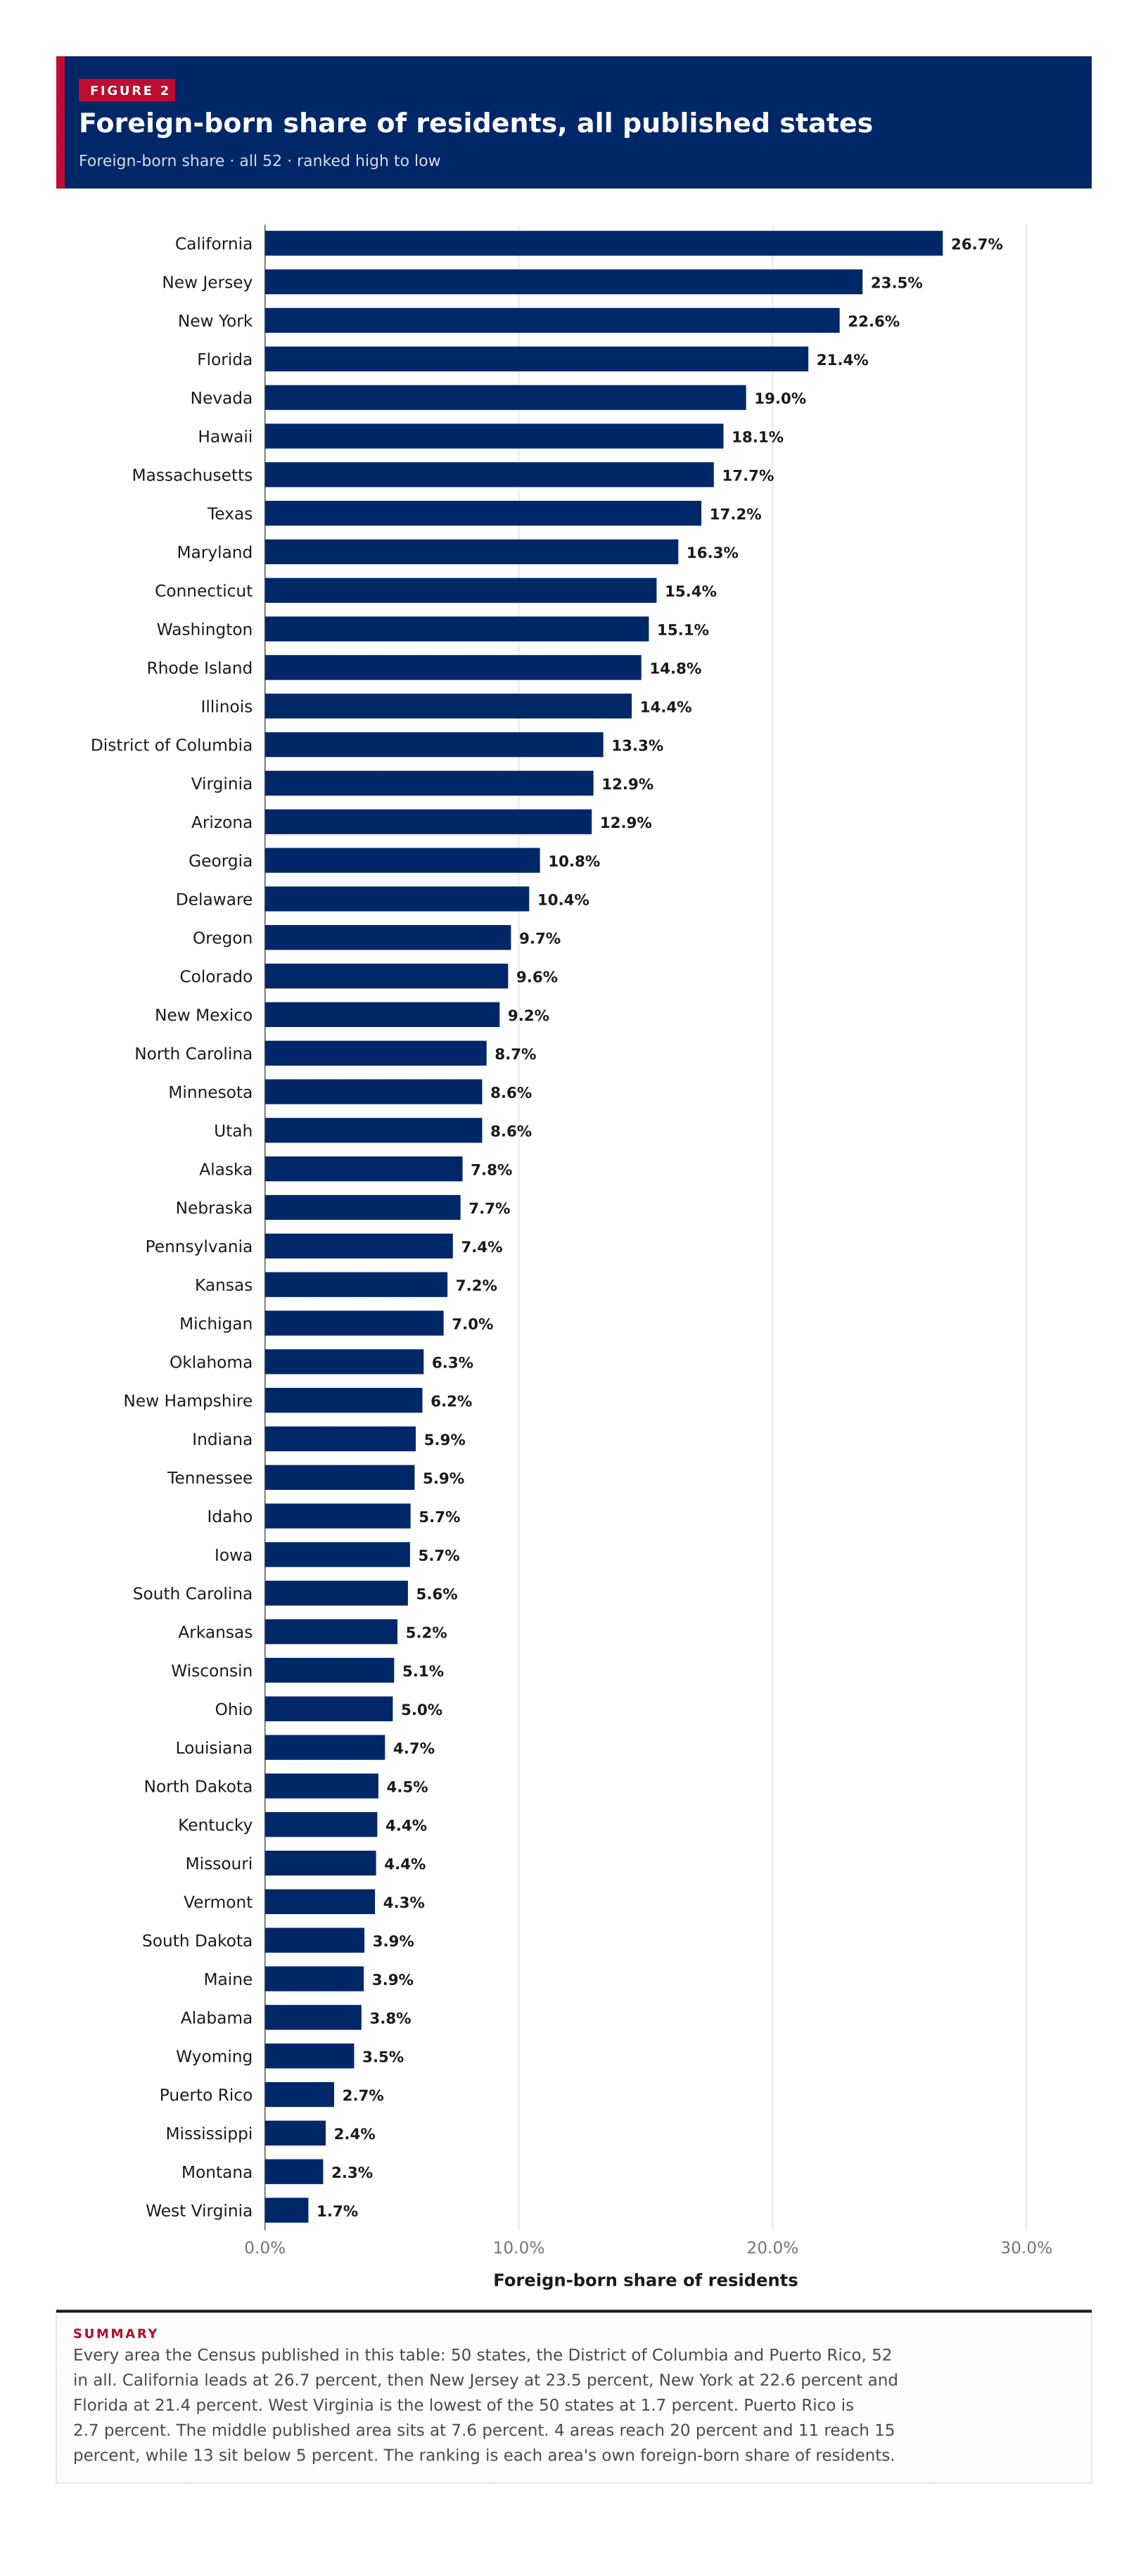
Foreign-born share of residents, all published statesEvery area the Census published in this table: 50 states, the District of Columbia and Puerto Rico, 52 in all. California leads at 26.7 percent, then New Jersey at 23.5 percent, New York at 22.6 percent and Florida at 21.4 percent. West Virginia is the lowest of the 50 states at 1.7 percent. Puerto Rico is 2.7 percent. The middle published area sits at 7.6 percent. 4 areas reach 20 percent and 11 reach 15 percent, while 13 sit below 5 percent. The ranking is each area's own foreign-born share of residents.0.0%10.0%20.0%30.0%Foreign-born share of residents26.7%California23.5%New Jersey22.6%New York21.4%Florida19.0%Nevada18.1%Hawaii17.7%Massachusetts17.2%Texas16.3%Maryland15.4%Connecticut15.1%Washington14.8%Rhode Island14.4%Illinois13.3%District of Columbia12.9%Virginia12.9%Arizona10.8%Georgia10.4%Delaware9.7%Oregon9.6%Colorado9.2%New Mexico8.7%North Carolina8.6%Minnesota8.6%Utah7.8%Alaska7.7%Nebraska7.4%Pennsylvania7.2%Kansas7.0%Michigan6.3%Oklahoma6.2%New Hampshire5.9%Indiana5.9%Tennessee5.7%Idaho5.7%Iowa5.6%South Carolina5.2%Arkansas5.1%Wisconsin5.0%Ohio4.7%Louisiana4.5%North Dakota4.4%Kentucky4.4%Missouri4.3%Vermont3.9%South Dakota3.9%Maine3.8%Alabama3.5%Wyoming2.7%Puerto Rico2.4%Mississippi2.3%Montana1.7%West Virginia
Summary

Every area the Census published in this table: 50 states, the District of Columbia and Puerto Rico, 52 in all. California leads at 26.7 percent, then New Jersey at 23.5 percent, New York at 22.6 percent and Florida at 21.4 percent. West Virginia is the lowest of the 50 states at 1.7 percent. Puerto Rico is 2.7 percent. The middle published area sits at 7.6 percent. 4 areas reach 20 percent and 11 reach 15 percent, while 13 sit below 5 percent. The ranking is each area's own foreign-born share of residents.

Figure 2

Foreign-born population, all published states

Foreign-born population · all 52 · ranked high to low

52 items
View100%
DownloadPDFImageCSV
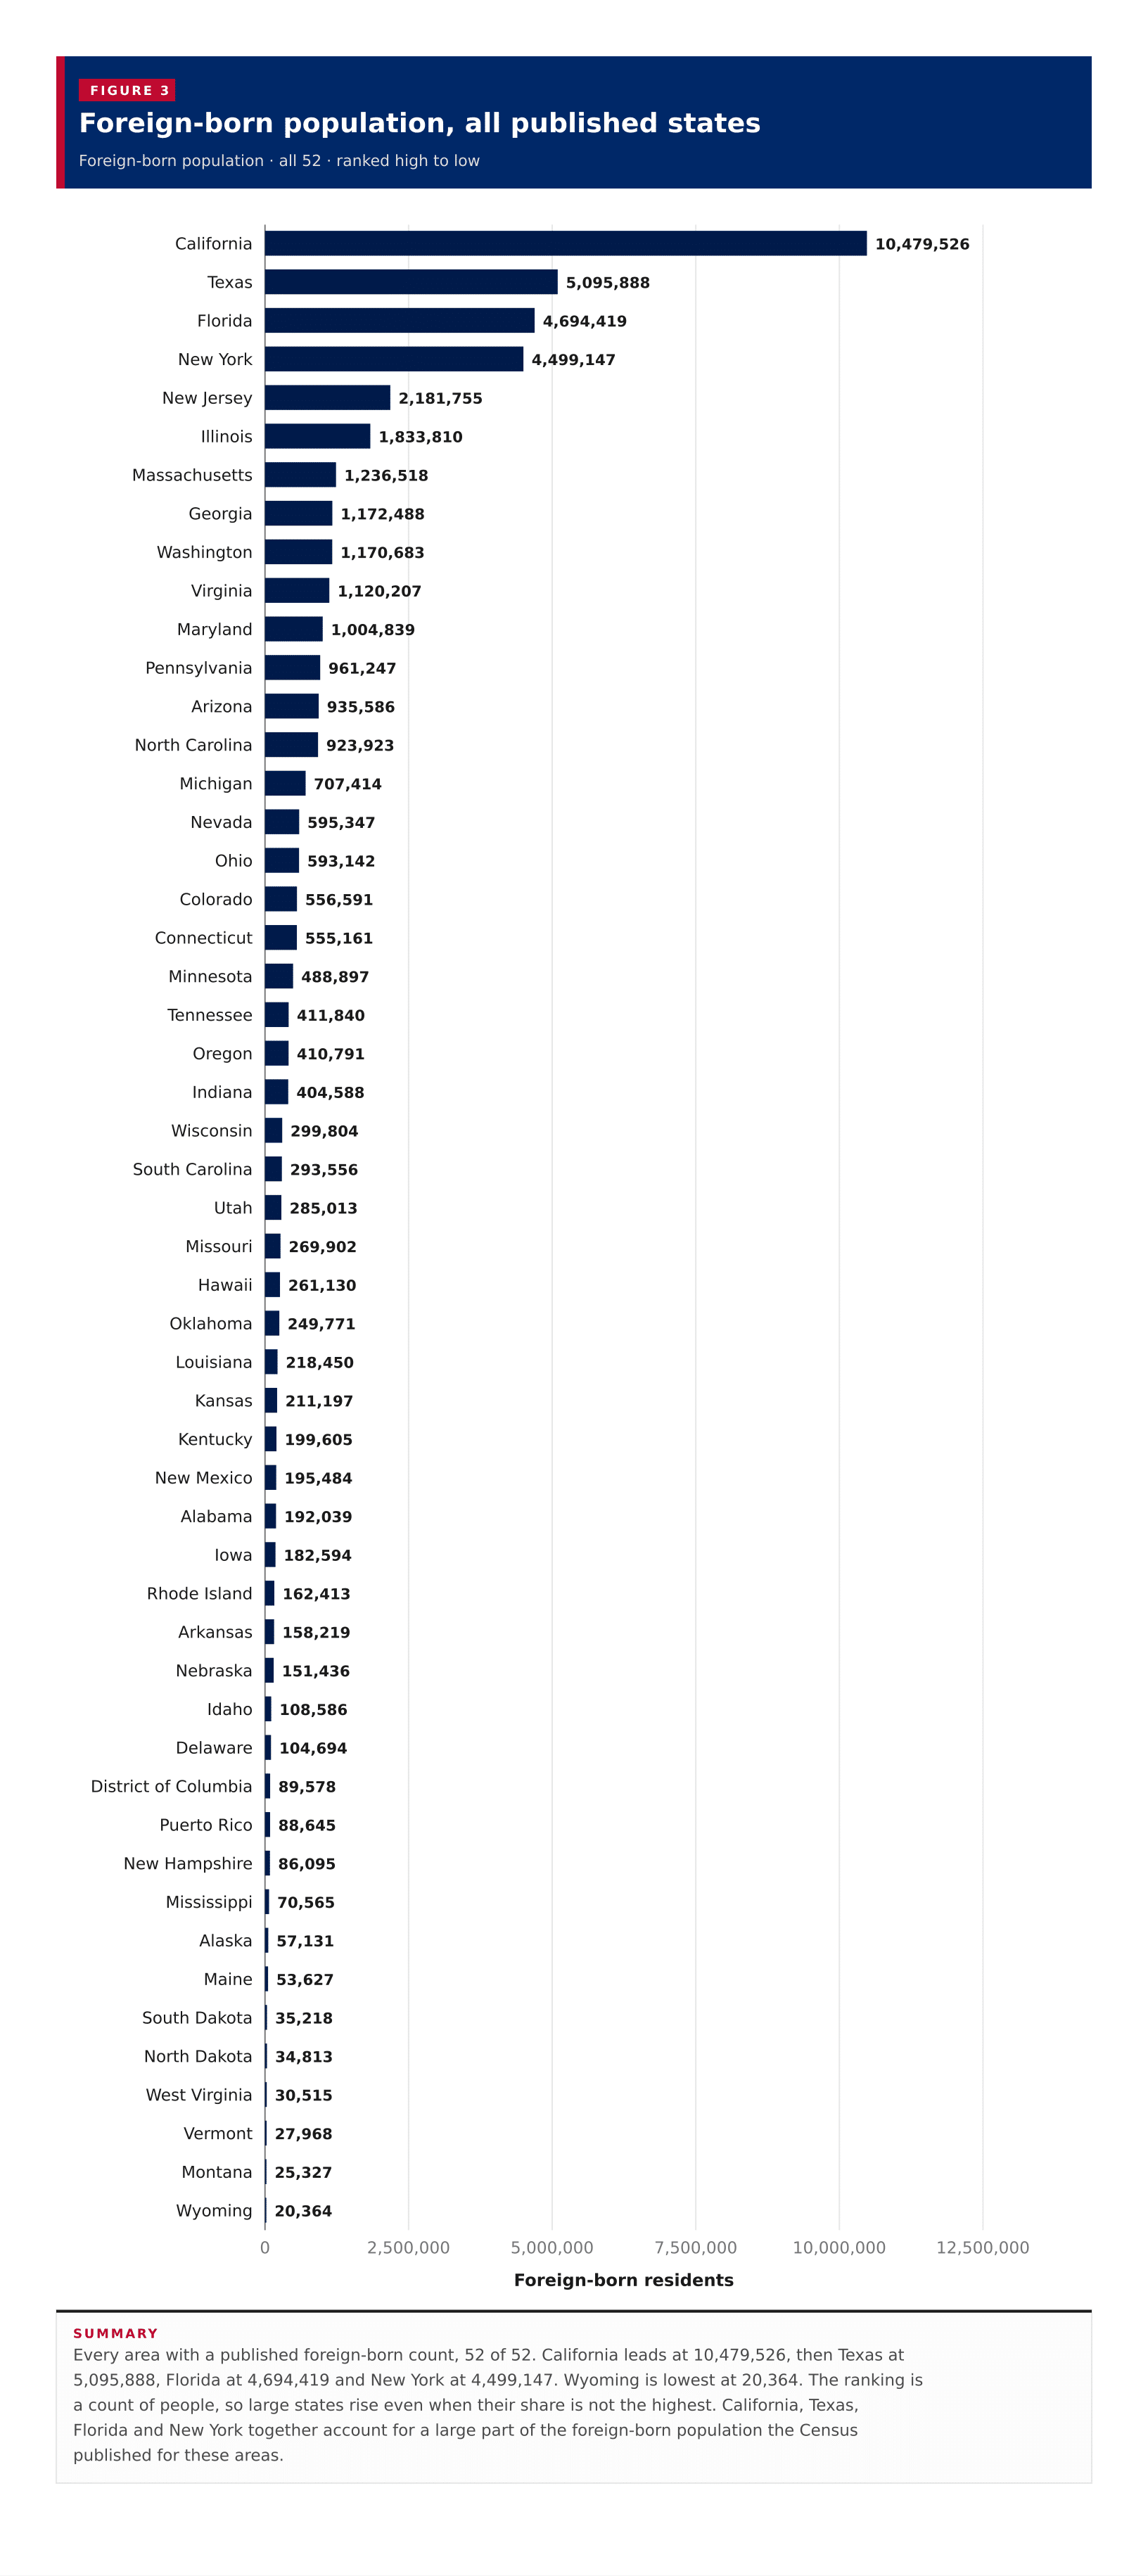
Foreign-born population, all published statesEvery area with a published foreign-born count, 52 of 52. California leads at 10,479,526, then Texas at 5,095,888, Florida at 4,694,419 and New York at 4,499,147. Wyoming is lowest at 20,364. The ranking is a count of people, so large states rise even when their share is not the highest. California, Texas, Florida and New York together account for a large part of the foreign-born population the Census published for these areas.02,500,0005,000,0007,500,00010,000,00012,500,000Foreign-born residents10,479,526California5,095,888Texas4,694,419Florida4,499,147New York2,181,755New Jersey1,833,810Illinois1,236,518Massachusetts1,172,488Georgia1,170,683Washington1,120,207Virginia1,004,839Maryland961,247Pennsylvania935,586Arizona923,923North Carolina707,414Michigan595,347Nevada593,142Ohio556,591Colorado555,161Connecticut488,897Minnesota411,840Tennessee410,791Oregon404,588Indiana299,804Wisconsin293,556South Carolina285,013Utah269,902Missouri261,130Hawaii249,771Oklahoma218,450Louisiana211,197Kansas199,605Kentucky195,484New Mexico192,039Alabama182,594Iowa162,413Rhode Island158,219Arkansas151,436Nebraska108,586Idaho104,694Delaware89,578District of Columbia88,645Puerto Rico86,095New Hampshire70,565Mississippi57,131Alaska53,627Maine35,218South Dakota34,813North Dakota30,515West Virginia27,968Vermont25,327Montana20,364Wyoming
Summary

Every area with a published foreign-born count, 52 of 52. California leads at 10,479,526, then Texas at 5,095,888, Florida at 4,694,419 and New York at 4,499,147. Wyoming is lowest at 20,364. The ranking is a count of people, so large states rise even when their share is not the highest. California, Texas, Florida and New York together account for a large part of the foreign-born population the Census published for these areas.

Figure 3

Share against foreign-born population

Foreign-born population against foreign-born share · one point per row, 52 of 52 plotted

52 items
View100%
DownloadPDFImageCSV
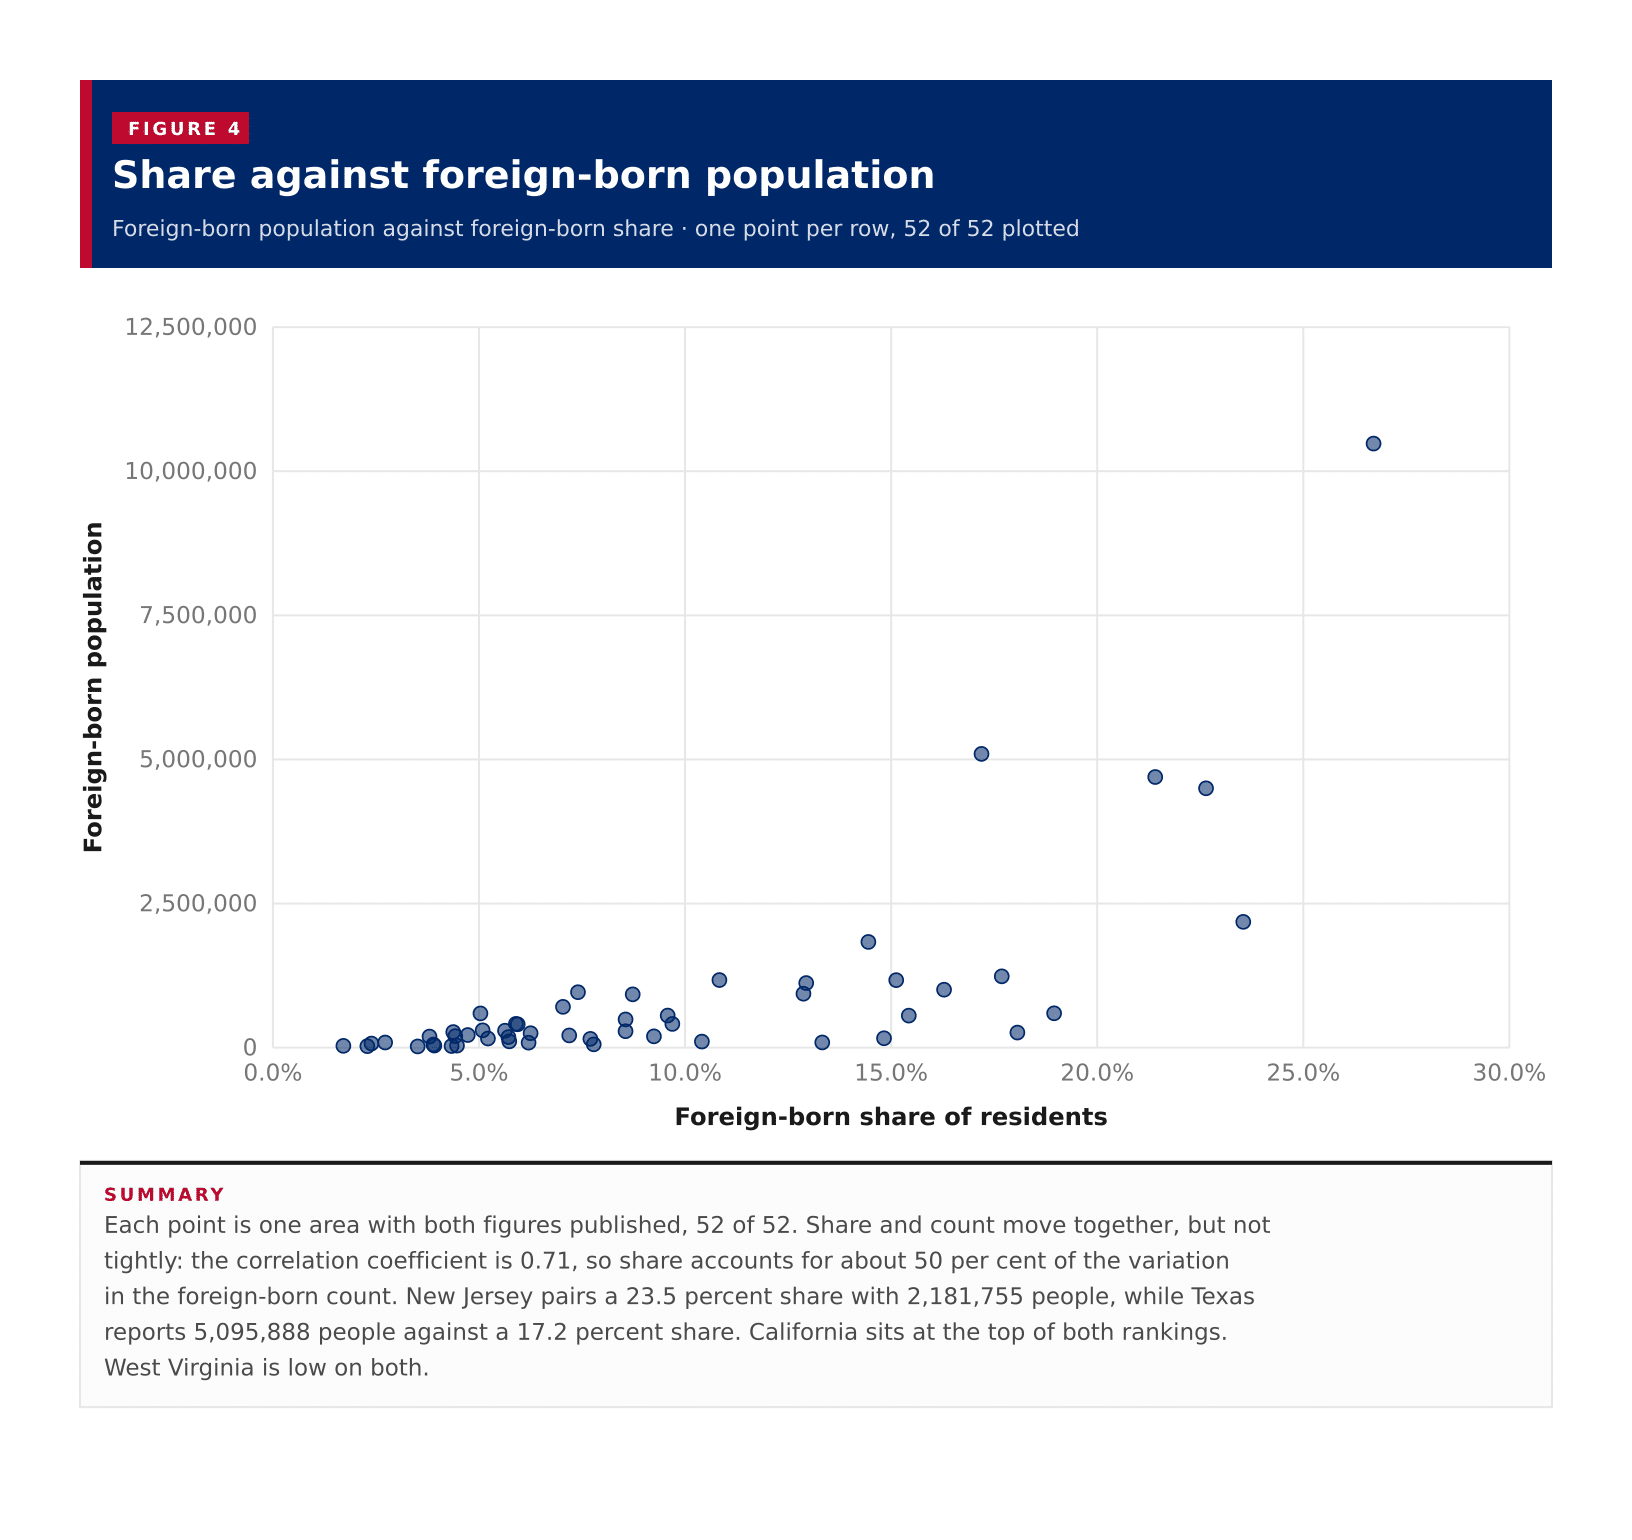
Share against foreign-born populationEach point is one area with both figures published, 52 of 52. Share and count move together, but not tightly: the correlation coefficient is 0.71, so share accounts for about 50 per cent of the variation in the foreign-born count. New Jersey pairs a 23.5 percent share with 2,181,755 people, while Texas reports 5,095,888 people against a 17.2 percent share. California sits at the top of both rankings. West Virginia is low on both.02,500,0005,000,0007,500,00010,000,00012,500,0000.0%5.0%10.0%15.0%20.0%25.0%30.0%Foreign-born populationForeign-born share of residents
Summary

Each point is one area with both figures published, 52 of 52. Share and count move together, but not tightly: the correlation coefficient is 0.71, so share accounts for about 50 per cent of the variation in the foreign-born count. New Jersey pairs a 23.5 percent share with 2,181,755 people, while Texas reports 5,095,888 people against a 17.2 percent share. California sits at the top of both rankings. West Virginia is low on both.

Table 1

All states

52 rows · 6 columns · sorted by foreign-born share, high to low

52 rows
View100%
DownloadPDFImageCSV
Summary

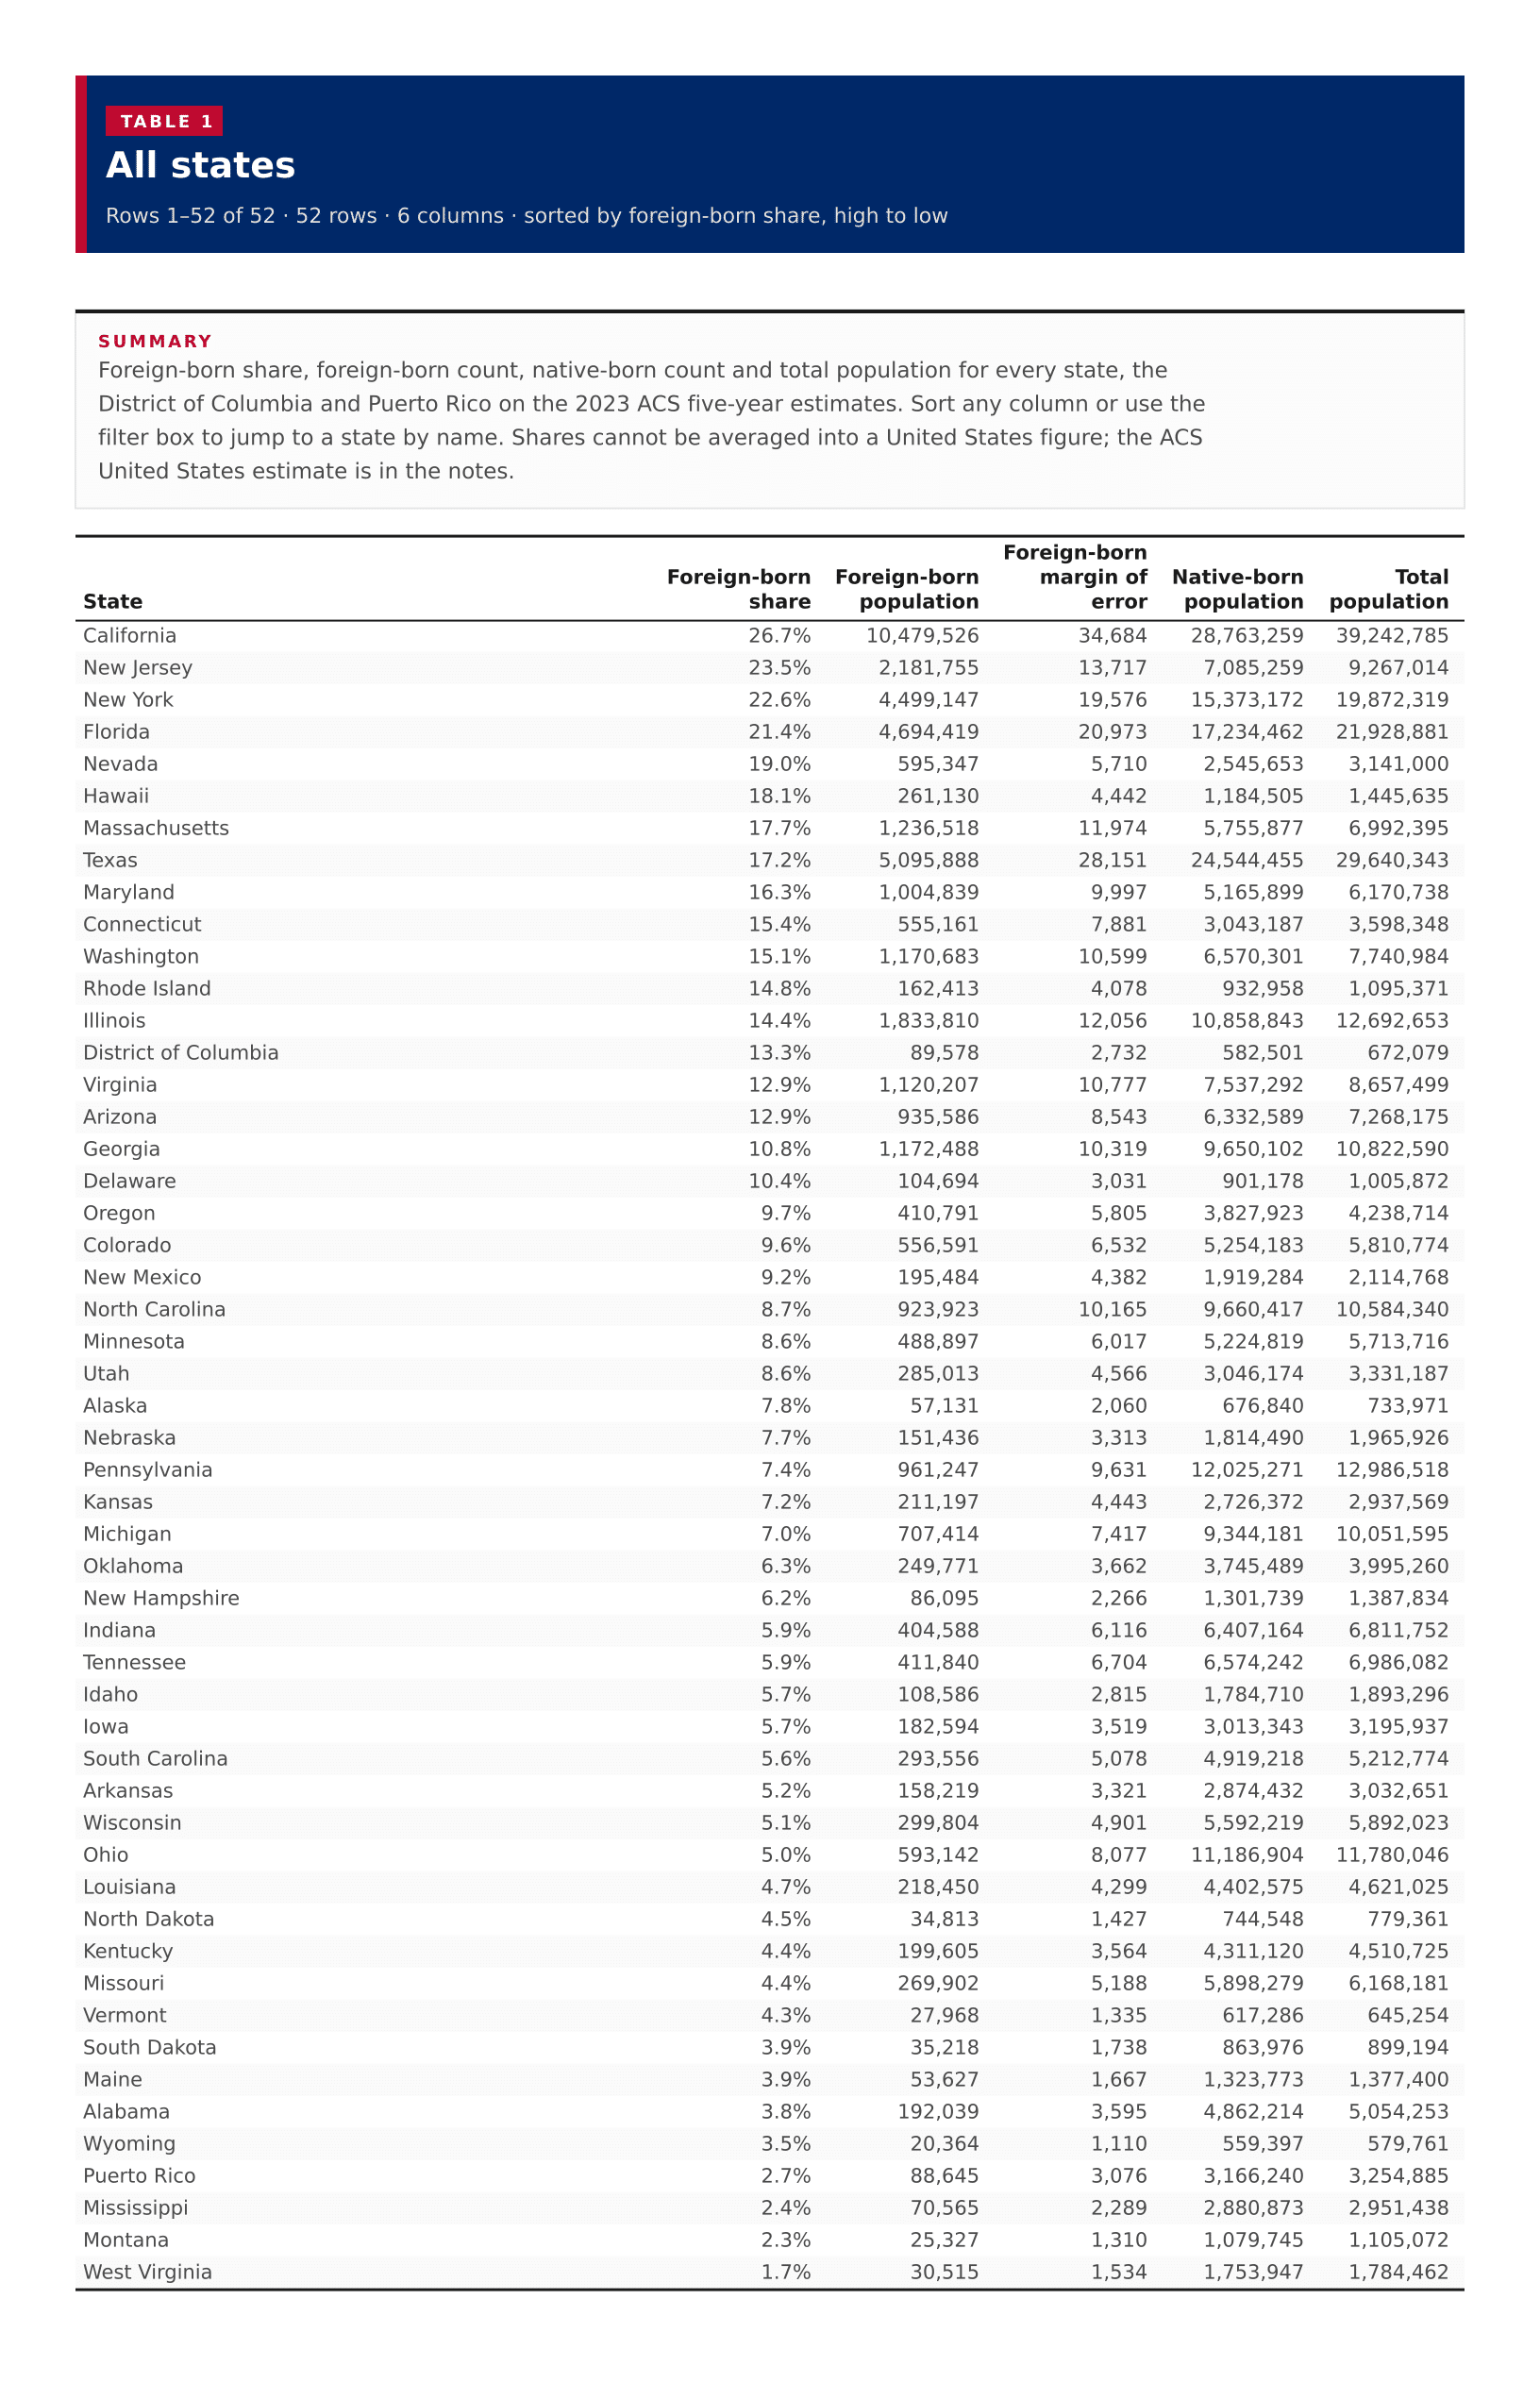
Foreign-born share, foreign-born count, native-born count and total population for every state, the District of Columbia and Puerto Rico on the 2023 ACS five-year estimates. Sort any column or use the filter box to jump to a state by name. Shares cannot be averaged into a United States figure; the ACS United States estimate is in the notes.

All states
?????
California26.7%10,479,52634,68428,763,25939,242,785
New Jersey23.5%2,181,75513,7177,085,2599,267,014
New York22.6%4,499,14719,57615,373,17219,872,319
Florida21.4%4,694,41920,97317,234,46221,928,881
Nevada19.0%595,3475,7102,545,6533,141,000
Hawaii18.1%261,1304,4421,184,5051,445,635
Massachusetts17.7%1,236,51811,9745,755,8776,992,395
Texas17.2%5,095,88828,15124,544,45529,640,343
Maryland16.3%1,004,8399,9975,165,8996,170,738
Connecticut15.4%555,1617,8813,043,1873,598,348
Washington15.1%1,170,68310,5996,570,3017,740,984
Rhode Island14.8%162,4134,078932,9581,095,371
Illinois14.4%1,833,81012,05610,858,84312,692,653
District of Columbia13.3%89,5782,732582,501672,079
Virginia12.9%1,120,20710,7777,537,2928,657,499
Arizona12.9%935,5868,5436,332,5897,268,175
Georgia10.8%1,172,48810,3199,650,10210,822,590
Delaware10.4%104,6943,031901,1781,005,872
Oregon9.7%410,7915,8053,827,9234,238,714
Colorado9.6%556,5916,5325,254,1835,810,774
New Mexico9.2%195,4844,3821,919,2842,114,768
North Carolina8.7%923,92310,1659,660,41710,584,340
Minnesota8.6%488,8976,0175,224,8195,713,716
Utah8.6%285,0134,5663,046,1743,331,187
Alaska7.8%57,1312,060676,840733,971
Nebraska7.7%151,4363,3131,814,4901,965,926
Pennsylvania7.4%961,2479,63112,025,27112,986,518
Kansas7.2%211,1974,4432,726,3722,937,569
Michigan7.0%707,4147,4179,344,18110,051,595
Oklahoma6.3%249,7713,6623,745,4893,995,260
New Hampshire6.2%86,0952,2661,301,7391,387,834
Indiana5.9%404,5886,1166,407,1646,811,752
Tennessee5.9%411,8406,7046,574,2426,986,082
Idaho5.7%108,5862,8151,784,7101,893,296
Iowa5.7%182,5943,5193,013,3433,195,937
South Carolina5.6%293,5565,0784,919,2185,212,774
Arkansas5.2%158,2193,3212,874,4323,032,651
Wisconsin5.1%299,8044,9015,592,2195,892,023
Ohio5.0%593,1428,07711,186,90411,780,046
Louisiana4.7%218,4504,2994,402,5754,621,025
North Dakota4.5%34,8131,427744,548779,361
Kentucky4.4%199,6053,5644,311,1204,510,725
Missouri4.4%269,9025,1885,898,2796,168,181
Vermont4.3%27,9681,335617,286645,254
South Dakota3.9%35,2181,738863,976899,194
Maine3.9%53,6271,6671,323,7731,377,400
Alabama3.8%192,0393,5954,862,2145,054,253
Wyoming3.5%20,3641,110559,397579,761
Puerto Rico2.7%88,6453,0763,166,2403,254,885
Mississippi2.4%70,5652,2892,880,8732,951,438
Montana2.3%25,3271,3101,079,7451,105,072
West Virginia1.7%30,5151,5341,753,9471,784,462

Image files

Download all

Figure 1

Foreign-born share of residents, US states

Figure 1: Foreign-born share of residents, US states
DownloadPDFImageCSV

Figure 2

Foreign-born share of residents, all published states

Figure 2: Foreign-born share of residents, all published states
DownloadPDFImageCSV

Figure 3

Foreign-born population, all published states

Figure 3: Foreign-born population, all published states
DownloadPDFImageCSV

Figure 4

Share against foreign-born population

Figure 4: Share against foreign-born population
DownloadPDFImageCSV

About this data

  • Foreign-born means born outside the United States, Puerto Rico and the U.S. Island Areas, and not born abroad of American parent(s). Native-born includes people born in the 50 states, the District of Columbia, Puerto Rico, the U.S. Island Areas, and those born abroad of American parent(s).
  • A state share is that area's foreign-born residents divided by that area's total population. The median of those shares is not a United States figure. The ACS United States estimate (50 states and the District of Columbia) is 13.9 percent, or 46,108,901 foreign-born residents out of 332,387,540.
  • Total population in this table is a controlled ACS estimate, so the Census does not publish a sampling margin of error for it (annotation *****). Native-born and foreign-born counts have 90 percent margins of error.
  • Puerto Rico is published in table B05012PR (Nativity in Puerto Rico), not B05012. The foreign-born definition is the same. None of the 52 areas had a suppressed foreign-born count.
  • Alaska and Hawaii appear in the ranking and table. On the map they are drawn as insets.