Child population by US state

Summary

Under-18 share, US states

Under-18 share by state · all 52 states · hover or tap a state for every figure on this page

52 items
View100%
DownloadPDFImageCSV
StatesUtah
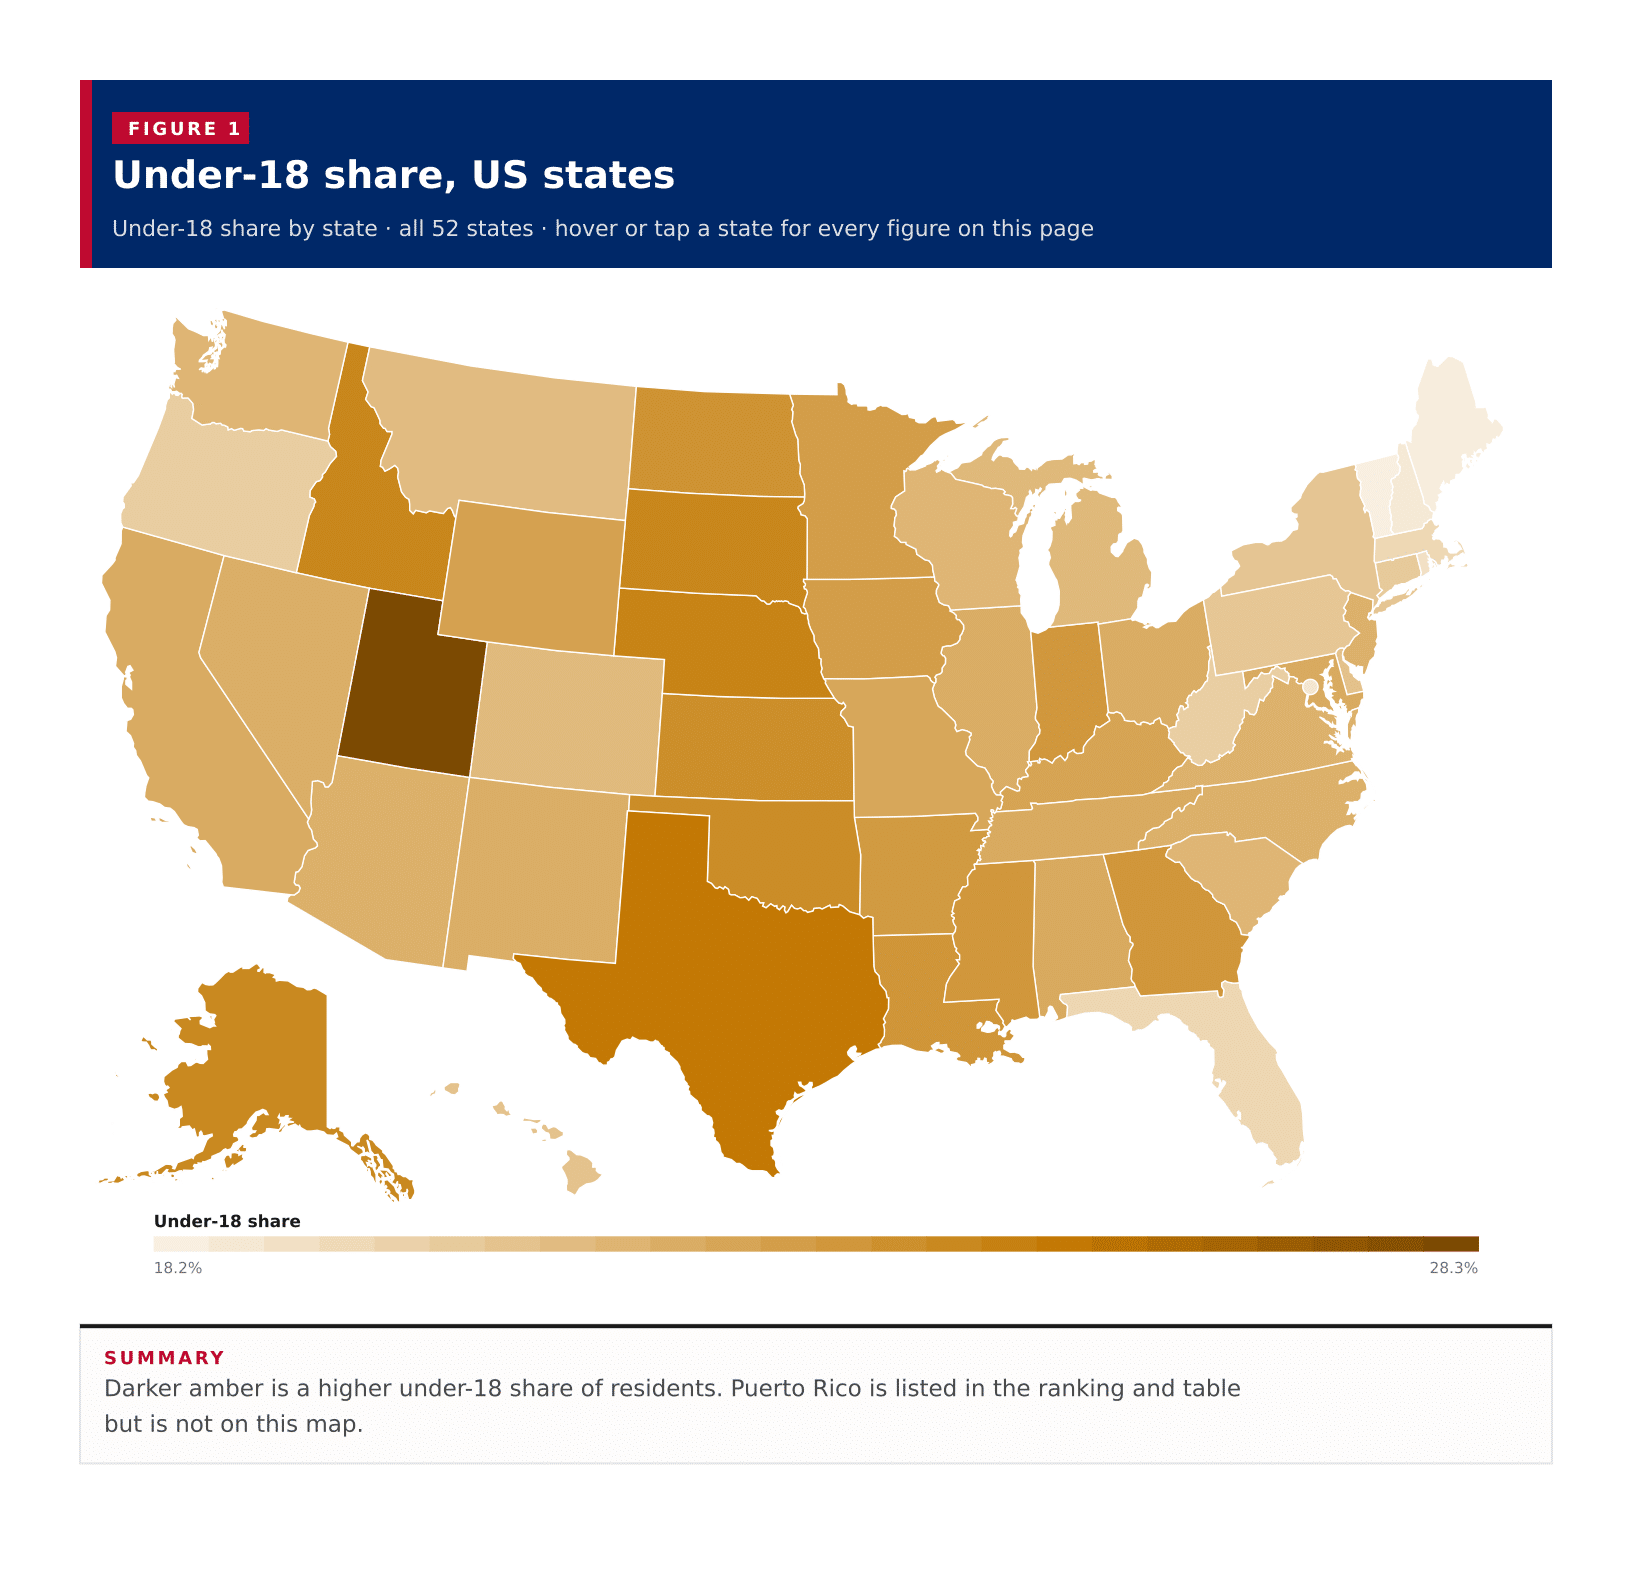
Under-18 share, US statesDarker amber is a higher under-18 share of residents. Puerto Rico is listed in the ranking and table but is not on this map.Alabama · Under-18 share: 22.3% · Under-18 population: 1,128,001 · Under-18 (margin of error): 5,163.2 · Total population: 5,054,253Alaska · Under-18 share: 24.3% · Under-18 population: 178,458 · Under-18 (margin of error): 1,783.3 · Total population: 733,971Arizona · Under-18 share: 21.9% · Under-18 population: 1,594,780 · Under-18 (margin of error): 5,502.6 · Total population: 7,268,175Arkansas · Under-18 share: 23.3% · Under-18 population: 705,879 · Under-18 (margin of error): 4,015.5 · Total population: 3,032,651California · Under-18 share: 22.2% · Under-18 population: 8,729,012 · Under-18 (margin of error): 15,161.9 · Total population: 39,242,785Colorado · Under-18 share: 21.4% · Under-18 population: 1,240,882 · Under-18 (margin of error): 5,000.5 · Total population: 5,810,774Connecticut · Under-18 share: 20.4% · Under-18 population: 733,998 · Under-18 (margin of error): 4,335.9 · Total population: 3,598,348Delaware · Under-18 share: 20.9% · Under-18 population: 210,396 · Under-18 (margin of error): 2,318.5 · Total population: 1,005,872Florida · Under-18 share: 19.6% · Under-18 population: 4,305,366 · Under-18 (margin of error): 11,840.5 · Total population: 21,928,881Georgia · Under-18 share: 23.5% · Under-18 population: 2,542,072 · Under-18 (margin of error): 9,422.4 · Total population: 10,822,590Hawaii · Under-18 share: 20.9% · Under-18 population: 301,472 · Under-18 (margin of error): 2,396.2 · Total population: 1,445,635Idaho · Under-18 share: 24.5% · Under-18 population: 463,167 · Under-18 (margin of error): 3,015.9 · Total population: 1,893,296Illinois · Under-18 share: 22.1% · Under-18 population: 2,808,879 · Under-18 (margin of error): 7,927.8 · Total population: 12,692,653Indiana · Under-18 share: 23.4% · Under-18 population: 1,596,071 · Under-18 (margin of error): 6,105.1 · Total population: 6,811,752Iowa · Under-18 share: 23.0% · Under-18 population: 736,579 · Under-18 (margin of error): 3,385.8 · Total population: 3,195,937Kansas · Under-18 share: 24.0% · Under-18 population: 704,821 · Under-18 (margin of error): 3,503.8 · Total population: 2,937,569Kentucky · Under-18 share: 22.7% · Under-18 population: 1,022,746 · Under-18 (margin of error): 5,026.0 · Total population: 4,510,725Louisiana · Under-18 share: 23.6% · Under-18 population: 1,088,663 · Under-18 (margin of error): 5,129.9 · Total population: 4,621,025Maine · Under-18 share: 18.3% · Under-18 population: 251,882 · Under-18 (margin of error): 2,213.4 · Total population: 1,377,400Maryland · Under-18 share: 22.3% · Under-18 population: 1,375,936 · Under-18 (margin of error): 5,721.9 · Total population: 6,170,738Massachusetts · Under-18 share: 19.6% · Under-18 population: 1,368,408 · Under-18 (margin of error): 5,251.1 · Total population: 6,992,395Michigan · Under-18 share: 21.4% · Under-18 population: 2,154,793 · Under-18 (margin of error): 6,078.0 · Total population: 10,051,595Minnesota · Under-18 share: 23.1% · Under-18 population: 1,317,259 · Under-18 (margin of error): 4,630.8 · Total population: 5,713,716Mississippi · Under-18 share: 23.5% · Under-18 population: 692,335 · Under-18 (margin of error): 4,497.5 · Total population: 2,951,438Missouri · Under-18 share: 22.5% · Under-18 population: 1,386,571 · Under-18 (margin of error): 5,759.7 · Total population: 6,168,181Montana · Under-18 share: 21.3% · Under-18 population: 234,942 · Under-18 (margin of error): 2,092.3 · Total population: 1,105,072Nebraska · Under-18 share: 24.7% · Under-18 population: 484,750 · Under-18 (margin of error): 2,756.8 · Total population: 1,965,926Nevada · Under-18 share: 22.1% · Under-18 population: 692,871 · Under-18 (margin of error): 4,076.9 · Total population: 3,141,000New Hampshire · Under-18 share: 18.5% · Under-18 population: 256,906 · Under-18 (margin of error): 2,332.0 · Total population: 1,387,834New Jersey · Under-18 share: 21.9% · Under-18 population: 2,031,322 · Under-18 (margin of error): 6,405.2 · Total population: 9,267,014New Mexico · Under-18 share: 22.1% · Under-18 population: 466,617 · Under-18 (margin of error): 3,330.1 · Total population: 2,114,768New York · Under-18 share: 20.7% · Under-18 population: 4,109,277 · Under-18 (margin of error): 9,188.1 · Total population: 19,872,319North Carolina · Under-18 share: 21.9% · Under-18 population: 2,322,823 · Under-18 (margin of error): 7,789.9 · Total population: 10,584,340North Dakota · Under-18 share: 23.7% · Under-18 population: 184,792 · Under-18 (margin of error): 2,068.3 · Total population: 779,361Ohio · Under-18 share: 22.2% · Under-18 population: 2,610,179 · Under-18 (margin of error): 7,994.4 · Total population: 11,780,046Oklahoma · Under-18 share: 24.1% · Under-18 population: 963,383 · Under-18 (margin of error): 3,889.5 · Total population: 3,995,260Oregon · Under-18 share: 20.2% · Under-18 population: 856,294 · Under-18 (margin of error): 4,062.8 · Total population: 4,238,714Pennsylvania · Under-18 share: 20.6% · Under-18 population: 2,673,811 · Under-18 (margin of error): 6,328.6 · Total population: 12,986,518Rhode Island · Under-18 share: 19.0% · Under-18 population: 208,480 · Under-18 (margin of error): 2,626.8 · Total population: 1,095,371South Carolina · Under-18 share: 21.6% · Under-18 population: 1,127,062 · Under-18 (margin of error): 5,769.5 · Total population: 5,212,774South Dakota · Under-18 share: 24.4% · Under-18 population: 219,820 · Under-18 (margin of error): 2,110.7 · Total population: 899,194Tennessee · Under-18 share: 22.3% · Under-18 population: 1,558,006 · Under-18 (margin of error): 6,041.4 · Total population: 6,986,082Texas · Under-18 share: 25.2% · Under-18 population: 7,482,530 · Under-18 (margin of error): 16,484.7 · Total population: 29,640,343Utah · Under-18 share: 28.3% · Under-18 population: 944,132 · Under-18 (margin of error): 4,211.1 · Total population: 3,331,187Vermont · Under-18 share: 18.2% · Under-18 population: 117,177 · Under-18 (margin of error): 1,220.4 · Total population: 645,254Virginia · Under-18 share: 21.9% · Under-18 population: 1,893,985 · Under-18 (margin of error): 6,330.5 · Total population: 8,657,499Washington · Under-18 share: 21.6% · Under-18 population: 1,675,898 · Under-18 (margin of error): 5,508.8 · Total population: 7,740,984West Virginia · Under-18 share: 20.1% · Under-18 population: 359,411 · Under-18 (margin of error): 2,810.8 · Total population: 1,784,462Wisconsin · Under-18 share: 21.6% · Under-18 population: 1,274,310 · Under-18 (margin of error): 4,195.2 · Total population: 5,892,023Wyoming · Under-18 share: 22.8% · Under-18 population: 132,359 · Under-18 (margin of error): 1,682.2 · Total population: 579,761District of Columbia · Under-18 share: 18.7% · Under-18 population: 125,675 · Under-18 (margin of error): 1,993.0 · Total population: 672,079District of Columbia · Under-18 share: 18.7% · Under-18 population: 125,675 · Under-18 (margin of error): 1,993.0 · Total population: 672,079Under-18 share18.2%28.3%
Summary

Darker amber is a higher under-18 share of residents. Puerto Rico is listed in the ranking and table but is not on this map.

Utah has the highest under-18 share of the 50 states on the 2023 ACS five-year estimates: 28.3 percent of residents are under 18, ahead of the typical published area at 22.1 percent. Vermont is the lowest of the 50 states at 18.2 percent. Puerto Rico, which this table also returns, is the lowest published figure at 16.7 percent. California has the largest under-18 population in count, 8,729,012 people (22.2 percent of residents). The District of Columbia sits at 18.7 percent. Under-18 here means both sexes in the Census age groups under 18 from table B01001, not median age and not child poverty.

In short

22.1%typical published areathe middle share, not a US average
28.3%Utahhighest under-18 share of the 50 states
8,729,012Californialargest under-18 population
18.2%Vermontlowest share of the 50 states
16.7%Puerto Ricolowest figure the Census published
Figure 1

Under-18 share, all published states

Under-18 share · all 52 · ranked high to low

52 items
View100%
DownloadPDFImageCSV
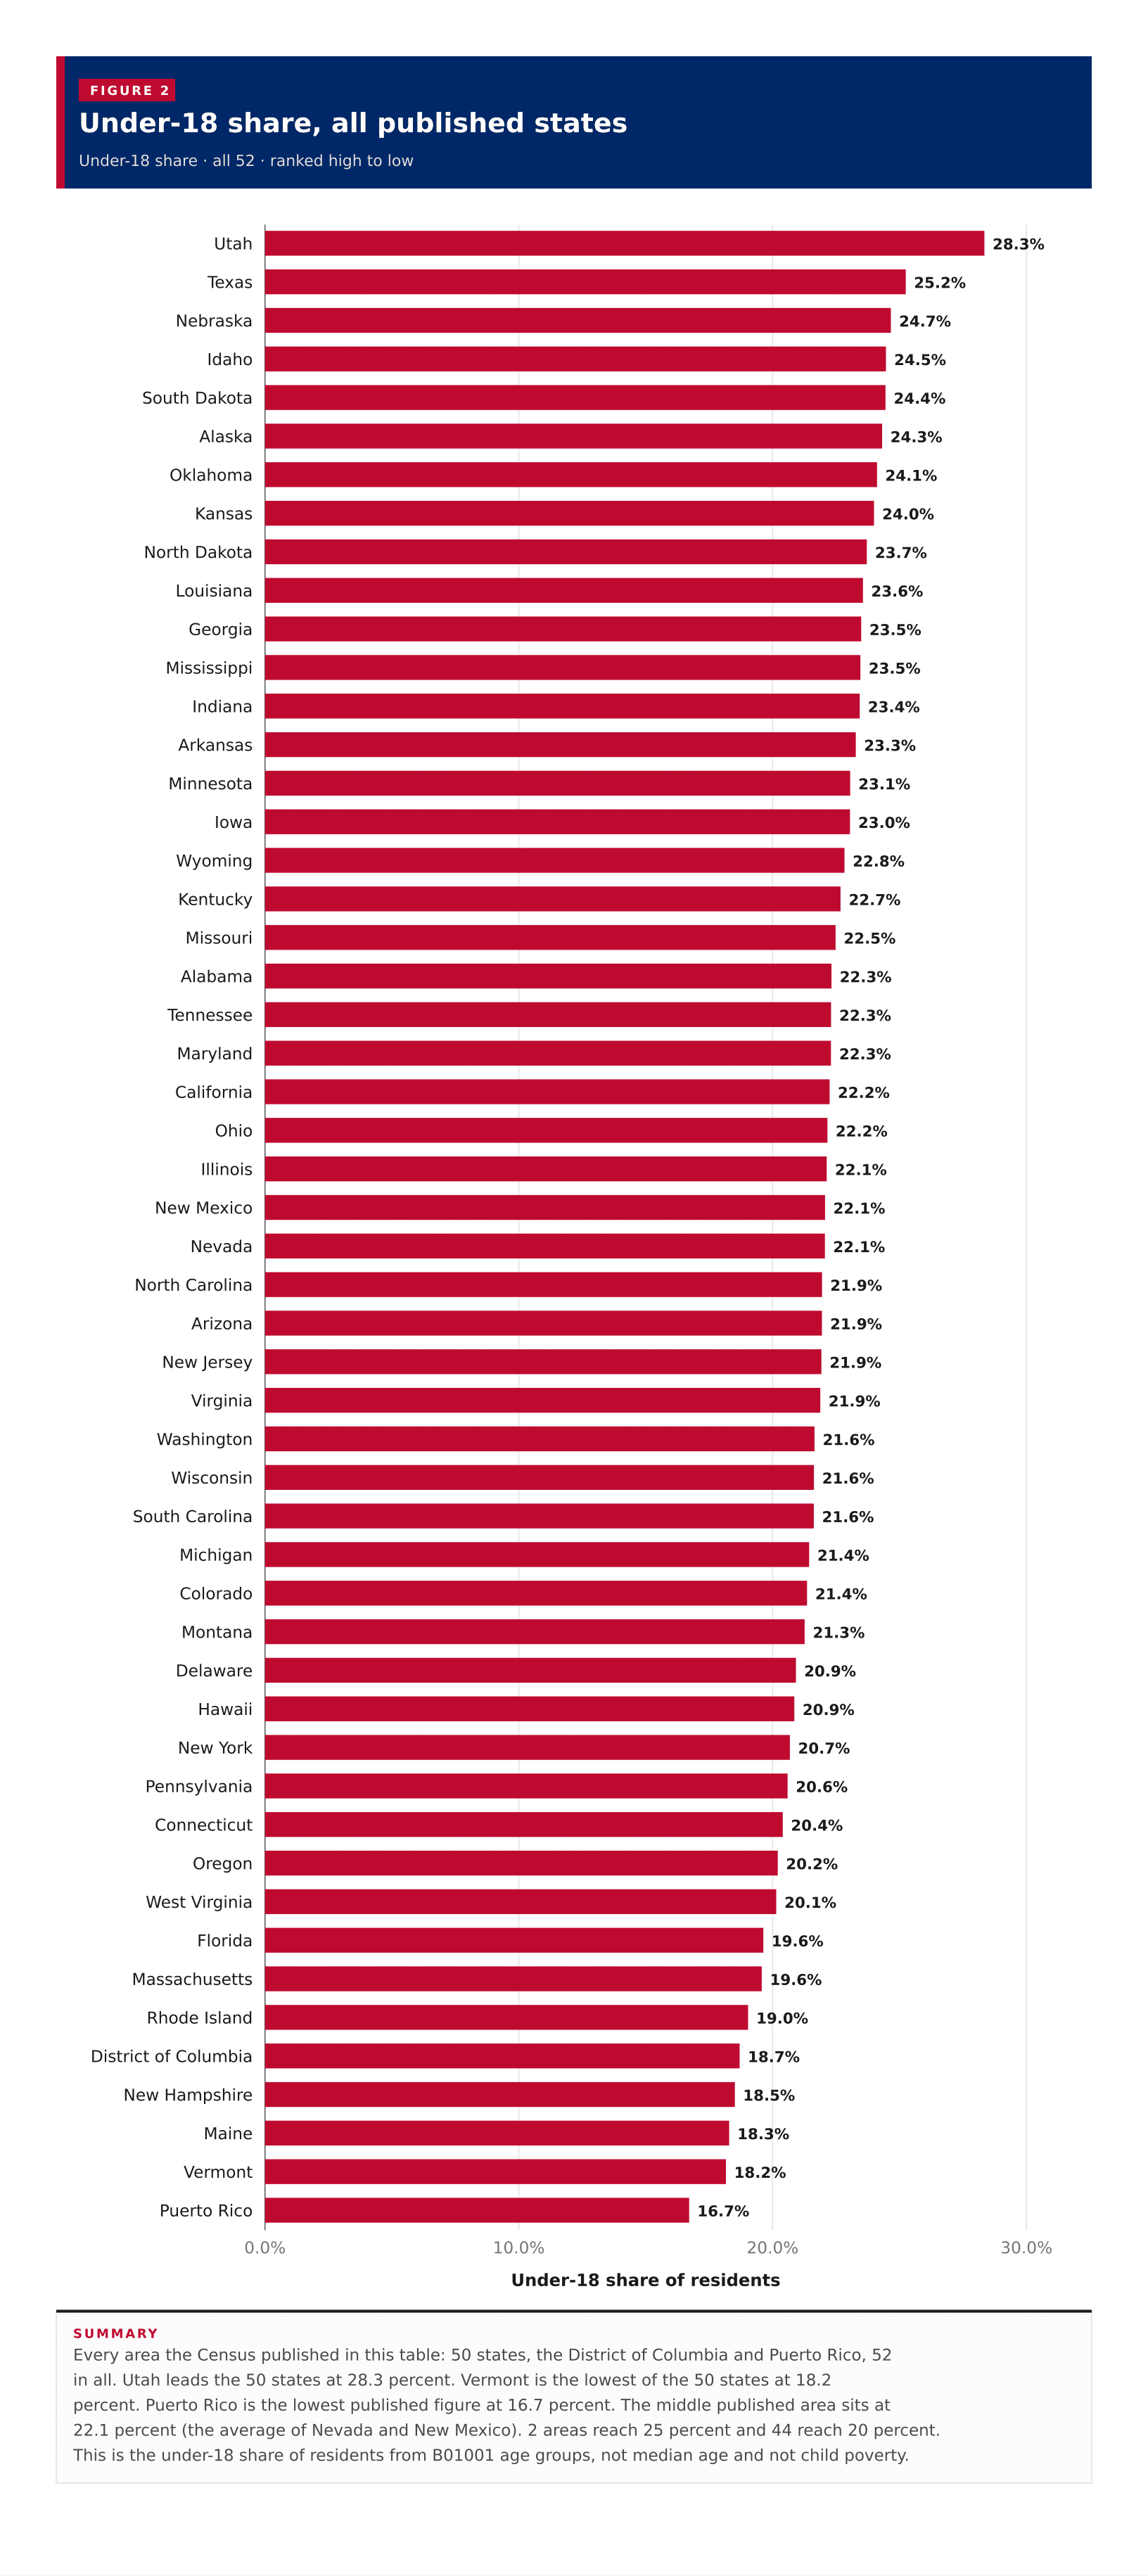
Under-18 share, all published statesEvery area the Census published in this table: 50 states, the District of Columbia and Puerto Rico, 52 in all. Utah leads the 50 states at 28.3 percent. Vermont is the lowest of the 50 states at 18.2 percent. Puerto Rico is the lowest published figure at 16.7 percent. The middle published area sits at 22.1 percent (the average of Nevada and New Mexico). 2 areas reach 25 percent and 44 reach 20 percent. This is the under-18 share of residents from B01001 age groups, not median age and not child poverty.0.0%10.0%20.0%30.0%Under-18 share of residents28.3%Utah25.2%Texas24.7%Nebraska24.5%Idaho24.4%South Dakota24.3%Alaska24.1%Oklahoma24.0%Kansas23.7%North Dakota23.6%Louisiana23.5%Georgia23.5%Mississippi23.4%Indiana23.3%Arkansas23.1%Minnesota23.0%Iowa22.8%Wyoming22.7%Kentucky22.5%Missouri22.3%Alabama22.3%Tennessee22.3%Maryland22.2%California22.2%Ohio22.1%Illinois22.1%New Mexico22.1%Nevada21.9%North Carolina21.9%Arizona21.9%New Jersey21.9%Virginia21.6%Washington21.6%Wisconsin21.6%South Carolina21.4%Michigan21.4%Colorado21.3%Montana20.9%Delaware20.9%Hawaii20.7%New York20.6%Pennsylvania20.4%Connecticut20.2%Oregon20.1%West Virginia19.6%Florida19.6%Massachusetts19.0%Rhode Island18.7%District of Columbia18.5%New Hampshire18.3%Maine18.2%Vermont16.7%Puerto Rico
Summary

Every area the Census published in this table: 50 states, the District of Columbia and Puerto Rico, 52 in all. Utah leads the 50 states at 28.3 percent. Vermont is the lowest of the 50 states at 18.2 percent. Puerto Rico is the lowest published figure at 16.7 percent. The middle published area sits at 22.1 percent (the average of Nevada and New Mexico). 2 areas reach 25 percent and 44 reach 20 percent. This is the under-18 share of residents from B01001 age groups, not median age and not child poverty.

Figure 2

Under-18 population, all published states

Under-18 population · all 52 · ranked high to low

52 items
View100%
DownloadPDFImageCSV
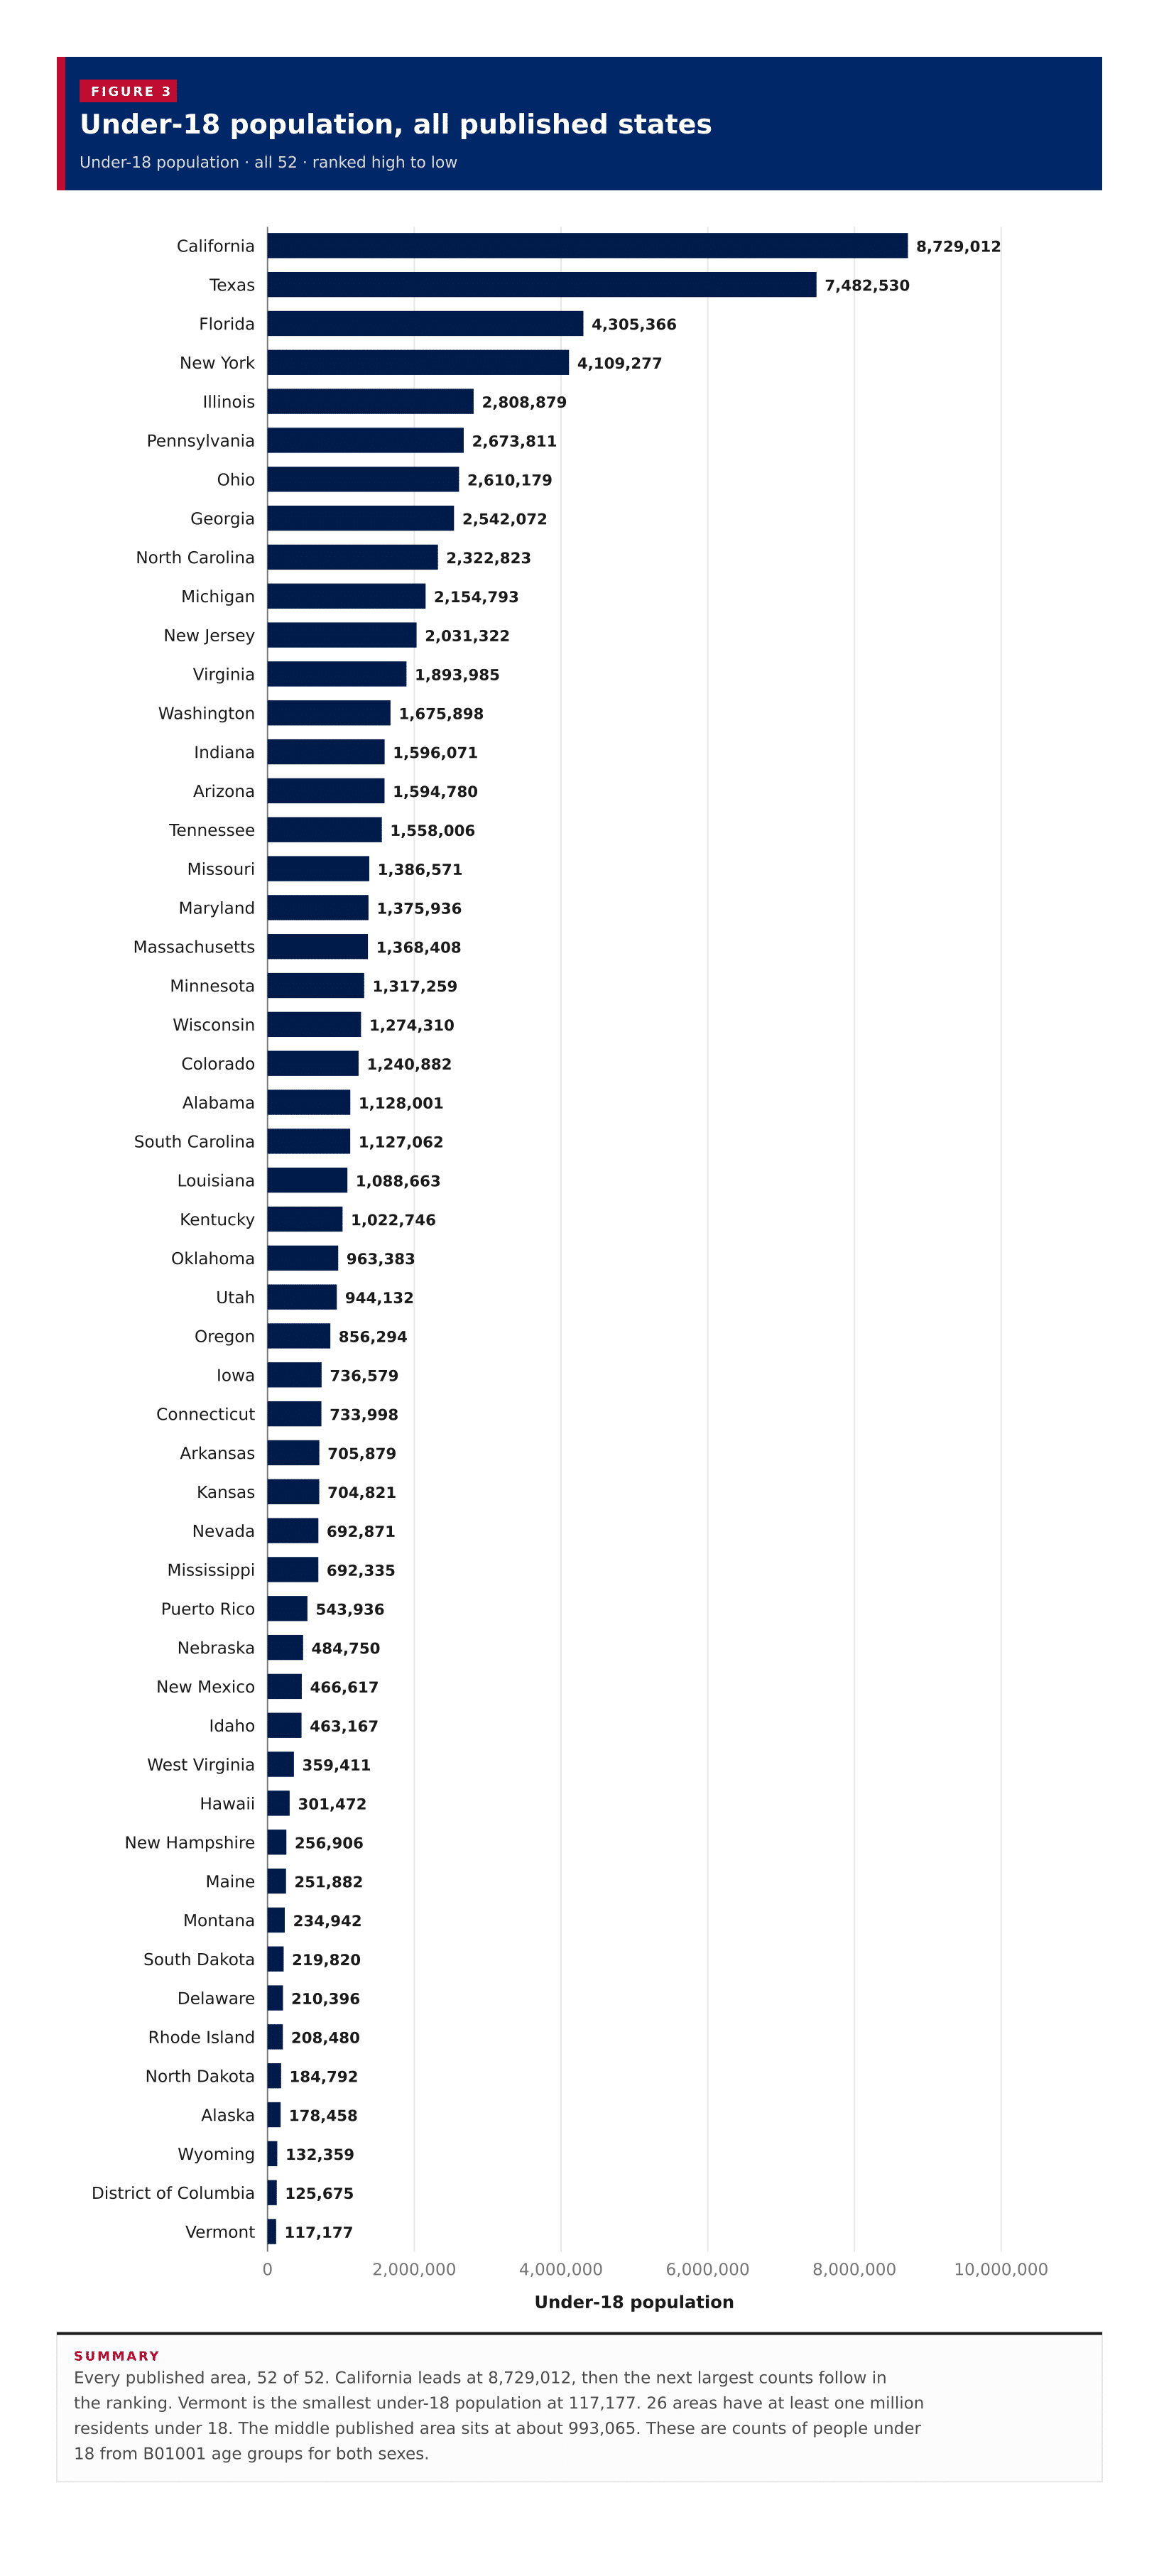
Under-18 population, all published statesEvery published area, 52 of 52. California leads at 8,729,012, then the next largest counts follow in the ranking. Vermont is the smallest under-18 population at 117,177. 26 areas have at least one million residents under 18. The middle published area sits at about 993,065. These are counts of people under 18 from B01001 age groups for both sexes.02,000,0004,000,0006,000,0008,000,00010,000,000Under-18 population8,729,012California7,482,530Texas4,305,366Florida4,109,277New York2,808,879Illinois2,673,811Pennsylvania2,610,179Ohio2,542,072Georgia2,322,823North Carolina2,154,793Michigan2,031,322New Jersey1,893,985Virginia1,675,898Washington1,596,071Indiana1,594,780Arizona1,558,006Tennessee1,386,571Missouri1,375,936Maryland1,368,408Massachusetts1,317,259Minnesota1,274,310Wisconsin1,240,882Colorado1,128,001Alabama1,127,062South Carolina1,088,663Louisiana1,022,746Kentucky963,383Oklahoma944,132Utah856,294Oregon736,579Iowa733,998Connecticut705,879Arkansas704,821Kansas692,871Nevada692,335Mississippi543,936Puerto Rico484,750Nebraska466,617New Mexico463,167Idaho359,411West Virginia301,472Hawaii256,906New Hampshire251,882Maine234,942Montana219,820South Dakota210,396Delaware208,480Rhode Island184,792North Dakota178,458Alaska132,359Wyoming125,675District of Columbia117,177Vermont
Summary

Every published area, 52 of 52. California leads at 8,729,012, then the next largest counts follow in the ranking. Vermont is the smallest under-18 population at 117,177. 26 areas have at least one million residents under 18. The middle published area sits at about 993,065. These are counts of people under 18 from B01001 age groups for both sexes.

Figure 3

Under-18 population against under-18 share

Under-18 share against under-18 population · one point per row, 52 of 52 plotted

52 items
View100%
DownloadPDFImageCSV
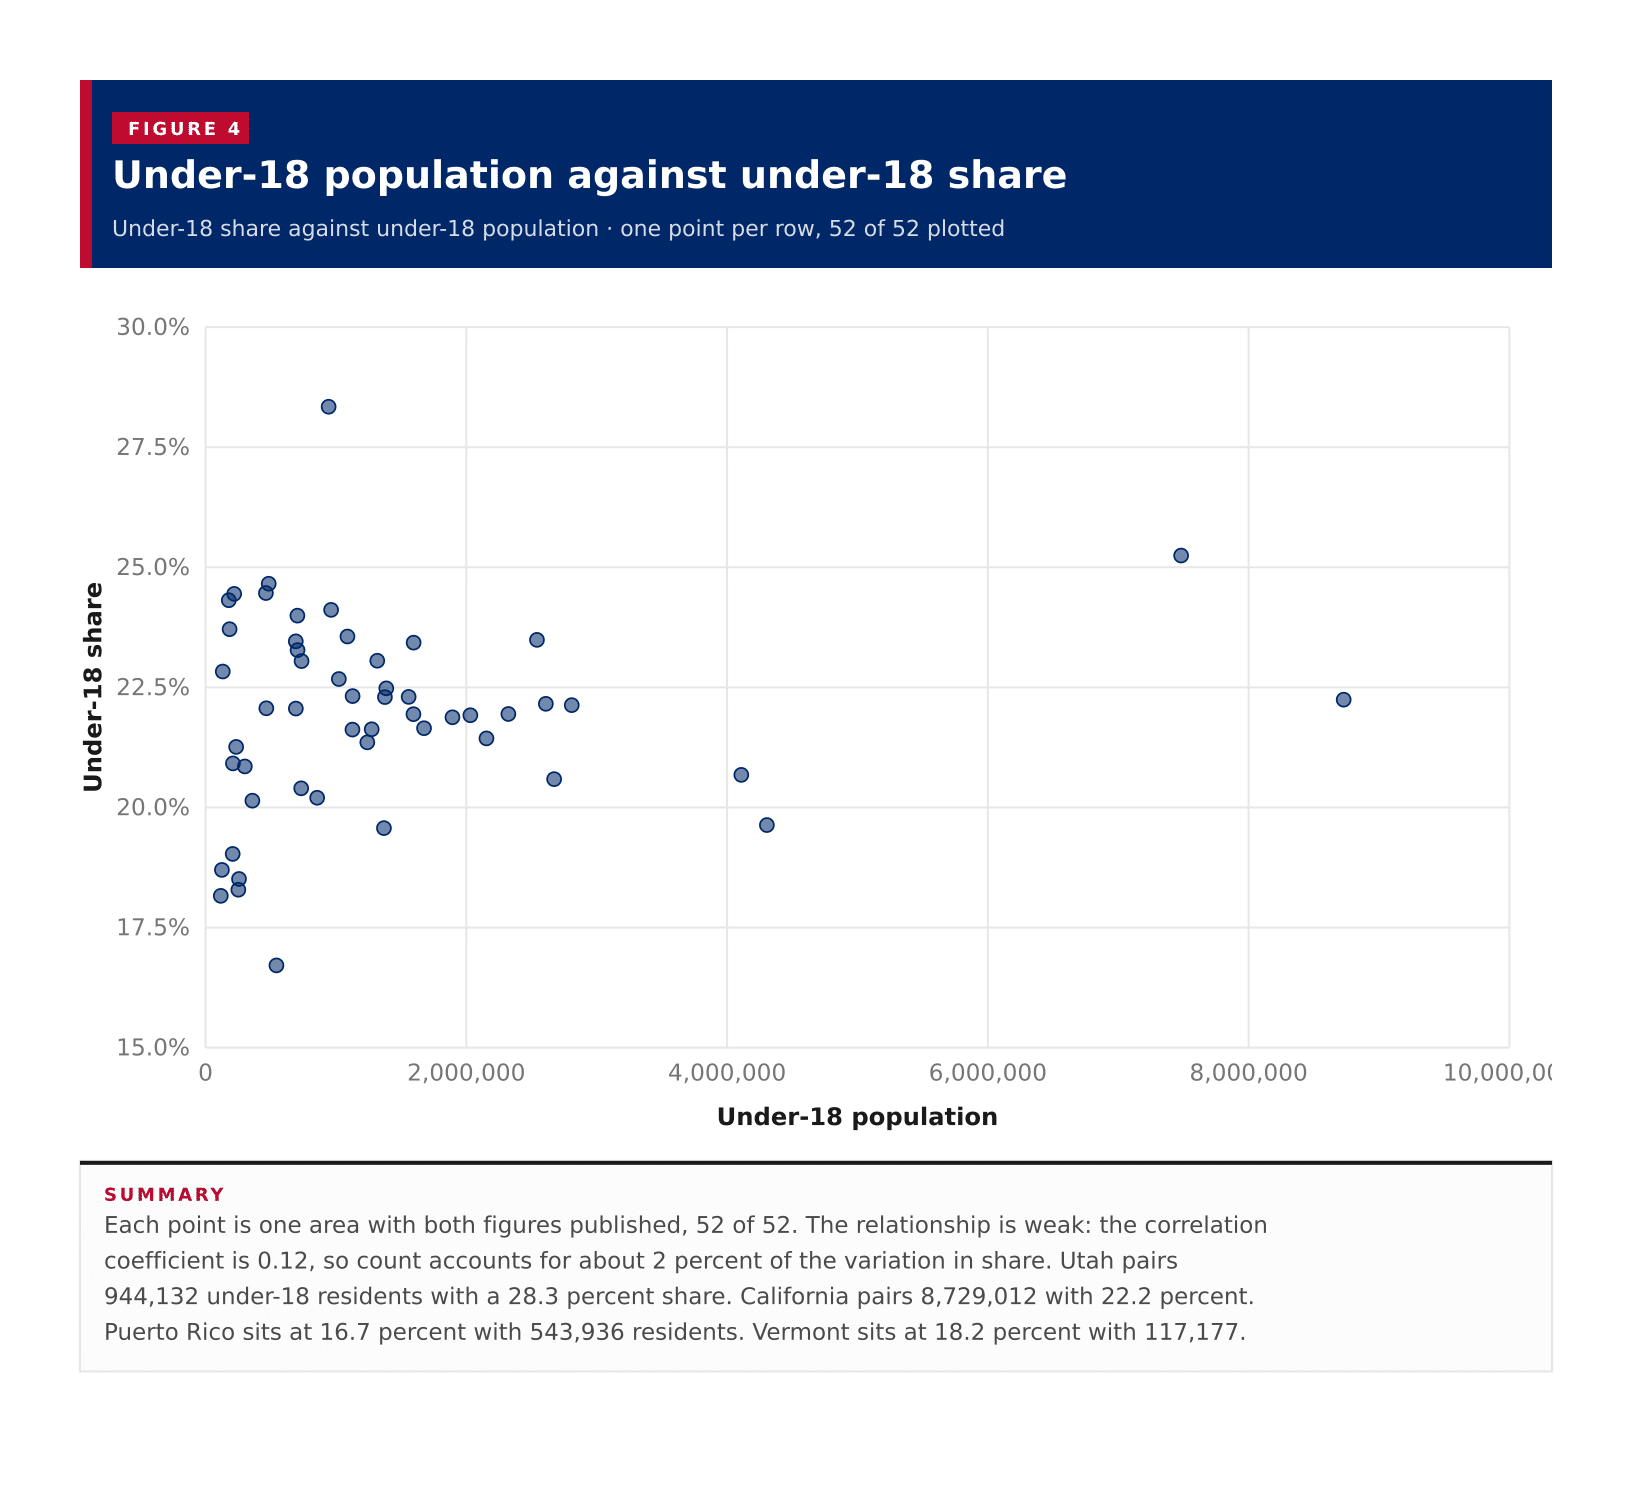
Under-18 population against under-18 shareEach point is one area with both figures published, 52 of 52. The relationship is weak: the correlation coefficient is 0.12, so count accounts for about 2 percent of the variation in share. Utah pairs 944,132 under-18 residents with a 28.3 percent share. California pairs 8,729,012 with 22.2 percent. Puerto Rico sits at 16.7 percent with 543,936 residents. Vermont sits at 18.2 percent with 117,177.15.0%17.5%20.0%22.5%25.0%27.5%30.0%02,000,0004,000,0006,000,0008,000,00010,000,000Under-18 shareUnder-18 population
Summary

Each point is one area with both figures published, 52 of 52. The relationship is weak: the correlation coefficient is 0.12, so count accounts for about 2 percent of the variation in share. Utah pairs 944,132 under-18 residents with a 28.3 percent share. California pairs 8,729,012 with 22.2 percent. Puerto Rico sits at 16.7 percent with 543,936 residents. Vermont sits at 18.2 percent with 117,177.

Table 1

All states

52 rows · 5 columns · sorted by under-18 share, high to low

52 rows
View100%
DownloadPDFImageCSV
Summary

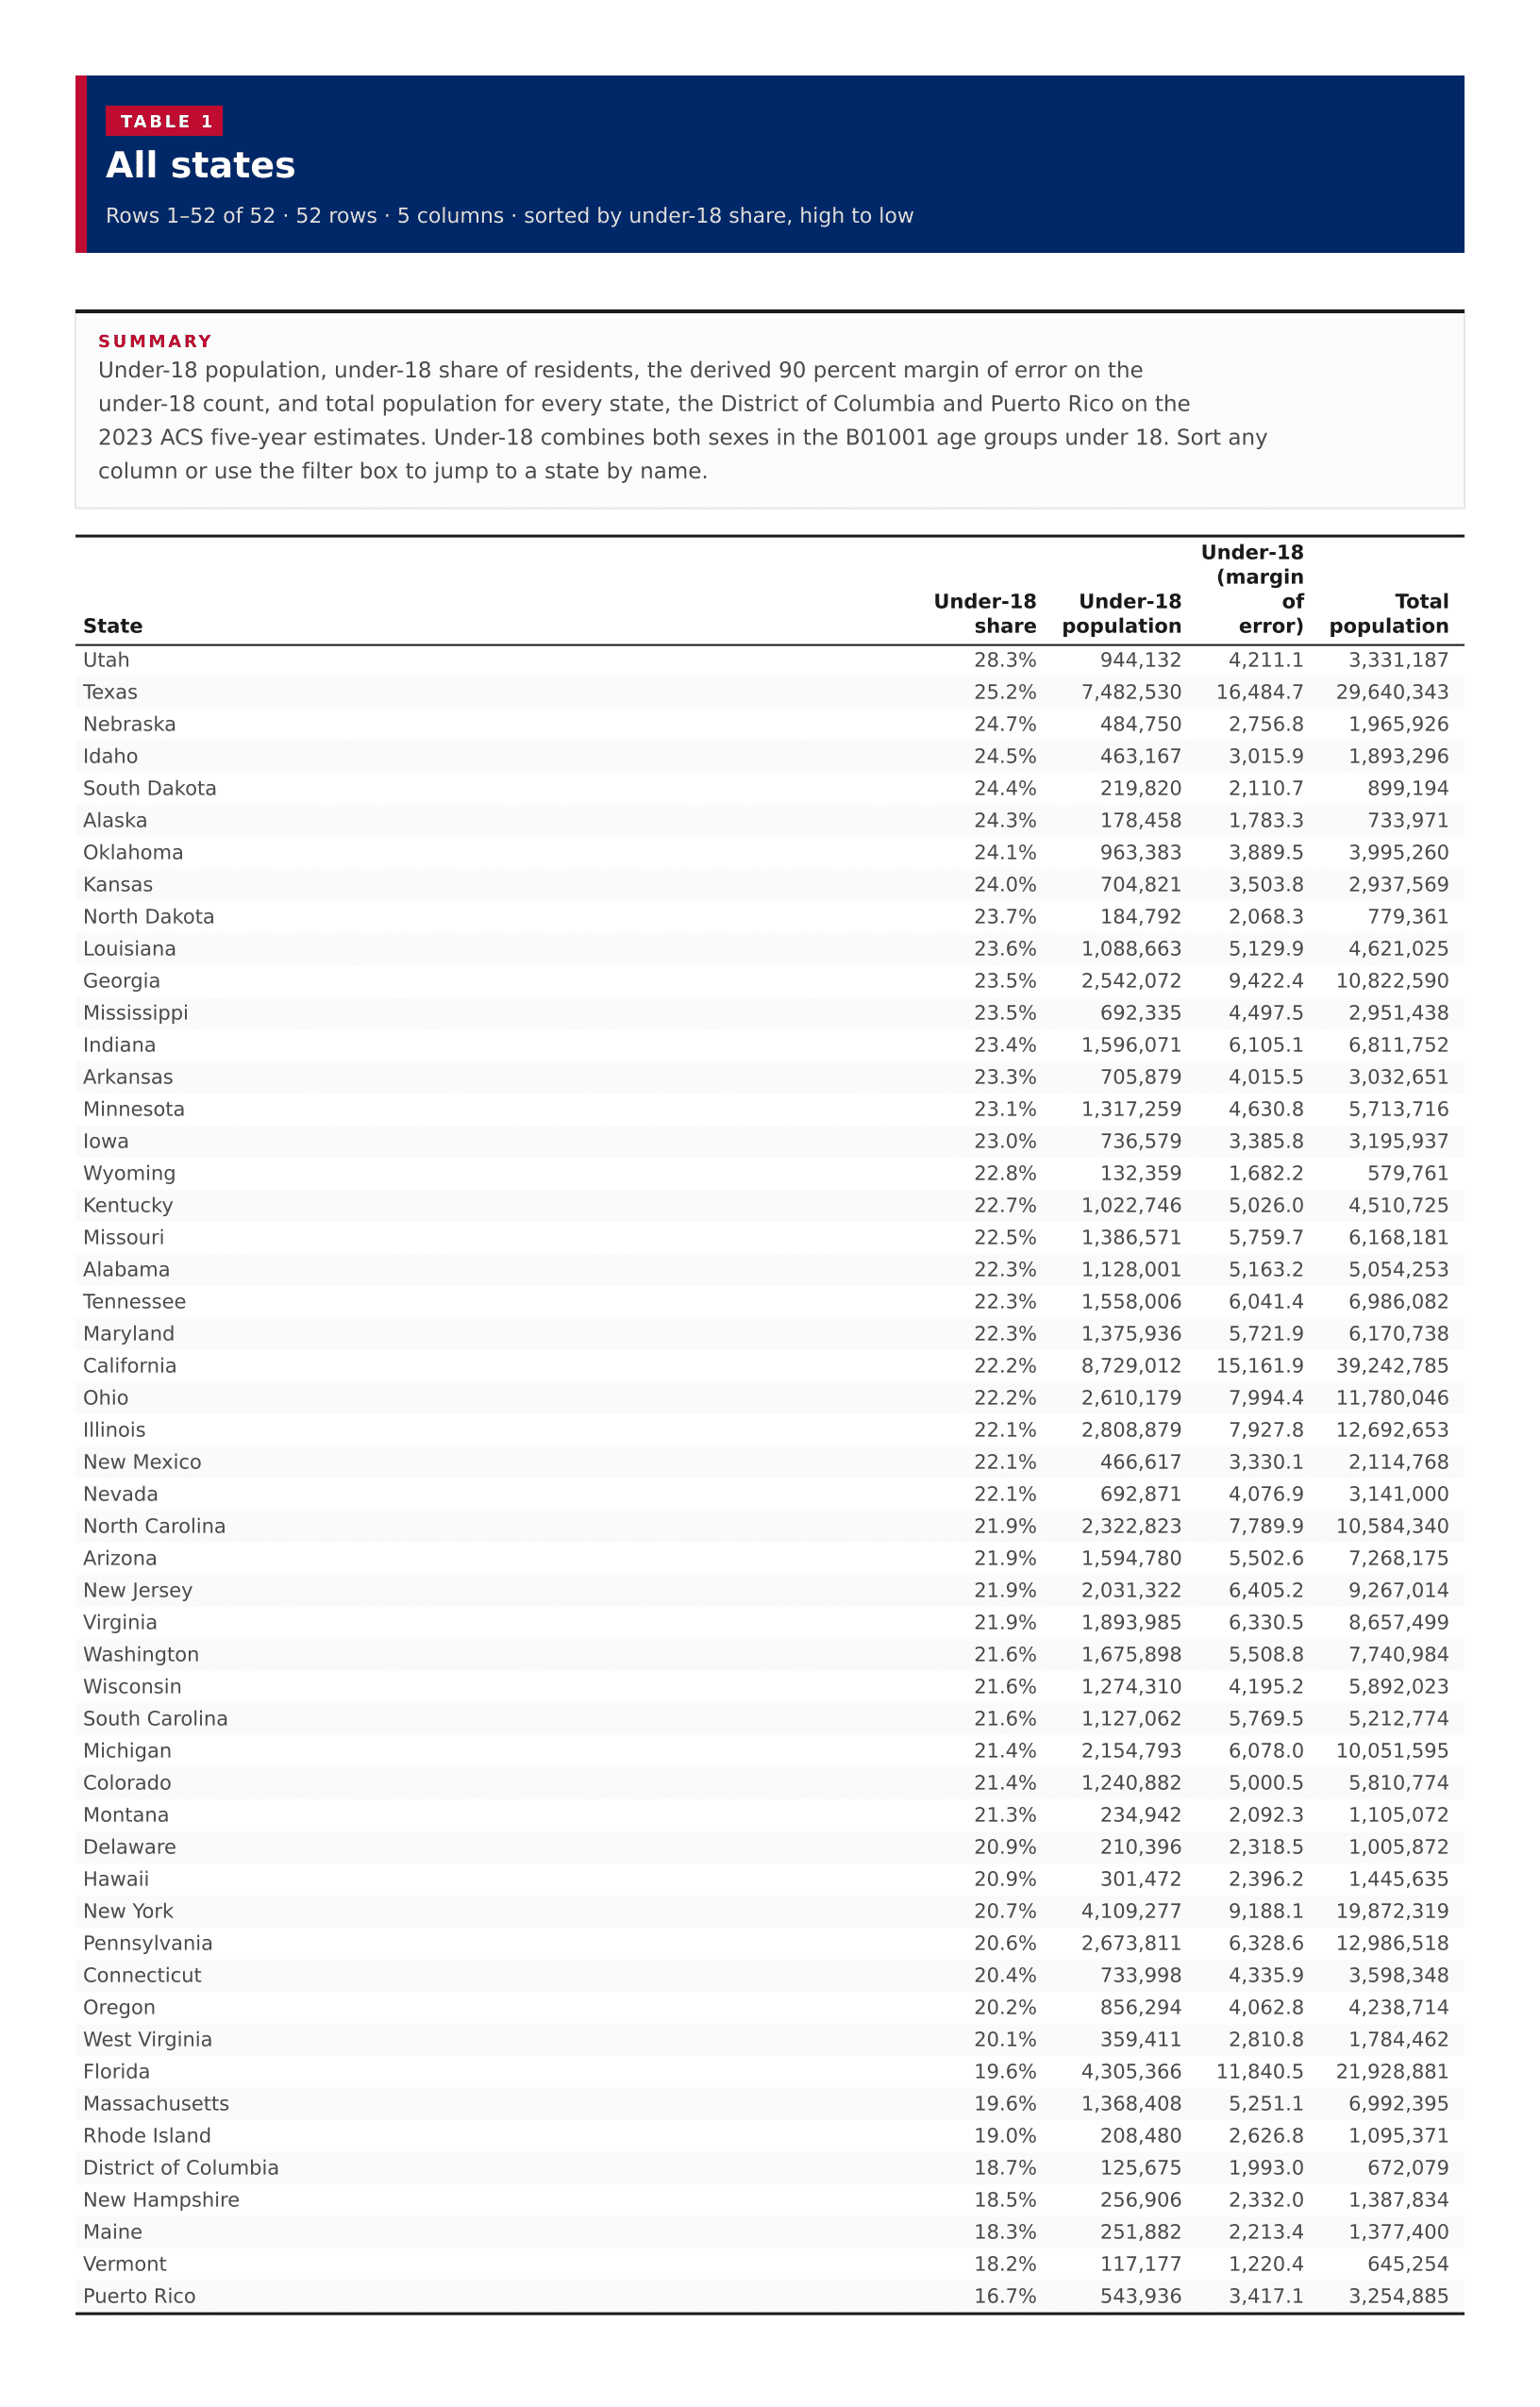
Under-18 population, under-18 share of residents, the derived 90 percent margin of error on the under-18 count, and total population for every state, the District of Columbia and Puerto Rico on the 2023 ACS five-year estimates. Under-18 combines both sexes in the B01001 age groups under 18. Sort any column or use the filter box to jump to a state by name.

All states
????
Utah28.3%944,1324,211.13,331,187
Texas25.2%7,482,53016,484.729,640,343
Nebraska24.7%484,7502,756.81,965,926
Idaho24.5%463,1673,015.91,893,296
South Dakota24.4%219,8202,110.7899,194
Alaska24.3%178,4581,783.3733,971
Oklahoma24.1%963,3833,889.53,995,260
Kansas24.0%704,8213,503.82,937,569
North Dakota23.7%184,7922,068.3779,361
Louisiana23.6%1,088,6635,129.94,621,025
Georgia23.5%2,542,0729,422.410,822,590
Mississippi23.5%692,3354,497.52,951,438
Indiana23.4%1,596,0716,105.16,811,752
Arkansas23.3%705,8794,015.53,032,651
Minnesota23.1%1,317,2594,630.85,713,716
Iowa23.0%736,5793,385.83,195,937
Wyoming22.8%132,3591,682.2579,761
Kentucky22.7%1,022,7465,026.04,510,725
Missouri22.5%1,386,5715,759.76,168,181
Alabama22.3%1,128,0015,163.25,054,253
Tennessee22.3%1,558,0066,041.46,986,082
Maryland22.3%1,375,9365,721.96,170,738
California22.2%8,729,01215,161.939,242,785
Ohio22.2%2,610,1797,994.411,780,046
Illinois22.1%2,808,8797,927.812,692,653
New Mexico22.1%466,6173,330.12,114,768
Nevada22.1%692,8714,076.93,141,000
North Carolina21.9%2,322,8237,789.910,584,340
Arizona21.9%1,594,7805,502.67,268,175
New Jersey21.9%2,031,3226,405.29,267,014
Virginia21.9%1,893,9856,330.58,657,499
Washington21.6%1,675,8985,508.87,740,984
Wisconsin21.6%1,274,3104,195.25,892,023
South Carolina21.6%1,127,0625,769.55,212,774
Michigan21.4%2,154,7936,078.010,051,595
Colorado21.4%1,240,8825,000.55,810,774
Montana21.3%234,9422,092.31,105,072
Delaware20.9%210,3962,318.51,005,872
Hawaii20.9%301,4722,396.21,445,635
New York20.7%4,109,2779,188.119,872,319
Pennsylvania20.6%2,673,8116,328.612,986,518
Connecticut20.4%733,9984,335.93,598,348
Oregon20.2%856,2944,062.84,238,714
West Virginia20.1%359,4112,810.81,784,462
Florida19.6%4,305,36611,840.521,928,881
Massachusetts19.6%1,368,4085,251.16,992,395
Rhode Island19.0%208,4802,626.81,095,371
District of Columbia18.7%125,6751,993.0672,079
New Hampshire18.5%256,9062,332.01,387,834
Maine18.3%251,8822,213.41,377,400
Vermont18.2%117,1771,220.4645,254
Puerto Rico16.7%543,9363,417.13,254,885

Image files

Download all

Figure 2

Under-18 share, all published states

Figure 2: Under-18 share, all published states
DownloadPDFImageCSV

Figure 3

Under-18 population, all published states

Figure 3: Under-18 population, all published states
DownloadPDFImageCSV

Figure 4

Under-18 population against under-18 share

Figure 4: Under-18 population against under-18 share
DownloadPDFImageCSV

About this data

  • Under-18 population is both sexes in the B01001 age groups under 18 (male under 5 through 15 to 17, and the matching female groups), summed from the unrounded ACS estimates.
  • Under-18 share is that child count divided by total population in the same area. It is not median age and not a child poverty rate.
  • Total population is controlled to Census population estimates for every area, so there is no sampling margin of error on that column. The plugin shows a dash.
  • The under-18 margin of error is derived as the square root of the sum of squared 90 percent MOEs on the eight age-group components when all are published. Controlled components yield a dash.
  • A midpoint of state shares is not a national under-18 rate. The national figure would weight each area by population. Adding the 52 child counts also does not produce an official United States total: Puerto Rico is included here, and these are ACS period estimates.
  • The Census published 50 states, the District of Columbia and Puerto Rico (52 areas). None of the under-18 component counts were suppressed.
  • Puerto Rico is in the ranking and table. Alaska and Hawaii appear on the ranking; on the map they are shown in inset.

References

U.S. Census Bureau, 2023 American Community Survey 5-Year Estimates · retrieved 2026-09-27