Figure 1
Housing vacancy rate, US states
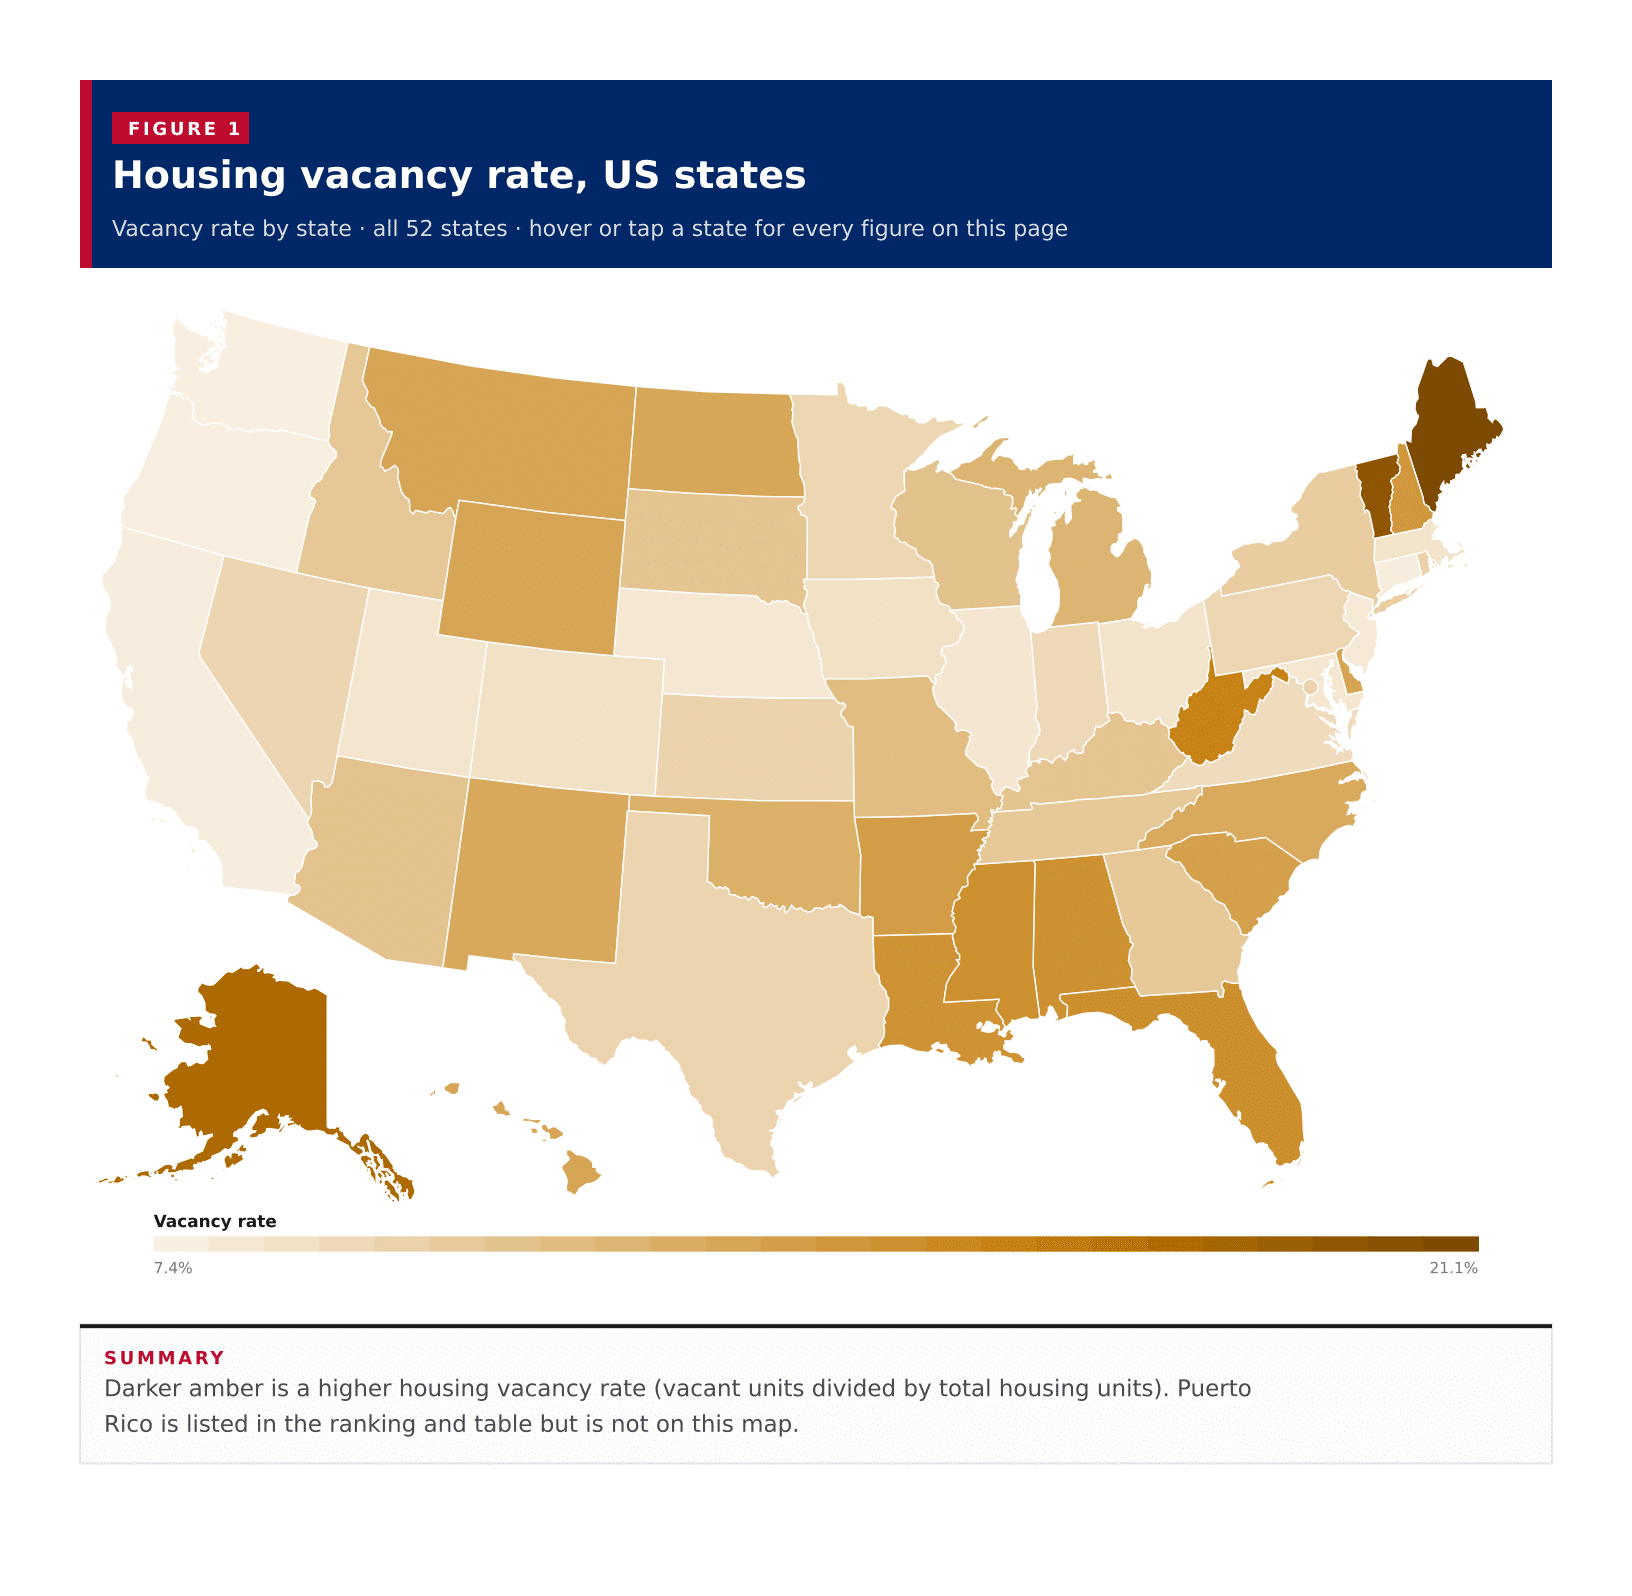
Vacancy rate by state · all 52 states · hover or tap a state for every figure on this page
A typical published area has a housing vacancy rate of 10.8%, the midpoint of the 50 states, the District of Columbia and Puerto Rico on the 2023 ACS five-year estimates. Puerto Rico leads at 21.3%, and Maine and Vermont are the highest of the 50 states at 21.1% and 20.1%. Washington is the lowest at 7.4%. 8 areas reach 15%. Each rate is vacant housing units divided by total housing units in that area, not a United States vacancy rate.
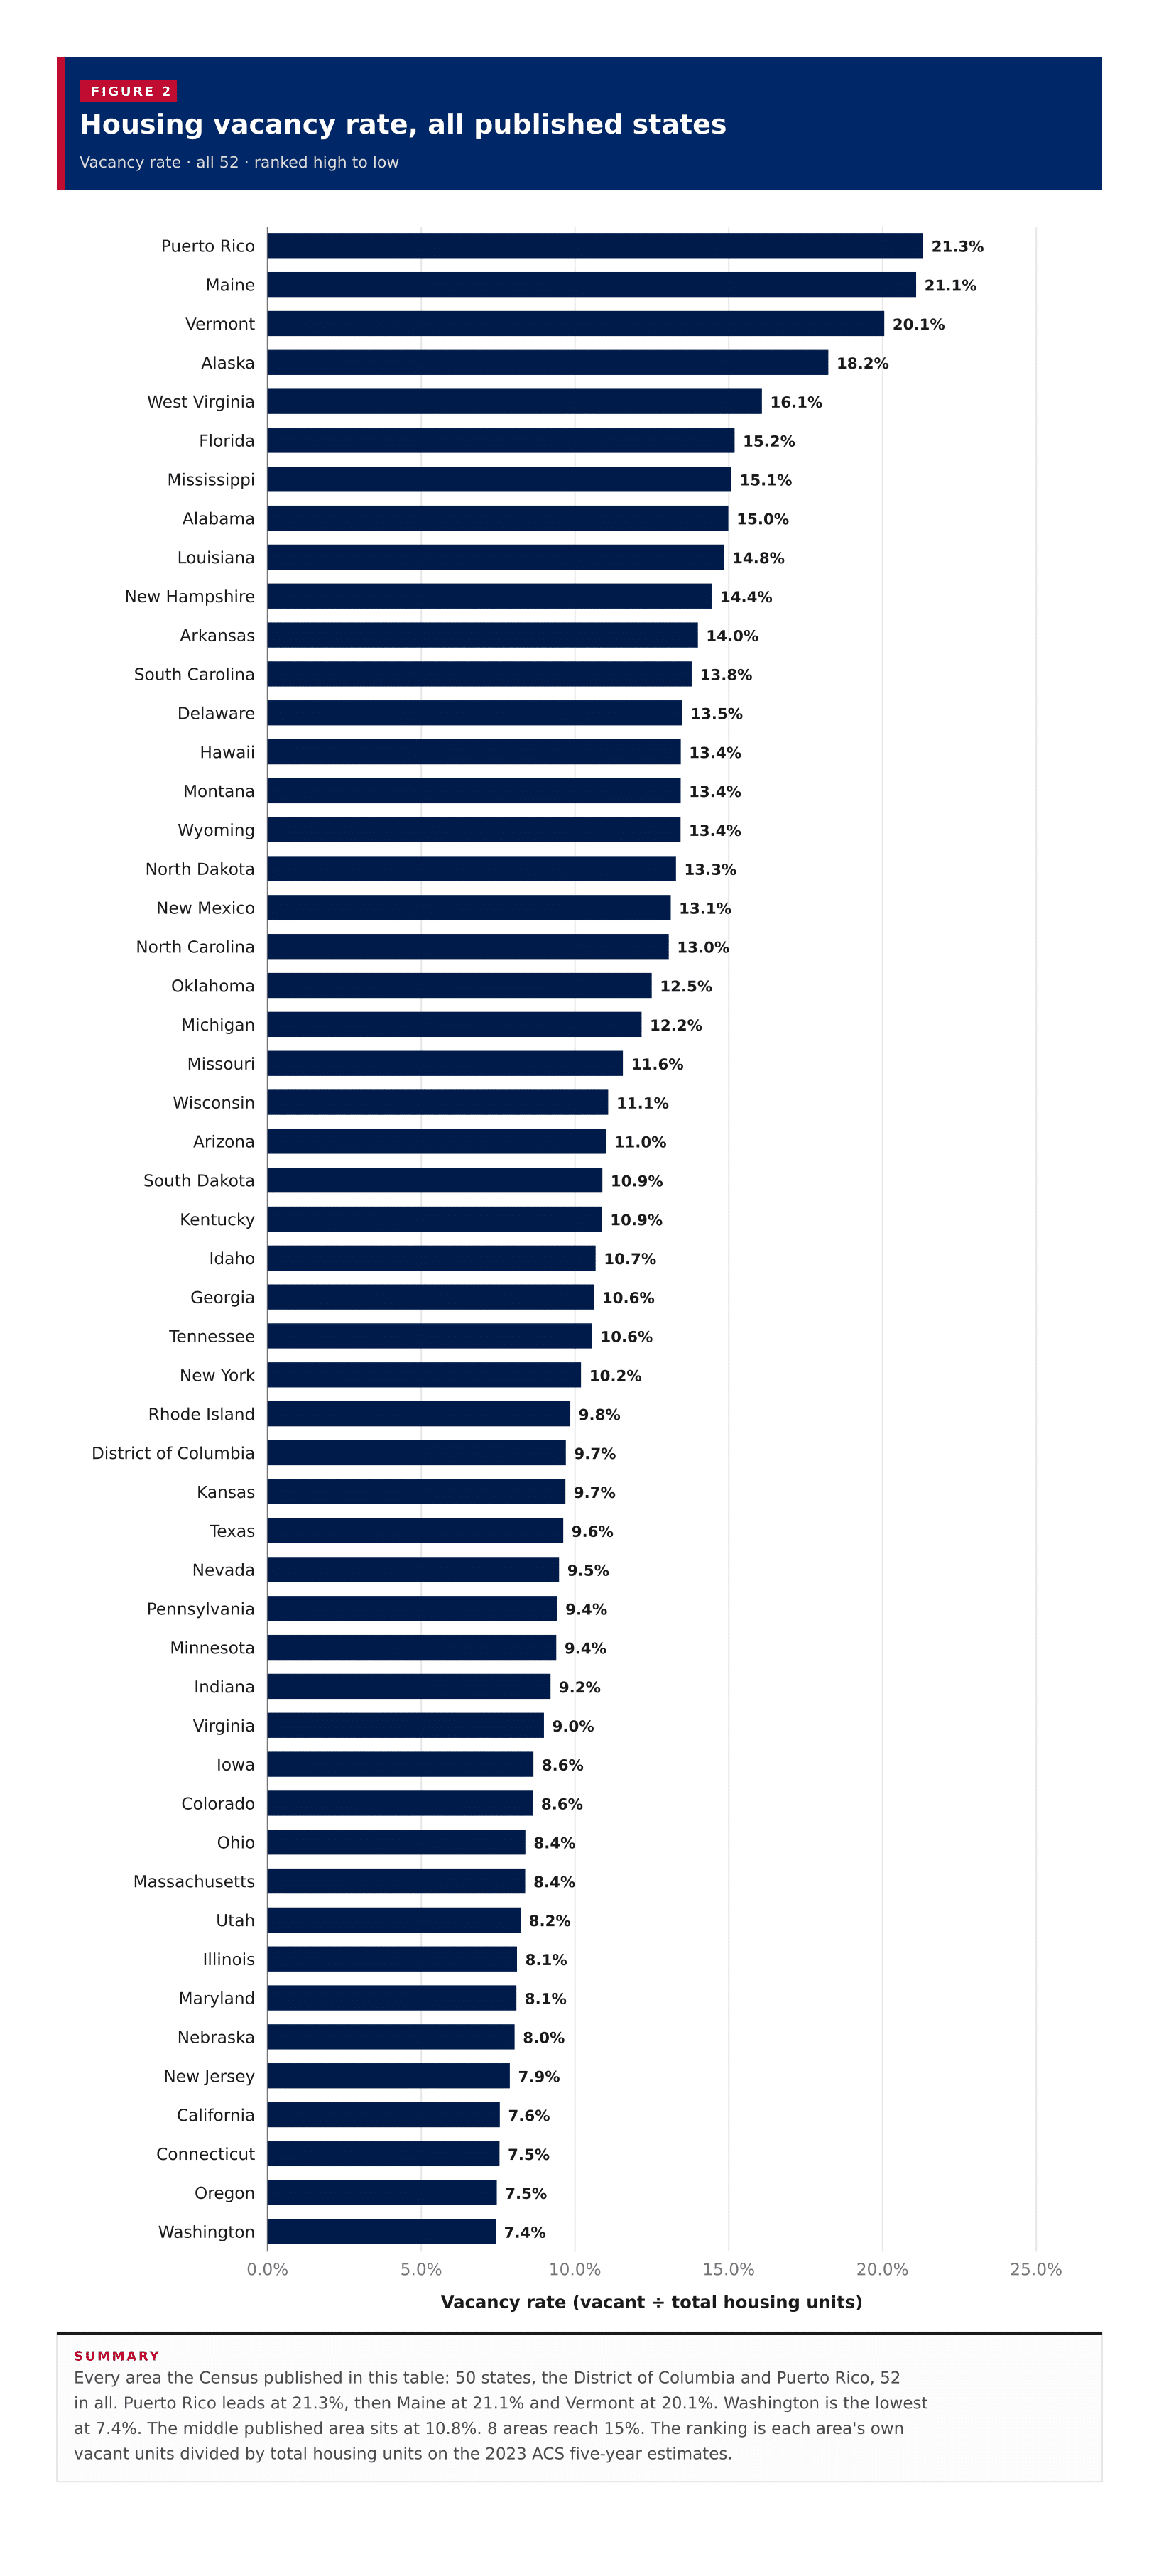
Vacancy rate · all 52 · ranked high to low
Every area the Census published in this table: 50 states, the District of Columbia and Puerto Rico, 52 in all. Puerto Rico leads at 21.3%, then Maine at 21.1% and Vermont at 20.1%. Washington is the lowest at 7.4%. The middle published area sits at 10.8%. 8 areas reach 15%. The ranking is each area's own vacant units divided by total housing units on the 2023 ACS five-year estimates.
52 rows · 8 columns
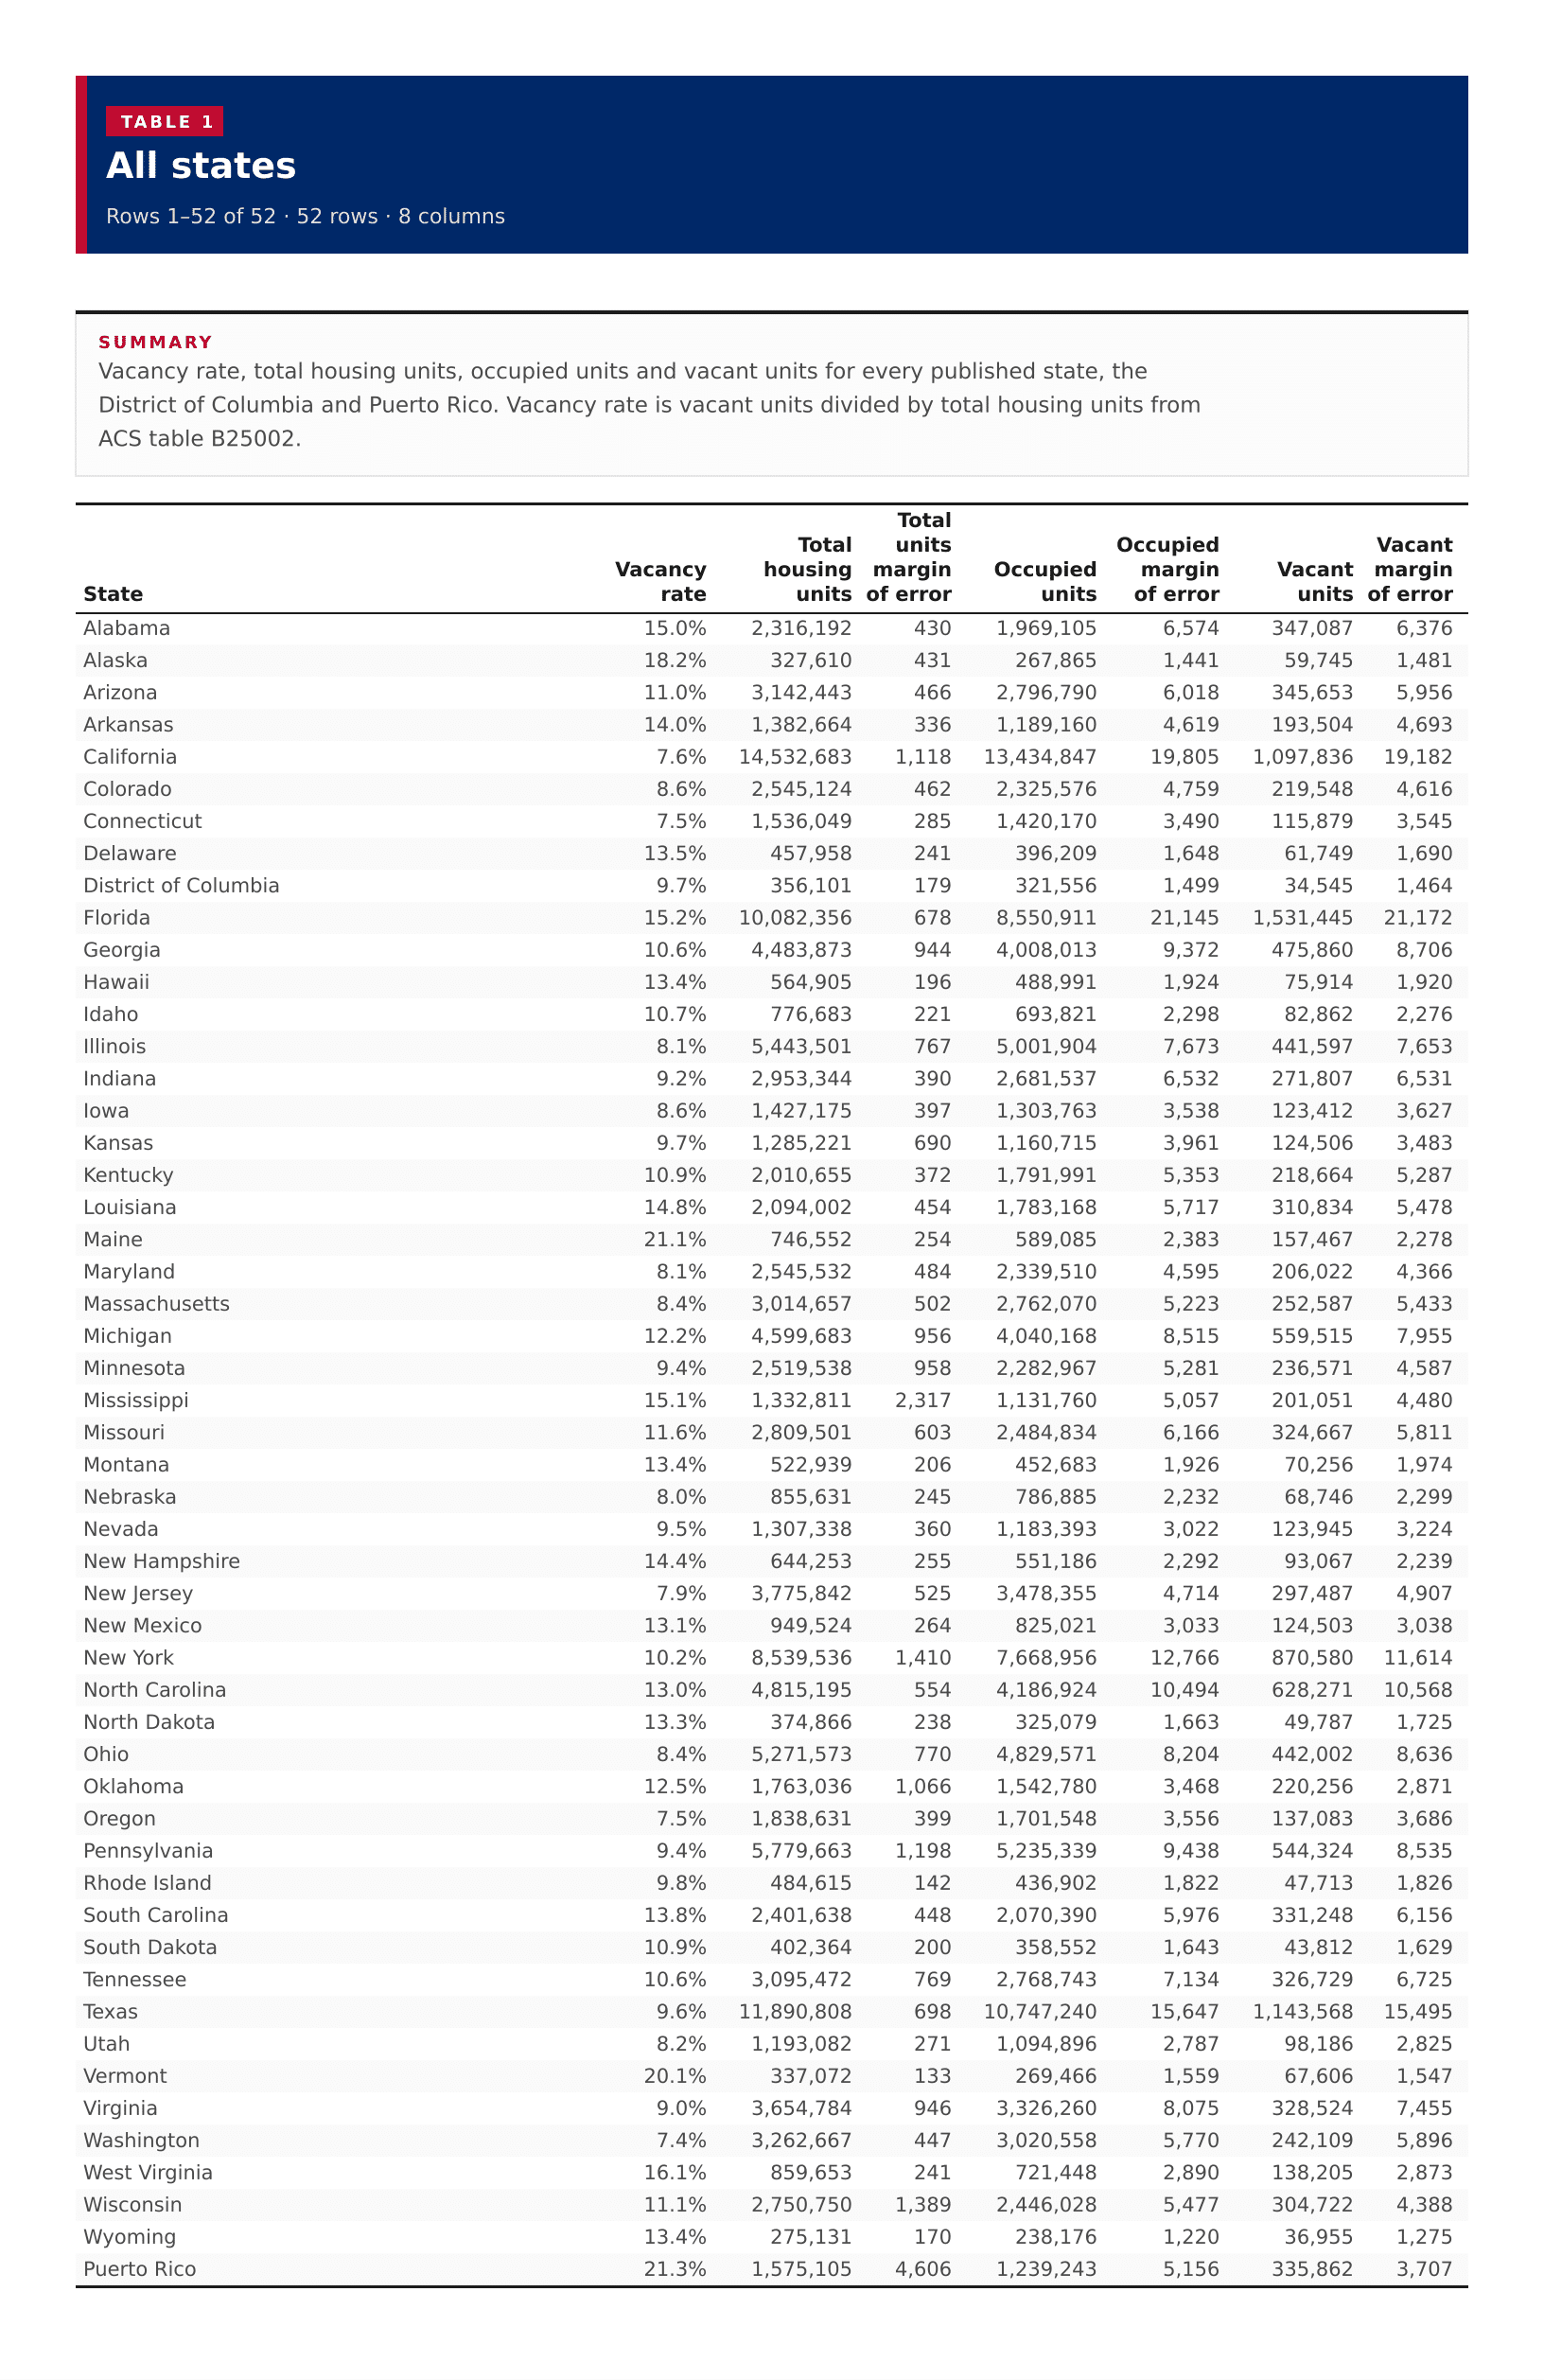
Vacancy rate, total housing units, occupied units and vacant units for every published state, the District of Columbia and Puerto Rico. Vacancy rate is vacant units divided by total housing units from ACS table B25002.
| ? | ? | ? | ? | ? | ? | ? | |
|---|---|---|---|---|---|---|---|
| Alabama | 15.0% | 2,316,192 | 430 | 1,969,105 | 6,574 | 347,087 | 6,376 |
| Alaska | 18.2% | 327,610 | 431 | 267,865 | 1,441 | 59,745 | 1,481 |
| Arizona | 11.0% | 3,142,443 | 466 | 2,796,790 | 6,018 | 345,653 | 5,956 |
| Arkansas | 14.0% | 1,382,664 | 336 | 1,189,160 | 4,619 | 193,504 | 4,693 |
| California | 7.6% | 14,532,683 | 1,118 | 13,434,847 | 19,805 | 1,097,836 | 19,182 |
| Colorado | 8.6% | 2,545,124 | 462 | 2,325,576 | 4,759 | 219,548 | 4,616 |
| Connecticut | 7.5% | 1,536,049 | 285 | 1,420,170 | 3,490 | 115,879 | 3,545 |
| Delaware | 13.5% | 457,958 | 241 | 396,209 | 1,648 | 61,749 | 1,690 |
| District of Columbia | 9.7% | 356,101 | 179 | 321,556 | 1,499 | 34,545 | 1,464 |
| Florida | 15.2% | 10,082,356 | 678 | 8,550,911 | 21,145 | 1,531,445 | 21,172 |
| Georgia | 10.6% | 4,483,873 | 944 | 4,008,013 | 9,372 | 475,860 | 8,706 |
| Hawaii | 13.4% | 564,905 | 196 | 488,991 | 1,924 | 75,914 | 1,920 |
| Idaho | 10.7% | 776,683 | 221 | 693,821 | 2,298 | 82,862 | 2,276 |
| Illinois | 8.1% | 5,443,501 | 767 | 5,001,904 | 7,673 | 441,597 | 7,653 |
| Indiana | 9.2% | 2,953,344 | 390 | 2,681,537 | 6,532 | 271,807 | 6,531 |
| Iowa | 8.6% | 1,427,175 | 397 | 1,303,763 | 3,538 | 123,412 | 3,627 |
| Kansas | 9.7% | 1,285,221 | 690 | 1,160,715 | 3,961 | 124,506 | 3,483 |
| Kentucky | 10.9% | 2,010,655 | 372 | 1,791,991 | 5,353 | 218,664 | 5,287 |
| Louisiana | 14.8% | 2,094,002 | 454 | 1,783,168 | 5,717 | 310,834 | 5,478 |
| Maine | 21.1% | 746,552 | 254 | 589,085 | 2,383 | 157,467 | 2,278 |
| Maryland | 8.1% | 2,545,532 | 484 | 2,339,510 | 4,595 | 206,022 | 4,366 |
| Massachusetts | 8.4% | 3,014,657 | 502 | 2,762,070 | 5,223 | 252,587 | 5,433 |
| Michigan | 12.2% | 4,599,683 | 956 | 4,040,168 | 8,515 | 559,515 | 7,955 |
| Minnesota | 9.4% | 2,519,538 | 958 | 2,282,967 | 5,281 | 236,571 | 4,587 |
| Mississippi | 15.1% | 1,332,811 | 2,317 | 1,131,760 | 5,057 | 201,051 | 4,480 |
| Missouri | 11.6% | 2,809,501 | 603 | 2,484,834 | 6,166 | 324,667 | 5,811 |
| Montana | 13.4% | 522,939 | 206 | 452,683 | 1,926 | 70,256 | 1,974 |
| Nebraska | 8.0% | 855,631 | 245 | 786,885 | 2,232 | 68,746 | 2,299 |
| Nevada | 9.5% | 1,307,338 | 360 | 1,183,393 | 3,022 | 123,945 | 3,224 |
| New Hampshire | 14.4% | 644,253 | 255 | 551,186 | 2,292 | 93,067 | 2,239 |
| New Jersey | 7.9% | 3,775,842 | 525 | 3,478,355 | 4,714 | 297,487 | 4,907 |
| New Mexico | 13.1% | 949,524 | 264 | 825,021 | 3,033 | 124,503 | 3,038 |
| New York | 10.2% | 8,539,536 | 1,410 | 7,668,956 | 12,766 | 870,580 | 11,614 |
| North Carolina | 13.0% | 4,815,195 | 554 | 4,186,924 | 10,494 | 628,271 | 10,568 |
| North Dakota | 13.3% | 374,866 | 238 | 325,079 | 1,663 | 49,787 | 1,725 |
| Ohio | 8.4% | 5,271,573 | 770 | 4,829,571 | 8,204 | 442,002 | 8,636 |
| Oklahoma | 12.5% | 1,763,036 | 1,066 | 1,542,780 | 3,468 | 220,256 | 2,871 |
| Oregon | 7.5% | 1,838,631 | 399 | 1,701,548 | 3,556 | 137,083 | 3,686 |
| Pennsylvania | 9.4% | 5,779,663 | 1,198 | 5,235,339 | 9,438 | 544,324 | 8,535 |
| Rhode Island | 9.8% | 484,615 | 142 | 436,902 | 1,822 | 47,713 | 1,826 |
| South Carolina | 13.8% | 2,401,638 | 448 | 2,070,390 | 5,976 | 331,248 | 6,156 |
| South Dakota | 10.9% | 402,364 | 200 | 358,552 | 1,643 | 43,812 | 1,629 |
| Tennessee | 10.6% | 3,095,472 | 769 | 2,768,743 | 7,134 | 326,729 | 6,725 |
| Texas | 9.6% | 11,890,808 | 698 | 10,747,240 | 15,647 | 1,143,568 | 15,495 |
| Utah | 8.2% | 1,193,082 | 271 | 1,094,896 | 2,787 | 98,186 | 2,825 |
| Vermont | 20.1% | 337,072 | 133 | 269,466 | 1,559 | 67,606 | 1,547 |
| Virginia | 9.0% | 3,654,784 | 946 | 3,326,260 | 8,075 | 328,524 | 7,455 |
| Washington | 7.4% | 3,262,667 | 447 | 3,020,558 | 5,770 | 242,109 | 5,896 |
| West Virginia | 16.1% | 859,653 | 241 | 721,448 | 2,890 | 138,205 | 2,873 |
| Wisconsin | 11.1% | 2,750,750 | 1,389 | 2,446,028 | 5,477 | 304,722 | 4,388 |
| Wyoming | 13.4% | 275,131 | 170 | 238,176 | 1,220 | 36,955 | 1,275 |
| Puerto Rico | 21.3% | 1,575,105 | 4,606 | 1,239,243 | 5,156 | 335,862 | 3,707 |