Rent burden by US state

Summary

Rent burden, US states

Paying 30% or more by state · all 52 states · hover or tap a state for every figure on this page

52 items
View100%
DownloadPDFImageCSV
StatesFlorida
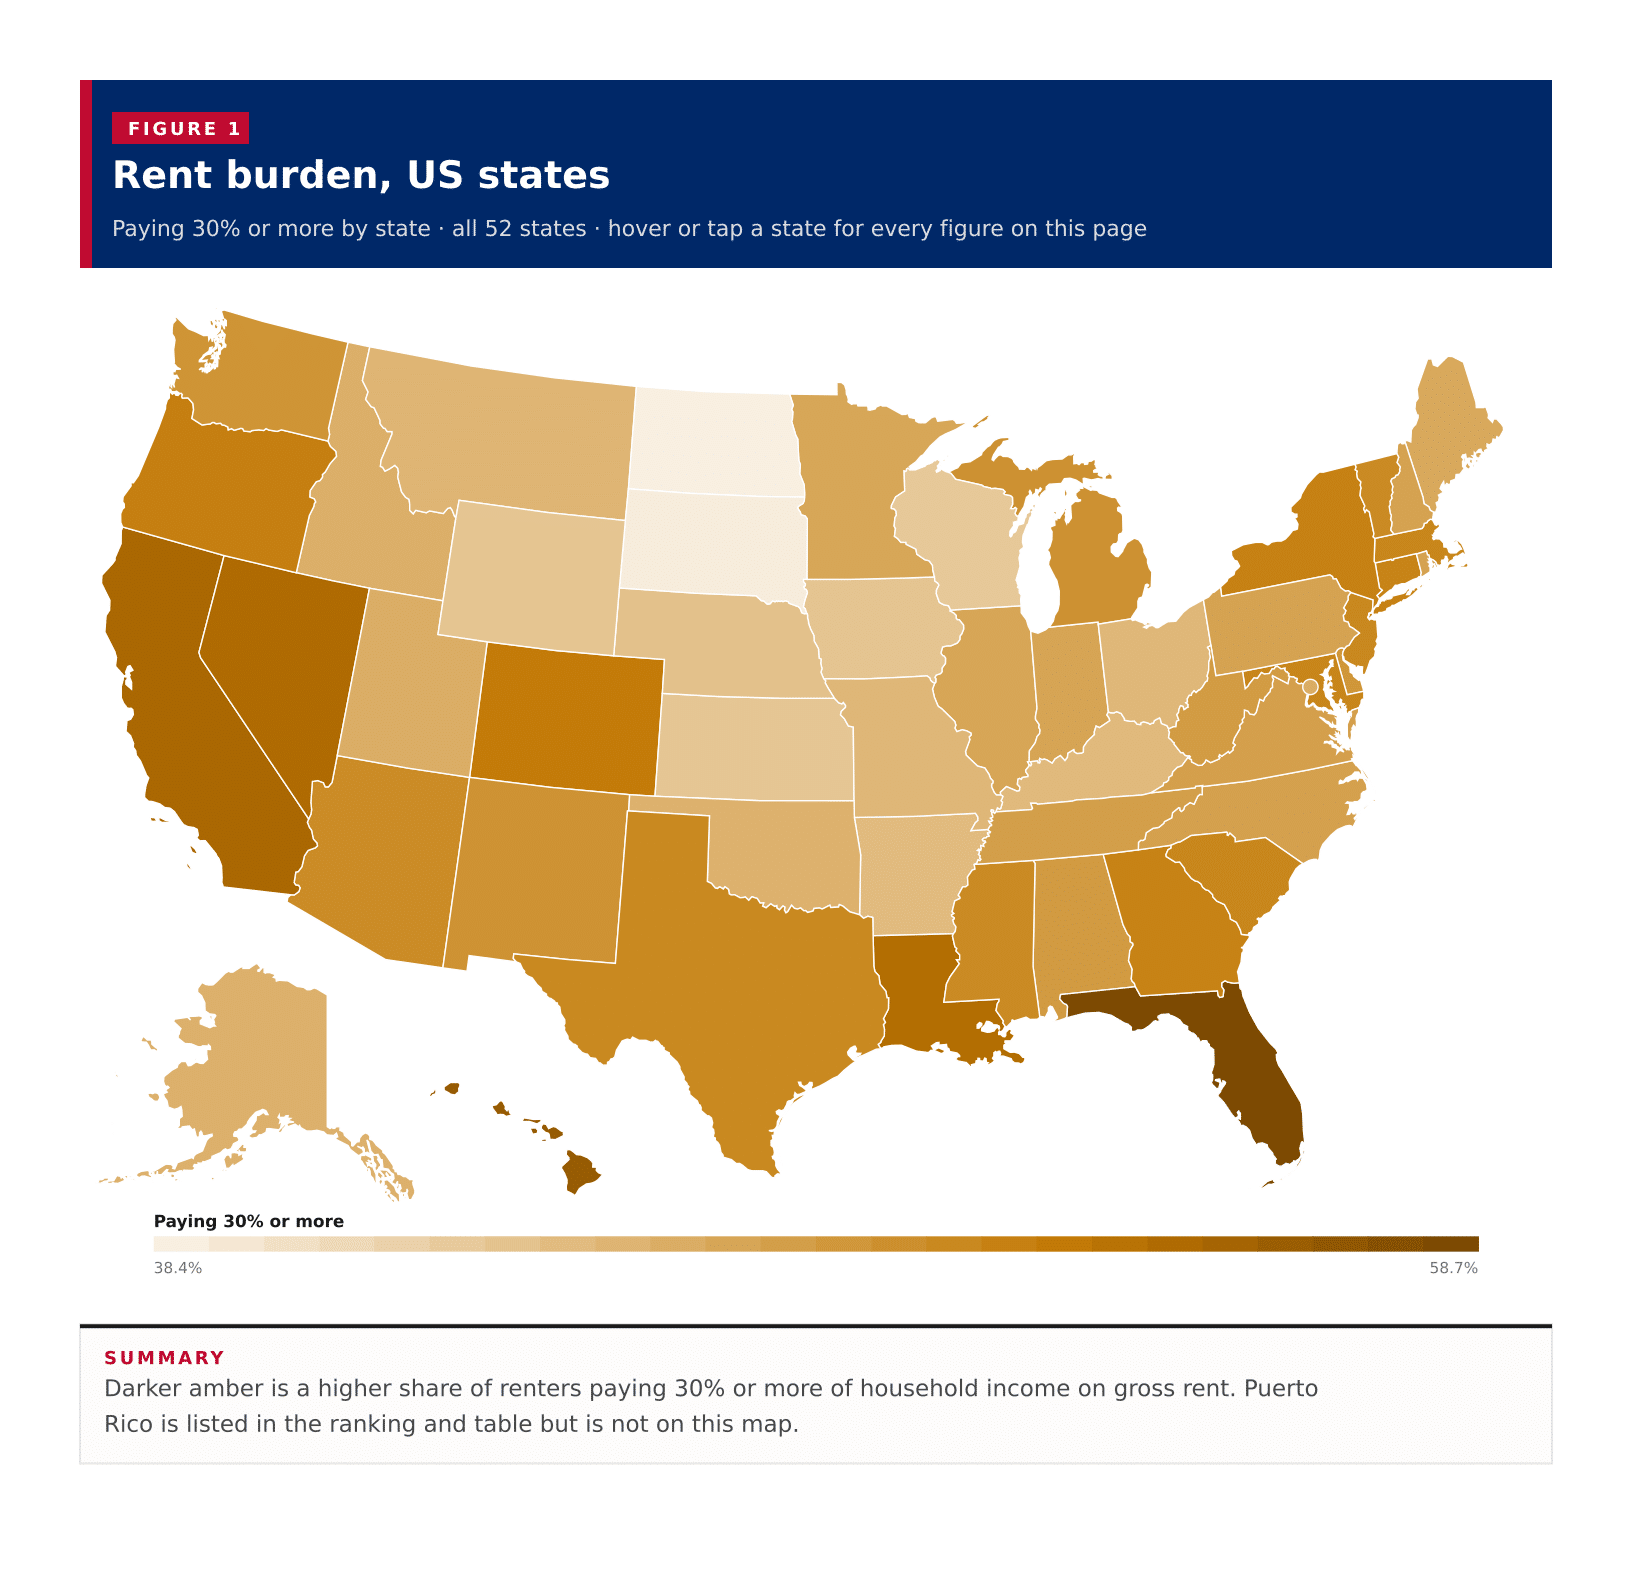
Rent burden, US statesDarker amber is a higher share of renters paying 30% or more of household income on gross rent. Puerto Rico is listed in the ranking and table but is not on this map.Alabama · Paying 30% or more: 48.6% · Paying 50% or more: 24.9% · Median rent as % of income: 29.4% · Margin of error: 0.3% · Renters with ratio computed: 516,436 · Renter households: 592,043Alaska · Paying 30% or more: 45.9% · Paying 50% or more: 20.1% · Median rent as % of income: 28.2% · Margin of error: 0.7% · Renters with ratio computed: 81,342 · Renter households: 89,496Arizona · Paying 30% or more: 50.3% · Paying 50% or more: 24.0% · Median rent as % of income: 30.2% · Margin of error: 0.3% · Renters with ratio computed: 861,782 · Renter households: 923,559Arkansas · Paying 30% or more: 44.7% · Paying 50% or more: 21.3% · Median rent as % of income: 27.6% · Margin of error: 0.4% · Renters with ratio computed: 354,354 · Renter households: 402,626California · Paying 30% or more: 54.7% · Paying 50% or more: 28.3% · Median rent as % of income: 32.5% · Margin of error: 0.1% · Renters with ratio computed: 5,639,568 · Renter households: 5,940,036Colorado · Paying 30% or more: 52.2% · Paying 50% or more: 25.5% · Median rent as % of income: 31.1% · Margin of error: 0.3% · Renters with ratio computed: 746,413 · Renter households: 783,361Connecticut · Paying 30% or more: 51.3% · Paying 50% or more: 26.7% · Median rent as % of income: 30.7% · Margin of error: 0.4% · Renters with ratio computed: 450,683 · Renter households: 480,258Delaware · Paying 30% or more: 49.1% · Paying 50% or more: 24.4% · Median rent as % of income: 29.6% · Margin of error: 0.6% · Renters with ratio computed: 103,050 · Renter households: 109,869Florida · Paying 30% or more: 58.7% · Paying 50% or more: 30.2% · Median rent as % of income: 34.5% · Margin of error: 0.2% · Renters with ratio computed: 2,616,075 · Renter households: 2,794,102Georgia · Paying 30% or more: 51.4% · Paying 50% or more: 26.0% · Median rent as % of income: 30.8% · Margin of error: 0.3% · Renters with ratio computed: 1,283,244 · Renter households: 1,388,484Hawaii · Paying 30% or more: 56.3% · Paying 50% or more: 28.2% · Median rent as % of income: 33.1% · Margin of error: 0.4% · Renters with ratio computed: 168,722 · Renter households: 183,122Idaho · Paying 30% or more: 46.1% · Paying 50% or more: 19.7% · Median rent as % of income: 28.4% · Margin of error: 0.4% · Renters with ratio computed: 177,272 · Renter households: 191,681Illinois · Paying 30% or more: 47.2% · Paying 50% or more: 24.1% · Median rent as % of income: 28.8% · Margin of error: 0.2% · Renters with ratio computed: 1,539,353 · Renter households: 1,658,870Indiana · Paying 30% or more: 47.4% · Paying 50% or more: 23.3% · Median rent as % of income: 28.9% · Margin of error: 0.3% · Renters with ratio computed: 733,129 · Renter households: 795,052Iowa · Paying 30% or more: 43.5% · Paying 50% or more: 21.6% · Median rent as % of income: 27.2% · Margin of error: 0.3% · Renters with ratio computed: 342,868 · Renter households: 371,145Kansas · Paying 30% or more: 43.4% · Paying 50% or more: 20.4% · Median rent as % of income: 27.0% · Margin of error: 0.3% · Renters with ratio computed: 358,119 · Renter households: 384,404Kentucky · Paying 30% or more: 44.8% · Paying 50% or more: 22.3% · Median rent as % of income: 27.8% · Margin of error: 0.3% · Renters with ratio computed: 505,612 · Renter households: 568,417Louisiana · Paying 30% or more: 53.9% · Paying 50% or more: 29.9% · Median rent as % of income: 32.3% · Margin of error: 0.4% · Renters with ratio computed: 506,216 · Renter households: 582,761Maine · Paying 30% or more: 46.9% · Paying 50% or more: 20.7% · Median rent as % of income: 28.9% · Margin of error: 0.4% · Renters with ratio computed: 138,721 · Renter households: 153,056Maryland · Paying 30% or more: 51.1% · Paying 50% or more: 25.4% · Median rent as % of income: 30.6% · Margin of error: 0.3% · Renters with ratio computed: 720,396 · Renter households: 760,808Massachusetts · Paying 30% or more: 51.0% · Paying 50% or more: 25.8% · Median rent as % of income: 30.5% · Margin of error: 0.2% · Renters with ratio computed: 976,831 · Renter households: 1,033,084Michigan · Paying 30% or more: 49.6% · Paying 50% or more: 25.7% · Median rent as % of income: 29.8% · Margin of error: 0.2% · Renters with ratio computed: 1,009,457 · Renter households: 1,094,011Minnesota · Paying 30% or more: 47.2% · Paying 50% or more: 22.9% · Median rent as % of income: 28.9% · Margin of error: 0.2% · Renters with ratio computed: 596,000 · Renter households: 630,433Mississippi · Paying 30% or more: 50.5% · Paying 50% or more: 25.5% · Median rent as % of income: 30.3% · Margin of error: 0.5% · Renters with ratio computed: 292,293 · Renter households: 345,471Missouri · Paying 30% or more: 45.2% · Paying 50% or more: 21.8% · Median rent as % of income: 27.9% · Margin of error: 0.3% · Renters with ratio computed: 733,998 · Renter households: 796,762Montana · Paying 30% or more: 45.4% · Paying 50% or more: 21.3% · Median rent as % of income: 28.0% · Margin of error: 0.4% · Renters with ratio computed: 125,188 · Renter households: 138,417Nebraska · Paying 30% or more: 43.9% · Paying 50% or more: 20.5% · Median rent as % of income: 27.4% · Margin of error: 0.3% · Renters with ratio computed: 244,656 · Renter households: 263,282Nevada · Paying 30% or more: 54.3% · Paying 50% or more: 27.2% · Median rent as % of income: 32.3% · Margin of error: 0.4% · Renters with ratio computed: 454,387 · Renter households: 481,479New Hampshire · Paying 30% or more: 47.6% · Paying 50% or more: 21.9% · Median rent as % of income: 29.2% · Margin of error: 0.4% · Renters with ratio computed: 143,594 · Renter households: 151,523New Jersey · Paying 30% or more: 50.8% · Paying 50% or more: 26.5% · Median rent as % of income: 30.4% · Margin of error: 0.3% · Renters with ratio computed: 1,202,271 · Renter households: 1,262,873New Mexico · Paying 30% or more: 49.5% · Paying 50% or more: 25.2% · Median rent as % of income: 29.8% · Margin of error: 0.4% · Renters with ratio computed: 225,671 · Renter households: 252,957New York · Paying 30% or more: 51.5% · Paying 50% or more: 27.9% · Median rent as % of income: 30.9% · Margin of error: 0.3% · Renters with ratio computed: 3,309,953 · Renter households: 3,504,163North Carolina · Paying 30% or more: 47.8% · Paying 50% or more: 23.0% · Median rent as % of income: 29.0% · Margin of error: 0.3% · Renters with ratio computed: 1,286,897 · Renter households: 1,408,252North Dakota · Paying 30% or more: 38.4% · Paying 50% or more: 18.1% · Median rent as % of income: 24.8% · Margin of error: 0.5% · Renters with ratio computed: 110,843 · Renter households: 118,956Ohio · Paying 30% or more: 45.1% · Paying 50% or more: 22.6% · Median rent as % of income: 28.0% · Margin of error: 0.2% · Renters with ratio computed: 1,475,618 · Renter households: 1,594,003Oklahoma · Paying 30% or more: 45.8% · Paying 50% or more: 22.3% · Median rent as % of income: 28.1% · Margin of error: 0.2% · Renters with ratio computed: 474,691 · Renter households: 527,573Oregon · Paying 30% or more: 51.8% · Paying 50% or more: 26.1% · Median rent as % of income: 30.9% · Margin of error: 0.3% · Renters with ratio computed: 587,544 · Renter households: 623,205Pennsylvania · Paying 30% or more: 47.6% · Paying 50% or more: 24.3% · Median rent as % of income: 29.0% · Margin of error: 0.2% · Renters with ratio computed: 1,486,225 · Renter households: 1,605,715Rhode Island · Paying 30% or more: 47.6% · Paying 50% or more: 23.2% · Median rent as % of income: 29.0% · Margin of error: 0.5% · Renters with ratio computed: 151,782 · Renter households: 160,558South Carolina · Paying 30% or more: 51.0% · Paying 50% or more: 25.6% · Median rent as % of income: 30.5% · Margin of error: 0.4% · Renters with ratio computed: 525,596 · Renter households: 591,532South Dakota · Paying 30% or more: 38.8% · Paying 50% or more: 17.2% · Median rent as % of income: 25.3% · Margin of error: 0.6% · Renters with ratio computed: 102,644 · Renter households: 112,447Tennessee · Paying 30% or more: 48.1% · Paying 50% or more: 23.2% · Median rent as % of income: 29.2% · Margin of error: 0.2% · Renters with ratio computed: 828,105 · Renter households: 912,950Texas · Paying 30% or more: 50.7% · Paying 50% or more: 24.5% · Median rent as % of income: 30.4% · Margin of error: 0.2% · Renters with ratio computed: 3,769,419 · Renter households: 4,023,511Utah · Paying 30% or more: 46.3% · Paying 50% or more: 20.6% · Median rent as % of income: 28.5% · Margin of error: 0.3% · Renters with ratio computed: 304,917 · Renter households: 321,551Vermont · Paying 30% or more: 50.5% · Paying 50% or more: 25.0% · Median rent as % of income: 30.3% · Margin of error: 0.7% · Renters with ratio computed: 68,534 · Renter households: 73,304Virginia · Paying 30% or more: 48.0% · Paying 50% or more: 23.6% · Median rent as % of income: 29.2% · Margin of error: 0.2% · Renters with ratio computed: 1,018,362 · Renter households: 1,091,768Washington · Paying 30% or more: 49.3% · Paying 50% or more: 23.2% · Median rent as % of income: 29.7% · Margin of error: 0.2% · Renters with ratio computed: 1,036,379 · Renter households: 1,090,864West Virginia · Paying 30% or more: 48.5% · Paying 50% or more: 24.6% · Median rent as % of income: 29.3% · Margin of error: 0.5% · Renters with ratio computed: 152,198 · Renter households: 185,366Wisconsin · Paying 30% or more: 43.0% · Paying 50% or more: 20.7% · Median rent as % of income: 26.9% · Margin of error: 0.3% · Renters with ratio computed: 738,245 · Renter households: 785,523Wyoming · Paying 30% or more: 43.5% · Paying 50% or more: 20.4% · Median rent as % of income: 27.2% · Margin of error: 0.7% · Renters with ratio computed: 59,978 · Renter households: 66,877District of Columbia · Paying 30% or more: 46.4% · Paying 50% or more: 22.0% · Median rent as % of income: 28.5% · Margin of error: 0.5% · Renters with ratio computed: 180,101 · Renter households: 189,268District of Columbia · Paying 30% or more: 46.4% · Paying 50% or more: 22.0% · Median rent as % of income: 28.5% · Margin of error: 0.5% · Renters with ratio computed: 180,101 · Renter households: 189,268Paying 30% or more38.4%58.7%
Summary

Darker amber is a higher share of renters paying 30% or more of household income on gross rent. Puerto Rico is listed in the ranking and table but is not on this map.

A typical published area has 48.0% of renters paying 30% or more of household income on gross rent, the midpoint of the 50 states, the District of Columbia and Puerto Rico on the 2023 ACS five-year estimates. Florida leads at 58.7%, then Hawaii at 56.3%, California at 54.7% and Nevada at 54.3%. North Dakota is the lowest at 38.4%. 19 areas reach 50%. These shares are of renter households with a computable rent-to-income ratio in each area, not a national average of states.
In short

48.0%typical published areathe middle area, not an average
58.7%Floridahighest share paying 30% or more
38.4%North Dakotalowest of the published areas
19areas at or above 50%Florida, Hawaii, California, Nevada and 15 others
29.2%typical median rent sharemidpoint of state medians from B25071
Figure 1

Rent burden (30% or more), all published states

Paying 30% or more · all 52 · ranked high to low

52 items
View100%
DownloadPDFImageCSV
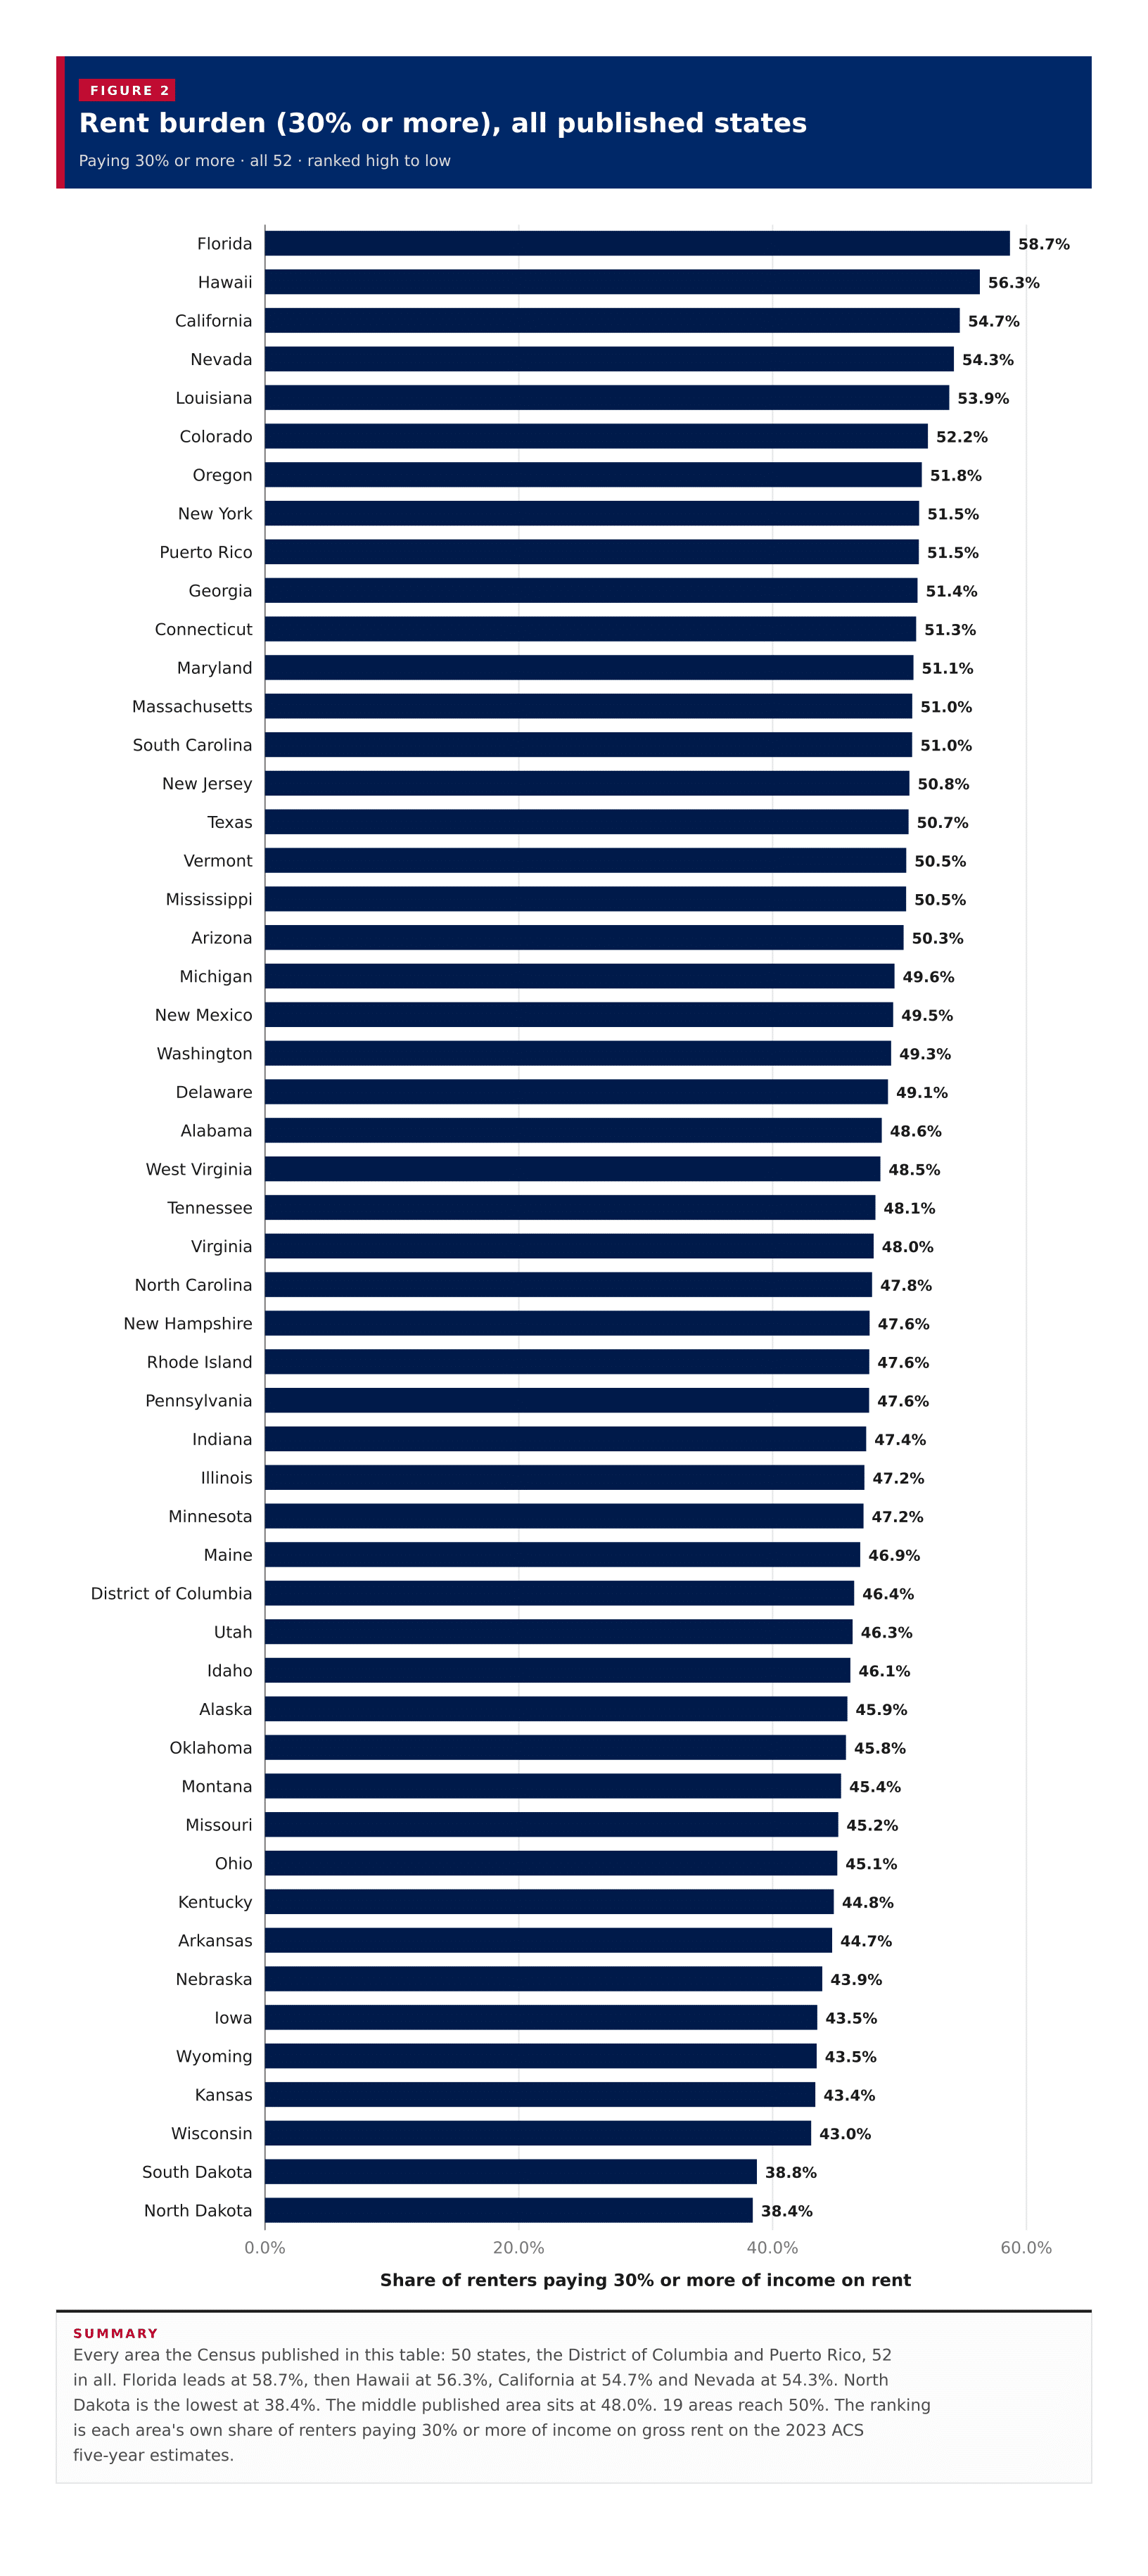
Rent burden (30% or more), all published statesEvery area the Census published in this table: 50 states, the District of Columbia and Puerto Rico, 52 in all. Florida leads at 58.7%, then Hawaii at 56.3%, California at 54.7% and Nevada at 54.3%. North Dakota is the lowest at 38.4%. The middle published area sits at 48.0%. 19 areas reach 50%. The ranking is each area's own share of renters paying 30% or more of income on gross rent on the 2023 ACS five-year estimates.0.0%20.0%40.0%60.0%Share of renters paying 30% or more of income on rent58.7%Florida56.3%Hawaii54.7%California54.3%Nevada53.9%Louisiana52.2%Colorado51.8%Oregon51.5%New York51.5%Puerto Rico51.4%Georgia51.3%Connecticut51.1%Maryland51.0%Massachusetts51.0%South Carolina50.8%New Jersey50.7%Texas50.5%Vermont50.5%Mississippi50.3%Arizona49.6%Michigan49.5%New Mexico49.3%Washington49.1%Delaware48.6%Alabama48.5%West Virginia48.1%Tennessee48.0%Virginia47.8%North Carolina47.6%New Hampshire47.6%Rhode Island47.6%Pennsylvania47.4%Indiana47.2%Illinois47.2%Minnesota46.9%Maine46.4%District of Columbia46.3%Utah46.1%Idaho45.9%Alaska45.8%Oklahoma45.4%Montana45.2%Missouri45.1%Ohio44.8%Kentucky44.7%Arkansas43.9%Nebraska43.5%Iowa43.5%Wyoming43.4%Kansas43.0%Wisconsin38.8%South Dakota38.4%North Dakota
Summary

Every area the Census published in this table: 50 states, the District of Columbia and Puerto Rico, 52 in all. Florida leads at 58.7%, then Hawaii at 56.3%, California at 54.7% and Nevada at 54.3%. North Dakota is the lowest at 38.4%. The middle published area sits at 48.0%. 19 areas reach 50%. The ranking is each area's own share of renters paying 30% or more of income on gross rent on the 2023 ACS five-year estimates.

Figure 2

Severe rent burden (50% or more), all published states

Paying 50% or more · all 52 · ranked high to low

52 items
View100%
DownloadPDFImageCSV
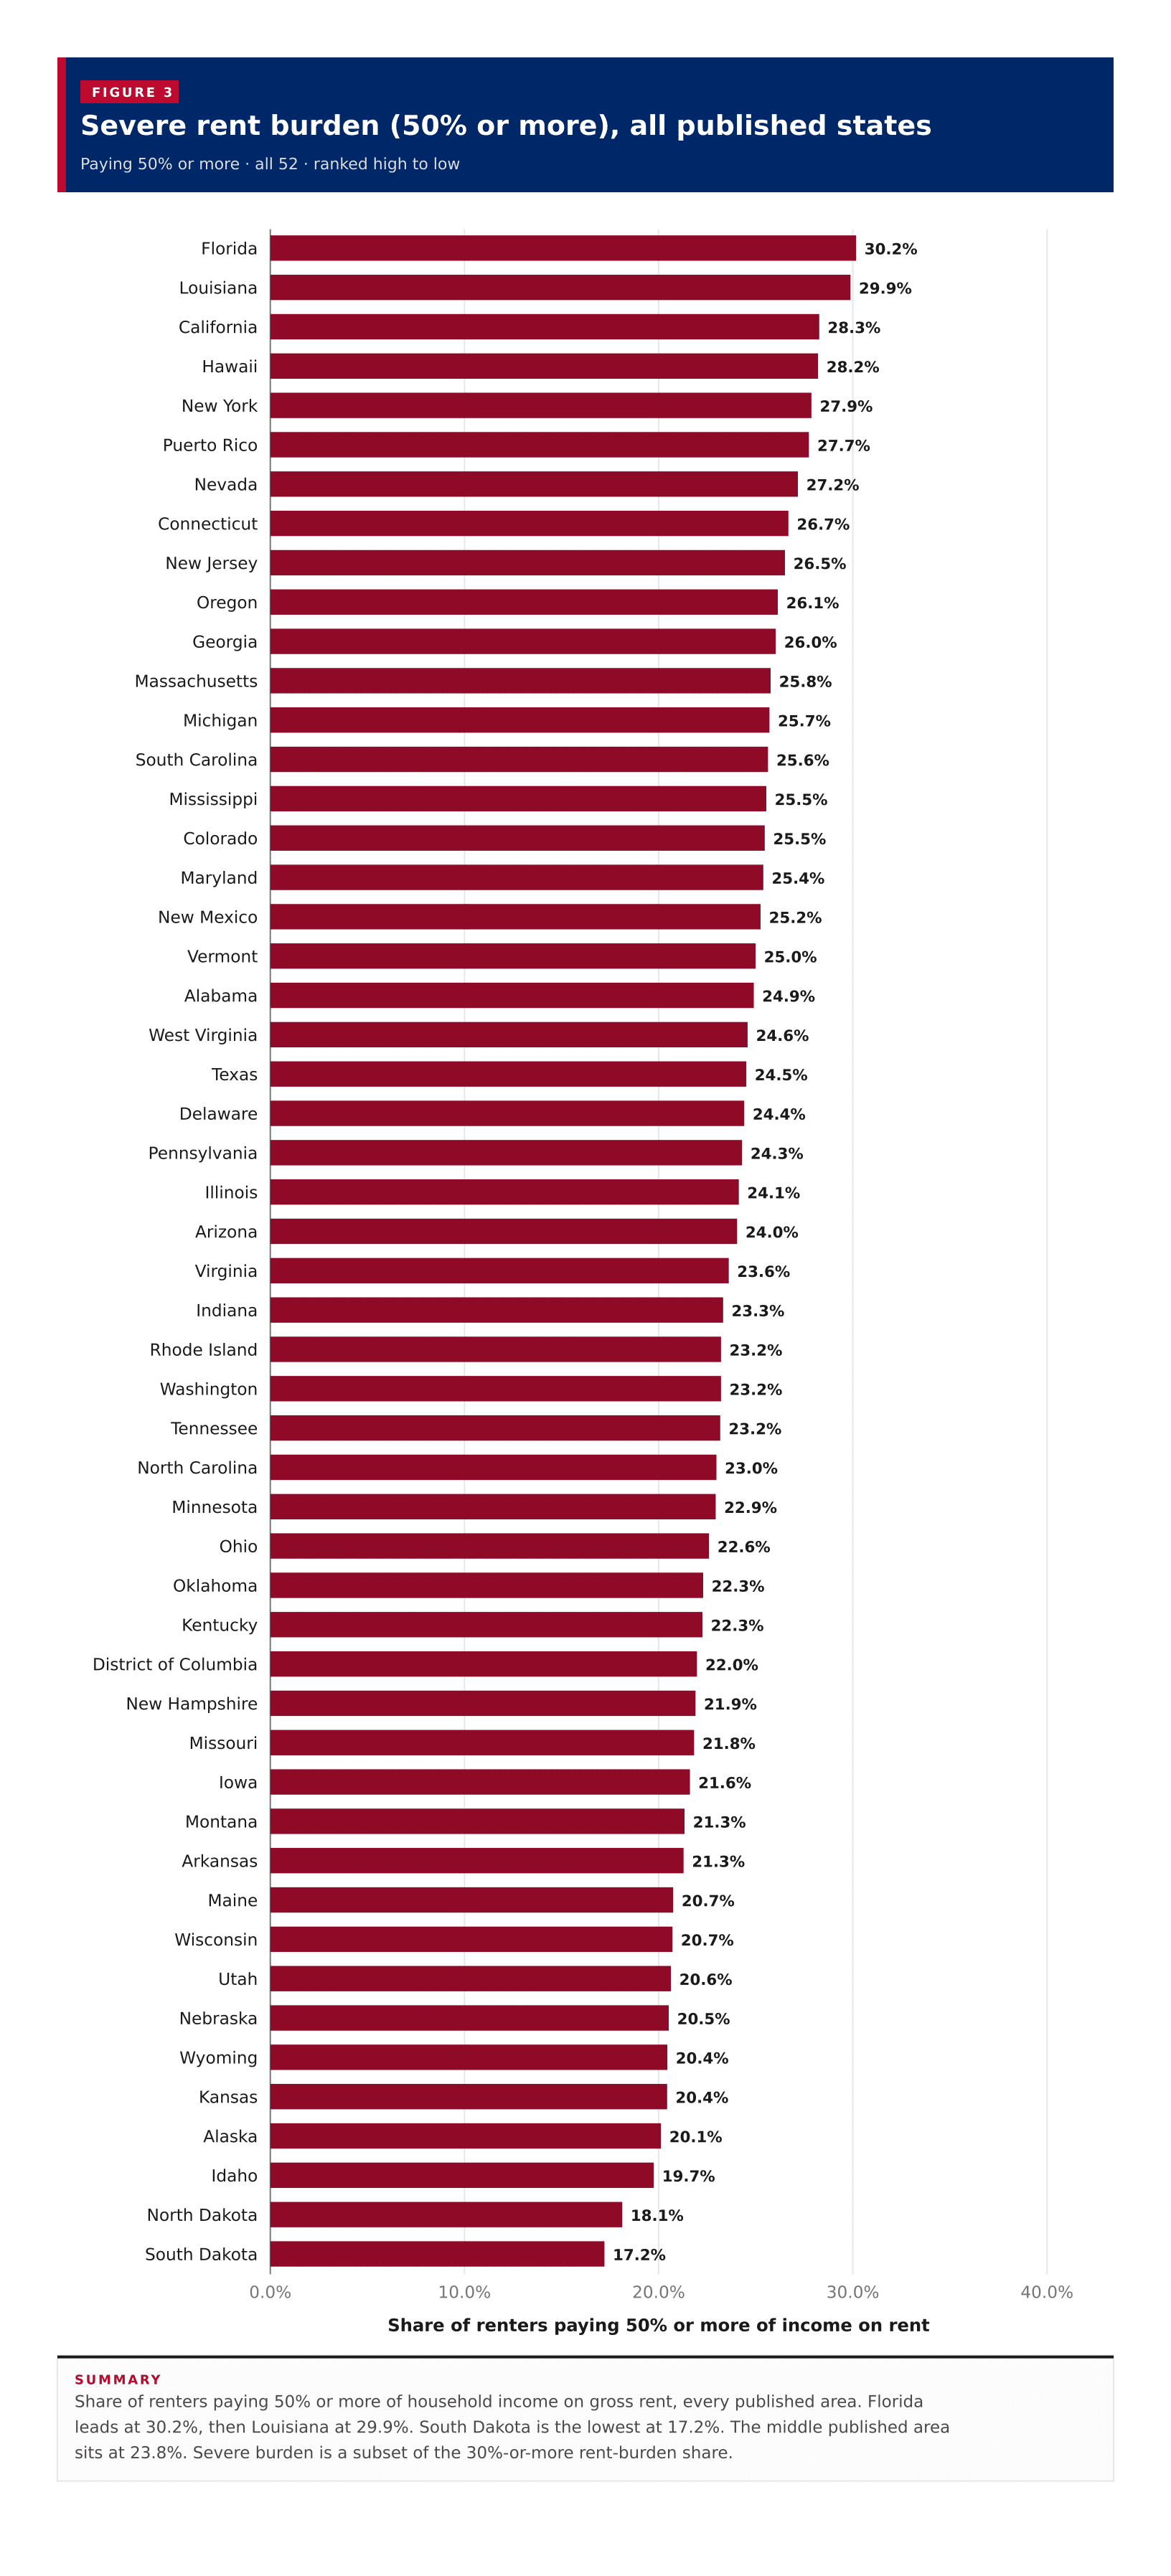
Severe rent burden (50% or more), all published statesShare of renters paying 50% or more of household income on gross rent, every published area. Florida leads at 30.2%, then Louisiana at 29.9%. South Dakota is the lowest at 17.2%. The middle published area sits at 23.8%. Severe burden is a subset of the 30%-or-more rent-burden share.0.0%10.0%20.0%30.0%40.0%Share of renters paying 50% or more of income on rent30.2%Florida29.9%Louisiana28.3%California28.2%Hawaii27.9%New York27.7%Puerto Rico27.2%Nevada26.7%Connecticut26.5%New Jersey26.1%Oregon26.0%Georgia25.8%Massachusetts25.7%Michigan25.6%South Carolina25.5%Mississippi25.5%Colorado25.4%Maryland25.2%New Mexico25.0%Vermont24.9%Alabama24.6%West Virginia24.5%Texas24.4%Delaware24.3%Pennsylvania24.1%Illinois24.0%Arizona23.6%Virginia23.3%Indiana23.2%Rhode Island23.2%Washington23.2%Tennessee23.0%North Carolina22.9%Minnesota22.6%Ohio22.3%Oklahoma22.3%Kentucky22.0%District of Columbia21.9%New Hampshire21.8%Missouri21.6%Iowa21.3%Montana21.3%Arkansas20.7%Maine20.7%Wisconsin20.6%Utah20.5%Nebraska20.4%Wyoming20.4%Kansas20.1%Alaska19.7%Idaho18.1%North Dakota17.2%South Dakota
Summary

Share of renters paying 50% or more of household income on gross rent, every published area. Florida leads at 30.2%, then Louisiana at 29.9%. South Dakota is the lowest at 17.2%. The middle published area sits at 23.8%. Severe burden is a subset of the 30%-or-more rent-burden share.

Figure 3

Median rent share against rent burden

Paying 30% or more against median rent as % of income · one point per row, 52 of 52 plotted

52 items
View100%
DownloadPDFImageCSV
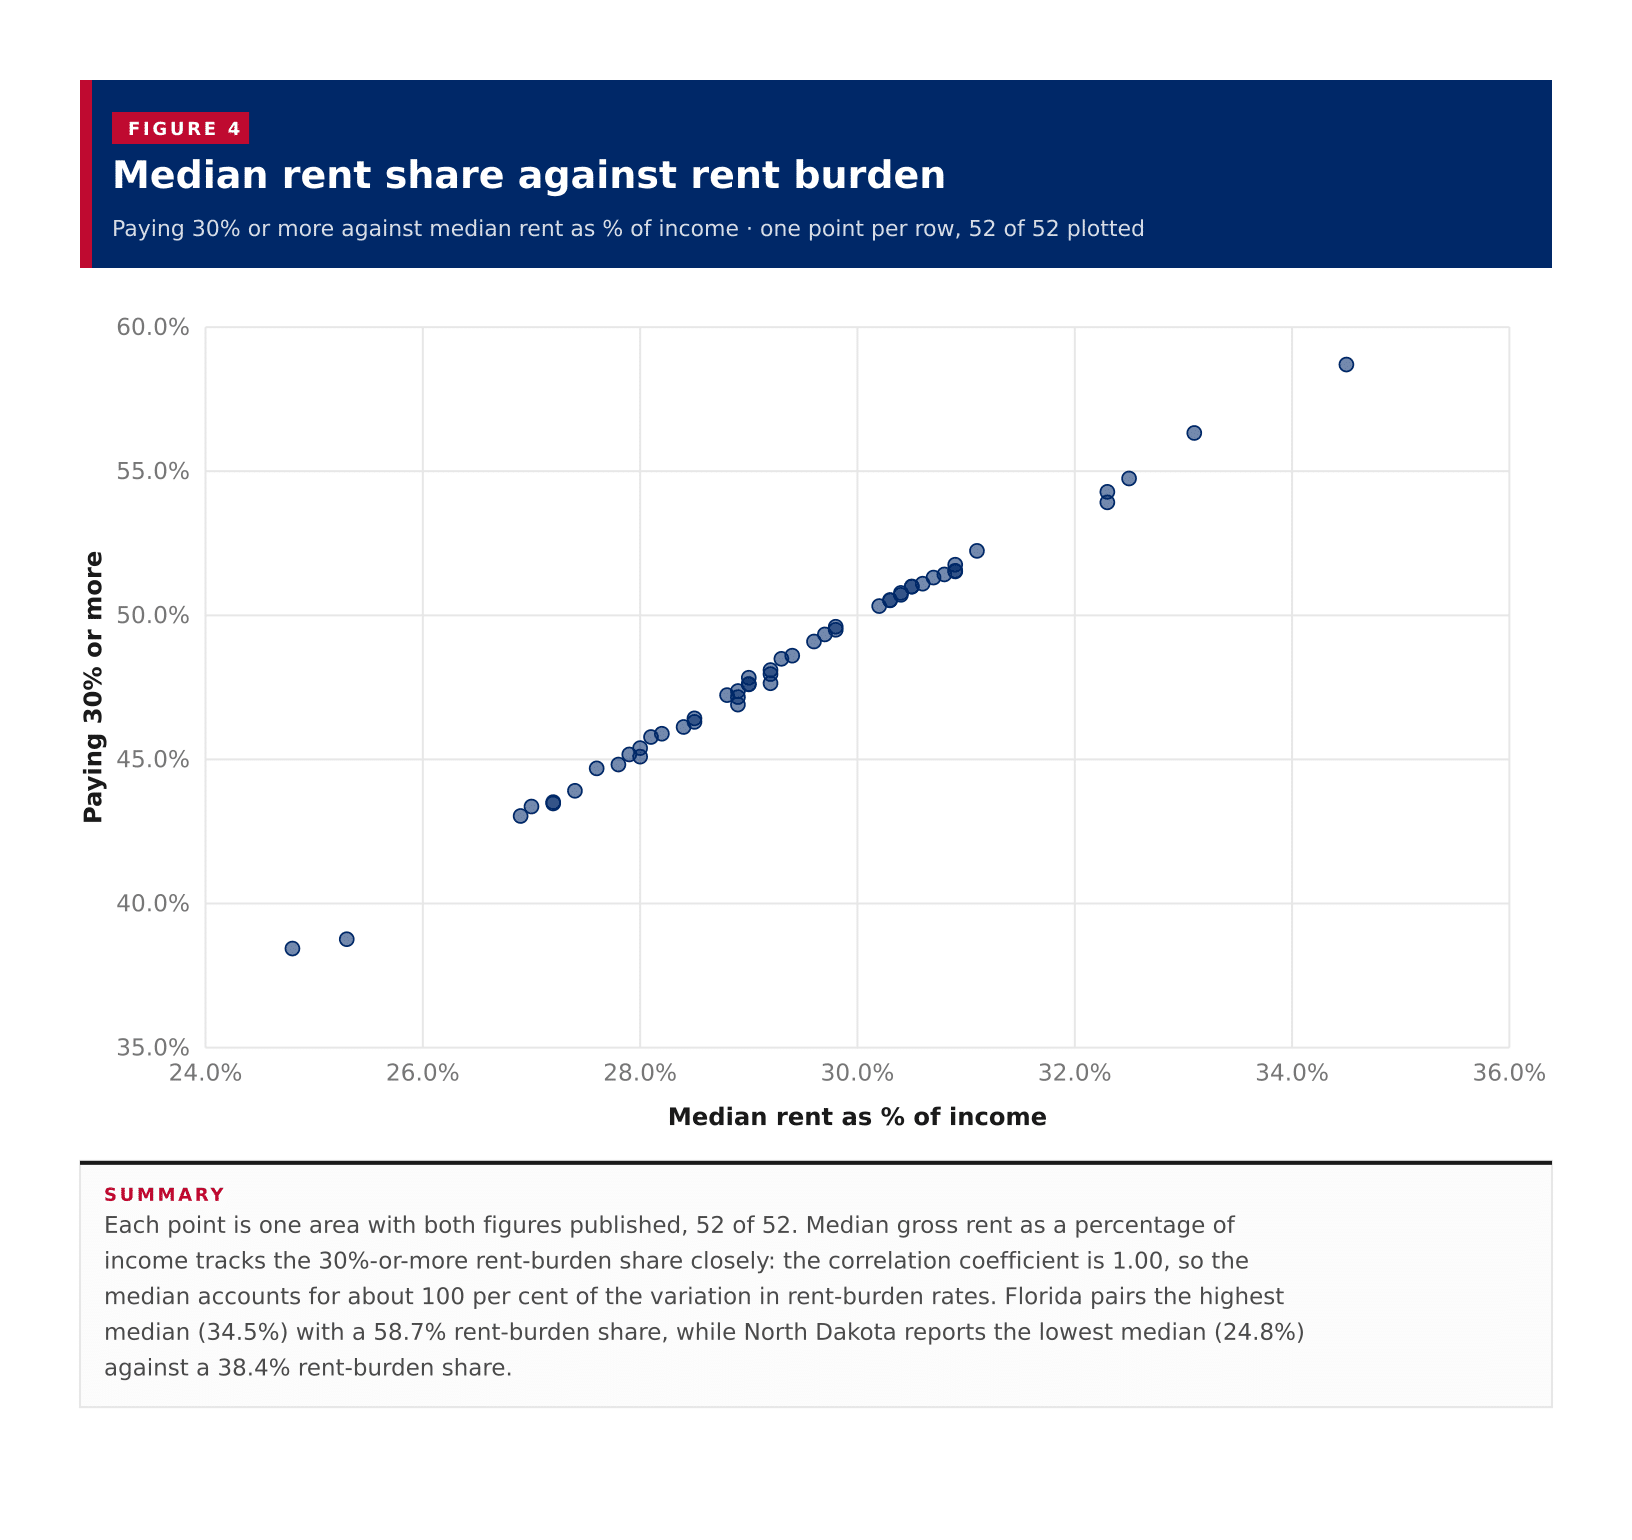
Median rent share against rent burdenEach point is one area with both figures published, 52 of 52. Median gross rent as a percentage of income tracks the 30%-or-more rent-burden share closely: the correlation coefficient is 1.00, so the median accounts for about 100 per cent of the variation in rent-burden rates. Florida pairs the highest median (34.5%) with a 58.7% rent-burden share, while North Dakota reports the lowest median (24.8%) against a 38.4% rent-burden share.35.0%40.0%45.0%50.0%55.0%60.0%24.0%26.0%28.0%30.0%32.0%34.0%36.0%Paying 30% or moreMedian rent as % of income
Summary

Each point is one area with both figures published, 52 of 52. Median gross rent as a percentage of income tracks the 30%-or-more rent-burden share closely: the correlation coefficient is 1.00, so the median accounts for about 100 per cent of the variation in rent-burden rates. Florida pairs the highest median (34.5%) with a 58.7% rent-burden share, while North Dakota reports the lowest median (24.8%) against a 38.4% rent-burden share.

Table 1

All states

52 rows · 7 columns · sorted by paying 30% or more, high to low

52 rows
View100%
DownloadPDFImageCSV
Summary

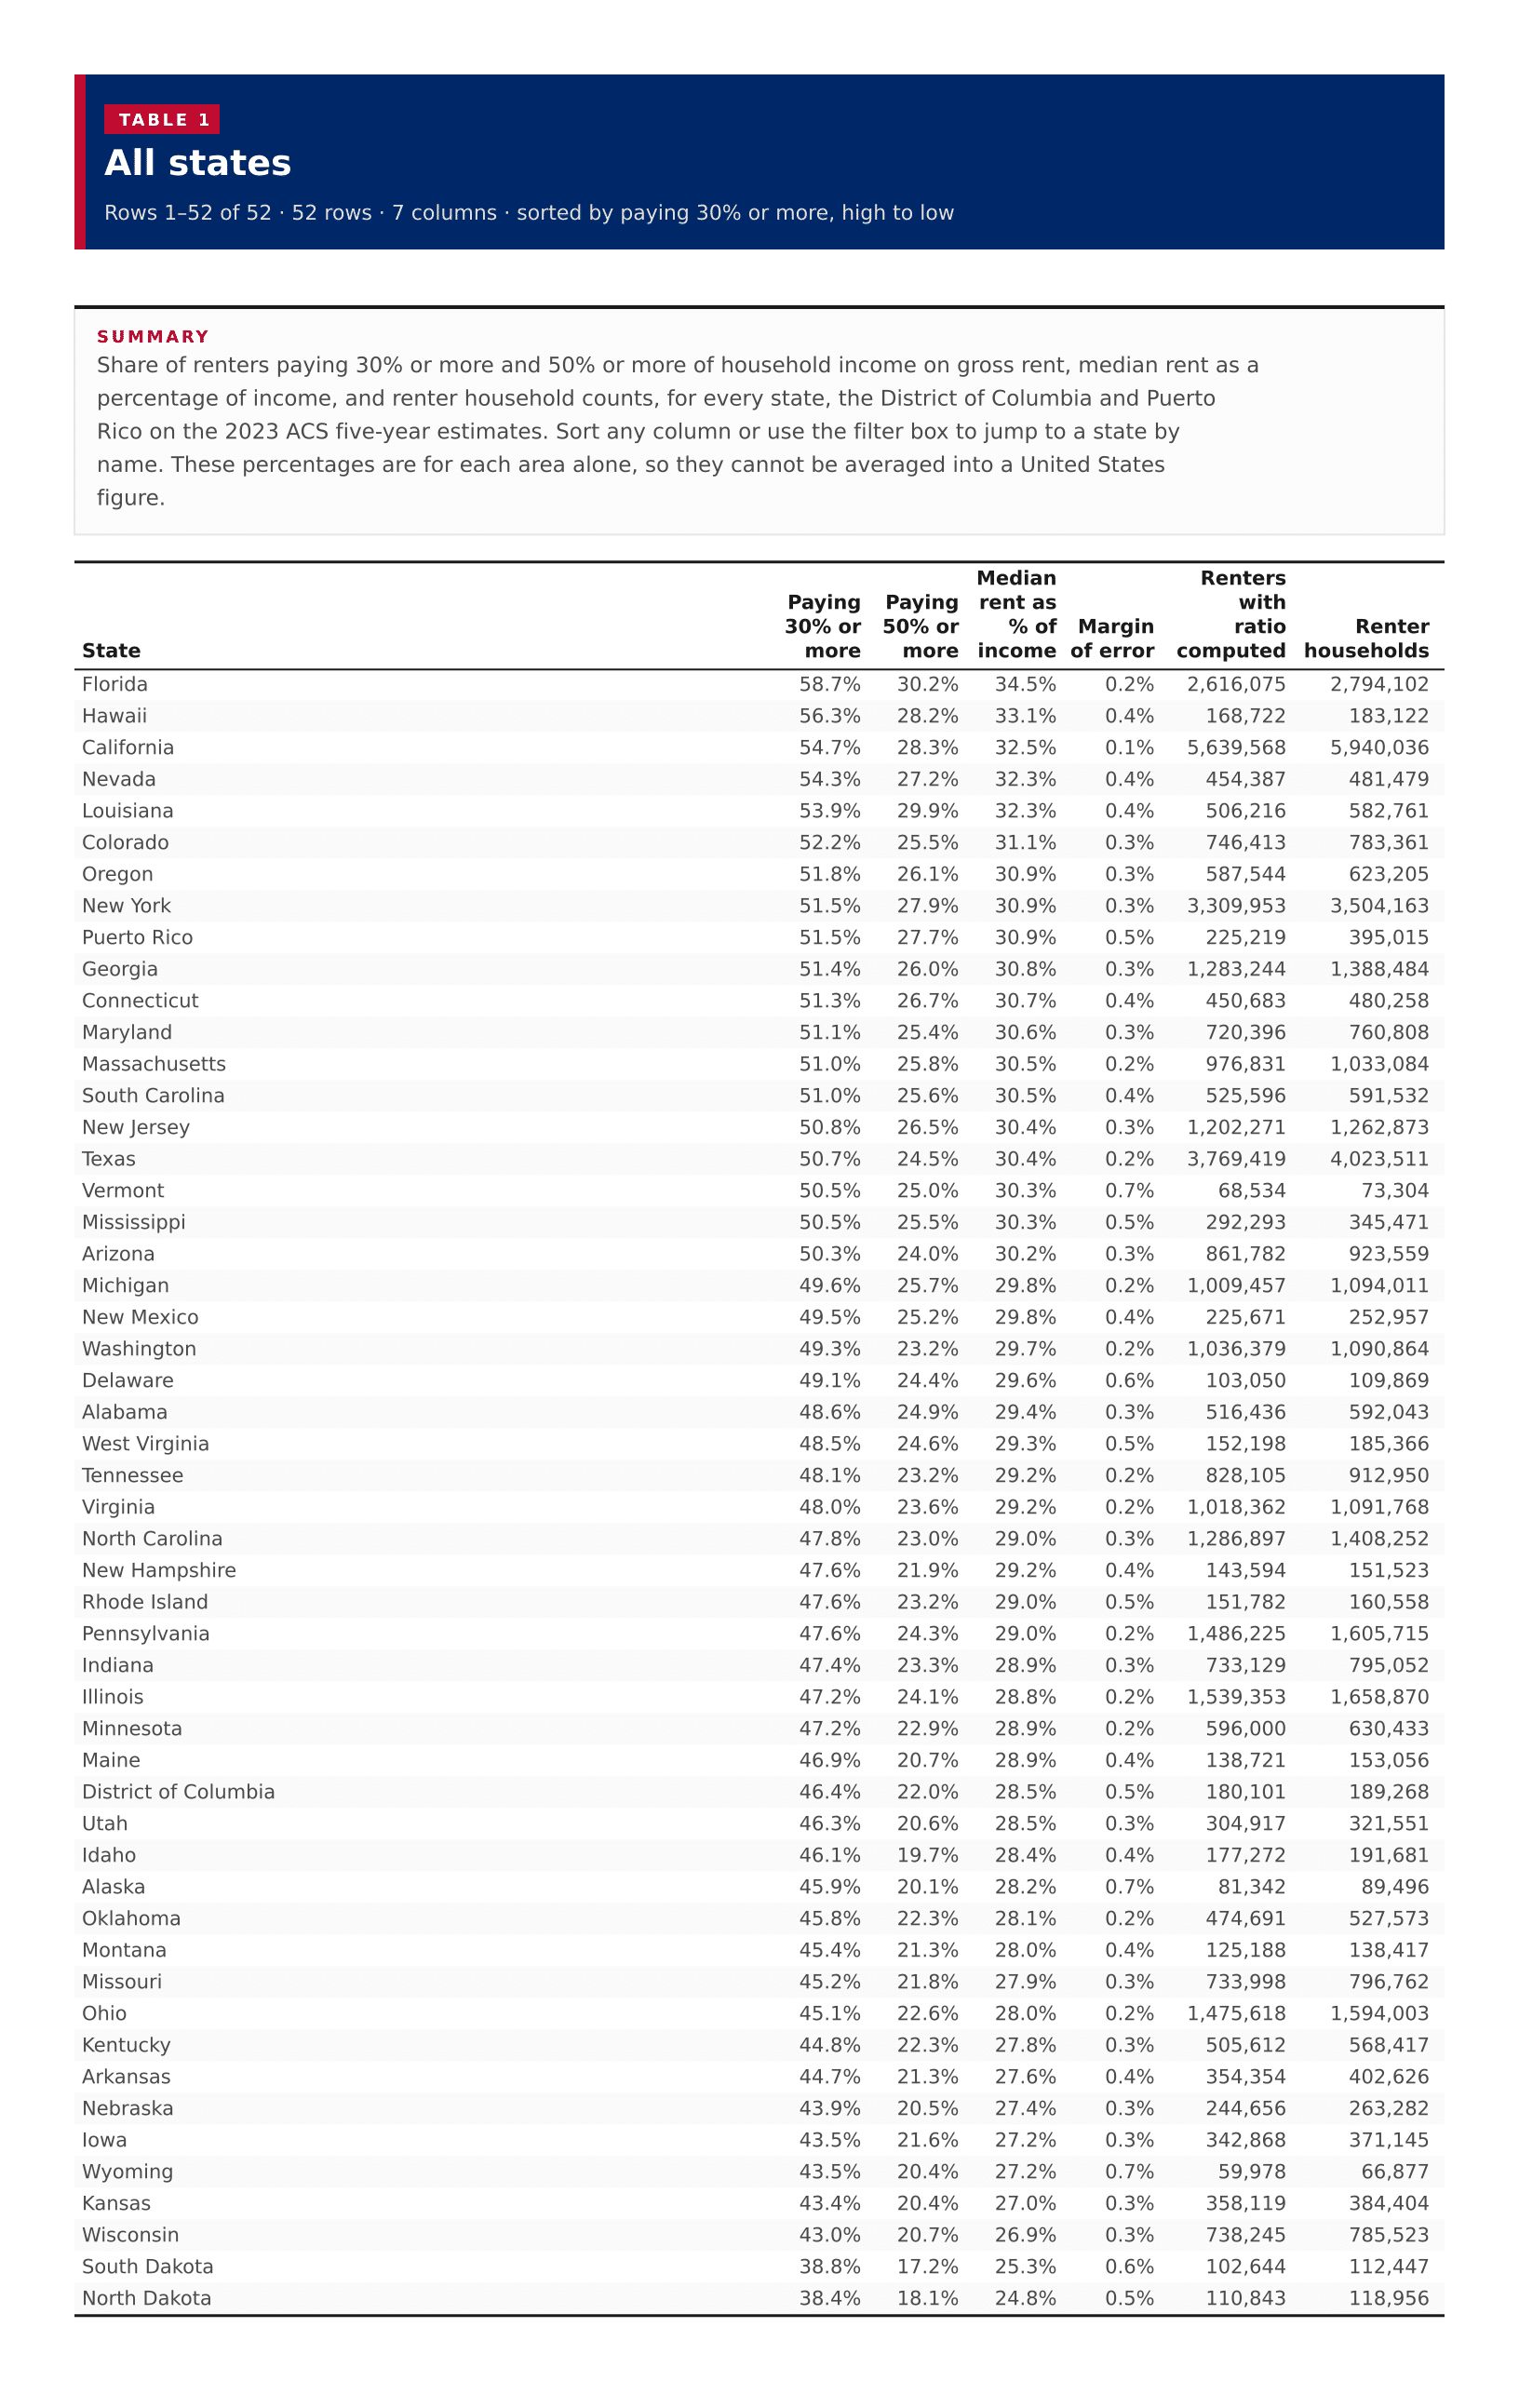
Share of renters paying 30% or more and 50% or more of household income on gross rent, median rent as a percentage of income, and renter household counts, for every state, the District of Columbia and Puerto Rico on the 2023 ACS five-year estimates. Sort any column or use the filter box to jump to a state by name. These percentages are for each area alone, so they cannot be averaged into a United States figure.

All states
??????
Florida58.7%30.2%34.5%0.2%2,616,0752,794,102
Hawaii56.3%28.2%33.1%0.4%168,722183,122
California54.7%28.3%32.5%0.1%5,639,5685,940,036
Nevada54.3%27.2%32.3%0.4%454,387481,479
Louisiana53.9%29.9%32.3%0.4%506,216582,761
Colorado52.2%25.5%31.1%0.3%746,413783,361
Oregon51.8%26.1%30.9%0.3%587,544623,205
New York51.5%27.9%30.9%0.3%3,309,9533,504,163
Puerto Rico51.5%27.7%30.9%0.5%225,219395,015
Georgia51.4%26.0%30.8%0.3%1,283,2441,388,484
Connecticut51.3%26.7%30.7%0.4%450,683480,258
Maryland51.1%25.4%30.6%0.3%720,396760,808
Massachusetts51.0%25.8%30.5%0.2%976,8311,033,084
South Carolina51.0%25.6%30.5%0.4%525,596591,532
New Jersey50.8%26.5%30.4%0.3%1,202,2711,262,873
Texas50.7%24.5%30.4%0.2%3,769,4194,023,511
Vermont50.5%25.0%30.3%0.7%68,53473,304
Mississippi50.5%25.5%30.3%0.5%292,293345,471
Arizona50.3%24.0%30.2%0.3%861,782923,559
Michigan49.6%25.7%29.8%0.2%1,009,4571,094,011
New Mexico49.5%25.2%29.8%0.4%225,671252,957
Washington49.3%23.2%29.7%0.2%1,036,3791,090,864
Delaware49.1%24.4%29.6%0.6%103,050109,869
Alabama48.6%24.9%29.4%0.3%516,436592,043
West Virginia48.5%24.6%29.3%0.5%152,198185,366
Tennessee48.1%23.2%29.2%0.2%828,105912,950
Virginia48.0%23.6%29.2%0.2%1,018,3621,091,768
North Carolina47.8%23.0%29.0%0.3%1,286,8971,408,252
New Hampshire47.6%21.9%29.2%0.4%143,594151,523
Rhode Island47.6%23.2%29.0%0.5%151,782160,558
Pennsylvania47.6%24.3%29.0%0.2%1,486,2251,605,715
Indiana47.4%23.3%28.9%0.3%733,129795,052
Illinois47.2%24.1%28.8%0.2%1,539,3531,658,870
Minnesota47.2%22.9%28.9%0.2%596,000630,433
Maine46.9%20.7%28.9%0.4%138,721153,056
District of Columbia46.4%22.0%28.5%0.5%180,101189,268
Utah46.3%20.6%28.5%0.3%304,917321,551
Idaho46.1%19.7%28.4%0.4%177,272191,681
Alaska45.9%20.1%28.2%0.7%81,34289,496
Oklahoma45.8%22.3%28.1%0.2%474,691527,573
Montana45.4%21.3%28.0%0.4%125,188138,417
Missouri45.2%21.8%27.9%0.3%733,998796,762
Ohio45.1%22.6%28.0%0.2%1,475,6181,594,003
Kentucky44.8%22.3%27.8%0.3%505,612568,417
Arkansas44.7%21.3%27.6%0.4%354,354402,626
Nebraska43.9%20.5%27.4%0.3%244,656263,282
Iowa43.5%21.6%27.2%0.3%342,868371,145
Wyoming43.5%20.4%27.2%0.7%59,97866,877
Kansas43.4%20.4%27.0%0.3%358,119384,404
Wisconsin43.0%20.7%26.9%0.3%738,245785,523
South Dakota38.8%17.2%25.3%0.6%102,644112,447
North Dakota38.4%18.1%24.8%0.5%110,843118,956

Image files

Download all

Figure 2

Rent burden (30% or more), all published states

Figure 2: Rent burden (30% or more), all published states
DownloadPDFImageCSV

Figure 3

Severe rent burden (50% or more), all published states

Figure 3: Severe rent burden (50% or more), all published states
DownloadPDFImageCSV

Figure 4

Median rent share against rent burden

Figure 4: Median rent share against rent burden
DownloadPDFImageCSV

About this data

  • Rent burden is the share of renter households whose gross rent is 30% or more of household income. Severe rent burden is the share at 50% or more. Both are computed from ACS table B25070.
  • The denominator for each share is renter households with a computable rent-to-income ratio. Households where the ratio was not computed (zero or negative income, or no cash rent) are excluded.
  • A midpoint of state shares is not a United States rent-burden rate. Each figure is for that state, the District of Columbia or Puerto Rico alone.
  • Median gross rent as a percentage of household income comes from ACS table B25071. It is the midpoint for renter households in that area and cannot be averaged across states.
  • The Census published 50 states, the District of Columbia and Puerto Rico. None of the estimates were suppressed. Alaska and Hawaii appear in the ranking and table; on the map they are shown in the usual insets.