Recent movers by US state

Summary

Moved in 2021 or later, US states

Moved in 2021 or later by state · all 52 states · hover or tap a state for every figure on this page

52 items
View100%
DownloadPDFImageCSV
StatesDistrict of Columbia
Moved in 2021 or later, US statesDarker amber is a higher share of occupied housing units where the householder moved in during 2021 or later. Puerto Rico is listed in the ranking and table but is not on this map.Alabama · Moved in 2021 or later: 9.4% · Share (margin of error): 0.2% · Owner, moved 2021 or later: 4.0% · Renter, moved 2021 or later: 5.4% · Recent-mover units: 185,732 · Owner recent-mover units: 78,645 · Renter recent-mover units: 107,087 · Occupied housing units: 1,969,105Alaska · Moved in 2021 or later: 11.5% · Share (margin of error): 0.6% · Owner, moved 2021 or later: 4.3% · Renter, moved 2021 or later: 7.2% · Recent-mover units: 30,676 · Owner recent-mover units: 11,462 · Renter recent-mover units: 19,214 · Occupied housing units: 267,865Arizona · Moved in 2021 or later: 11.6% · Share (margin of error): 0.2% · Owner, moved 2021 or later: 4.7% · Renter, moved 2021 or later: 6.9% · Recent-mover units: 324,256 · Owner recent-mover units: 130,775 · Renter recent-mover units: 193,481 · Occupied housing units: 2,796,790Arkansas · Moved in 2021 or later: 10.8% · Share (margin of error): 0.3% · Owner, moved 2021 or later: 3.9% · Renter, moved 2021 or later: 6.9% · Recent-mover units: 128,742 · Owner recent-mover units: 46,667 · Renter recent-mover units: 82,075 · Occupied housing units: 1,189,160California · Moved in 2021 or later: 9.5% · Share (margin of error): 0.1% · Owner, moved 2021 or later: 2.9% · Renter, moved 2021 or later: 6.6% · Recent-mover units: 1,273,693 · Owner recent-mover units: 385,337 · Renter recent-mover units: 888,356 · Occupied housing units: 13,434,847Colorado · Moved in 2021 or later: 12.7% · Share (margin of error): 0.2% · Owner, moved 2021 or later: 4.7% · Renter, moved 2021 or later: 8.1% · Recent-mover units: 296,298 · Owner recent-mover units: 109,081 · Renter recent-mover units: 187,217 · Occupied housing units: 2,325,576Connecticut · Moved in 2021 or later: 8.5% · Share (margin of error): 0.2% · Owner, moved 2021 or later: 3.5% · Renter, moved 2021 or later: 5.0% · Recent-mover units: 121,288 · Owner recent-mover units: 50,000 · Renter recent-mover units: 71,288 · Occupied housing units: 1,420,170Delaware · Moved in 2021 or later: 8.6% · Share (margin of error): 0.4% · Owner, moved 2021 or later: 4.4% · Renter, moved 2021 or later: 4.2% · Recent-mover units: 34,133 · Owner recent-mover units: 17,398 · Renter recent-mover units: 16,735 · Occupied housing units: 396,209Florida · Moved in 2021 or later: 11.5% · Share (margin of error): 0.1% · Owner, moved 2021 or later: 5.0% · Renter, moved 2021 or later: 6.6% · Recent-mover units: 987,271 · Owner recent-mover units: 424,403 · Renter recent-mover units: 562,868 · Occupied housing units: 8,550,911Georgia · Moved in 2021 or later: 10.8% · Share (margin of error): 0.1% · Owner, moved 2021 or later: 4.1% · Renter, moved 2021 or later: 6.7% · Recent-mover units: 431,792 · Owner recent-mover units: 164,889 · Renter recent-mover units: 266,903 · Occupied housing units: 4,008,013Hawaii · Moved in 2021 or later: 10.2% · Share (margin of error): 0.3% · Owner, moved 2021 or later: 3.4% · Renter, moved 2021 or later: 6.8% · Recent-mover units: 49,908 · Owner recent-mover units: 16,477 · Renter recent-mover units: 33,431 · Occupied housing units: 488,991Idaho · Moved in 2021 or later: 10.9% · Share (margin of error): 0.3% · Owner, moved 2021 or later: 4.7% · Renter, moved 2021 or later: 6.2% · Recent-mover units: 75,536 · Owner recent-mover units: 32,710 · Renter recent-mover units: 42,826 · Occupied housing units: 693,821Illinois · Moved in 2021 or later: 9.5% · Share (margin of error): 0.1% · Owner, moved 2021 or later: 3.6% · Renter, moved 2021 or later: 5.9% · Recent-mover units: 476,070 · Owner recent-mover units: 180,271 · Renter recent-mover units: 295,799 · Occupied housing units: 5,001,904Indiana · Moved in 2021 or later: 9.5% · Share (margin of error): 0.1% · Owner, moved 2021 or later: 3.9% · Renter, moved 2021 or later: 5.6% · Recent-mover units: 254,075 · Owner recent-mover units: 103,306 · Renter recent-mover units: 150,769 · Occupied housing units: 2,681,537Iowa · Moved in 2021 or later: 9.8% · Share (margin of error): 0.2% · Owner, moved 2021 or later: 3.9% · Renter, moved 2021 or later: 5.9% · Recent-mover units: 128,163 · Owner recent-mover units: 51,421 · Renter recent-mover units: 76,742 · Occupied housing units: 1,303,763Kansas · Moved in 2021 or later: 10.8% · Share (margin of error): 0.2% · Owner, moved 2021 or later: 3.7% · Renter, moved 2021 or later: 7.1% · Recent-mover units: 125,755 · Owner recent-mover units: 43,400 · Renter recent-mover units: 82,355 · Occupied housing units: 1,160,715Kentucky · Moved in 2021 or later: 9.6% · Share (margin of error): 0.2% · Owner, moved 2021 or later: 3.6% · Renter, moved 2021 or later: 6.0% · Recent-mover units: 172,057 · Owner recent-mover units: 65,259 · Renter recent-mover units: 106,798 · Occupied housing units: 1,791,991Louisiana · Moved in 2021 or later: 9.3% · Share (margin of error): 0.2% · Owner, moved 2021 or later: 3.4% · Renter, moved 2021 or later: 5.9% · Recent-mover units: 165,270 · Owner recent-mover units: 60,386 · Renter recent-mover units: 104,884 · Occupied housing units: 1,783,168Maine · Moved in 2021 or later: 7.7% · Share (margin of error): 0.2% · Owner, moved 2021 or later: 3.7% · Renter, moved 2021 or later: 4.0% · Recent-mover units: 45,489 · Owner recent-mover units: 21,825 · Renter recent-mover units: 23,664 · Occupied housing units: 589,085Maryland · Moved in 2021 or later: 9.3% · Share (margin of error): 0.2% · Owner, moved 2021 or later: 3.8% · Renter, moved 2021 or later: 5.6% · Recent-mover units: 218,629 · Owner recent-mover units: 87,767 · Renter recent-mover units: 130,862 · Occupied housing units: 2,339,510Massachusetts · Moved in 2021 or later: 9.6% · Share (margin of error): 0.2% · Owner, moved 2021 or later: 3.0% · Renter, moved 2021 or later: 6.6% · Recent-mover units: 266,141 · Owner recent-mover units: 82,687 · Renter recent-mover units: 183,454 · Occupied housing units: 2,762,070Michigan · Moved in 2021 or later: 8.3% · Share (margin of error): 0.1% · Owner, moved 2021 or later: 3.6% · Renter, moved 2021 or later: 4.7% · Recent-mover units: 335,269 · Owner recent-mover units: 147,168 · Renter recent-mover units: 188,101 · Occupied housing units: 4,040,168Minnesota · Moved in 2021 or later: 9.7% · Share (margin of error): 0.1% · Owner, moved 2021 or later: 3.9% · Renter, moved 2021 or later: 5.8% · Recent-mover units: 220,866 · Owner recent-mover units: 88,640 · Renter recent-mover units: 132,226 · Occupied housing units: 2,282,967Mississippi · Moved in 2021 or later: 8.2% · Share (margin of error): 0.2% · Owner, moved 2021 or later: 3.3% · Renter, moved 2021 or later: 4.9% · Recent-mover units: 92,745 · Owner recent-mover units: 37,456 · Renter recent-mover units: 55,289 · Occupied housing units: 1,131,760Missouri · Moved in 2021 or later: 10.1% · Share (margin of error): 0.1% · Owner, moved 2021 or later: 3.8% · Renter, moved 2021 or later: 6.2% · Recent-mover units: 250,170 · Owner recent-mover units: 95,142 · Renter recent-mover units: 155,028 · Occupied housing units: 2,484,834Montana · Moved in 2021 or later: 10.2% · Share (margin of error): 0.4% · Owner, moved 2021 or later: 4.1% · Renter, moved 2021 or later: 6.1% · Recent-mover units: 46,339 · Owner recent-mover units: 18,664 · Renter recent-mover units: 27,675 · Occupied housing units: 452,683Nebraska · Moved in 2021 or later: 10.6% · Share (margin of error): 0.2% · Owner, moved 2021 or later: 3.5% · Renter, moved 2021 or later: 7.1% · Recent-mover units: 83,039 · Owner recent-mover units: 27,555 · Renter recent-mover units: 55,484 · Occupied housing units: 786,885Nevada · Moved in 2021 or later: 11.9% · Share (margin of error): 0.2% · Owner, moved 2021 or later: 4.3% · Renter, moved 2021 or later: 7.6% · Recent-mover units: 140,464 · Owner recent-mover units: 50,766 · Renter recent-mover units: 89,698 · Occupied housing units: 1,183,393New Hampshire · Moved in 2021 or later: 7.8% · Share (margin of error): 0.3% · Owner, moved 2021 or later: 3.5% · Renter, moved 2021 or later: 4.3% · Recent-mover units: 42,936 · Owner recent-mover units: 19,294 · Renter recent-mover units: 23,642 · Occupied housing units: 551,186New Jersey · Moved in 2021 or later: 8.3% · Share (margin of error): 0.1% · Owner, moved 2021 or later: 3.3% · Renter, moved 2021 or later: 5.0% · Recent-mover units: 287,715 · Owner recent-mover units: 114,485 · Renter recent-mover units: 173,230 · Occupied housing units: 3,478,355New Mexico · Moved in 2021 or later: 9.8% · Share (margin of error): 0.3% · Owner, moved 2021 or later: 4.0% · Renter, moved 2021 or later: 5.8% · Recent-mover units: 80,770 · Owner recent-mover units: 33,277 · Renter recent-mover units: 47,493 · Occupied housing units: 825,021New York · Moved in 2021 or later: 8.4% · Share (margin of error): 0.1% · Owner, moved 2021 or later: 2.4% · Renter, moved 2021 or later: 5.9% · Recent-mover units: 642,916 · Owner recent-mover units: 187,309 · Renter recent-mover units: 455,607 · Occupied housing units: 7,668,956North Carolina · Moved in 2021 or later: 10.5% · Share (margin of error): 0.1% · Owner, moved 2021 or later: 3.9% · Renter, moved 2021 or later: 6.6% · Recent-mover units: 439,593 · Owner recent-mover units: 164,921 · Renter recent-mover units: 274,672 · Occupied housing units: 4,186,924North Dakota · Moved in 2021 or later: 11.9% · Share (margin of error): 0.5% · Owner, moved 2021 or later: 3.6% · Renter, moved 2021 or later: 8.3% · Recent-mover units: 38,687 · Owner recent-mover units: 11,761 · Renter recent-mover units: 26,926 · Occupied housing units: 325,079Ohio · Moved in 2021 or later: 9.0% · Share (margin of error): 0.1% · Owner, moved 2021 or later: 3.3% · Renter, moved 2021 or later: 5.7% · Recent-mover units: 435,253 · Owner recent-mover units: 158,510 · Renter recent-mover units: 276,743 · Occupied housing units: 4,829,571Oklahoma · Moved in 2021 or later: 11.0% · Share (margin of error): 0.2% · Owner, moved 2021 or later: 3.7% · Renter, moved 2021 or later: 7.3% · Recent-mover units: 169,645 · Owner recent-mover units: 57,135 · Renter recent-mover units: 112,510 · Occupied housing units: 1,542,780Oregon · Moved in 2021 or later: 10.9% · Share (margin of error): 0.2% · Owner, moved 2021 or later: 4.0% · Renter, moved 2021 or later: 6.9% · Recent-mover units: 185,421 · Owner recent-mover units: 68,749 · Renter recent-mover units: 116,672 · Occupied housing units: 1,701,548Pennsylvania · Moved in 2021 or later: 8.1% · Share (margin of error): 0.1% · Owner, moved 2021 or later: 3.1% · Renter, moved 2021 or later: 5.0% · Recent-mover units: 425,959 · Owner recent-mover units: 161,696 · Renter recent-mover units: 264,263 · Occupied housing units: 5,235,339Rhode Island · Moved in 2021 or later: 8.6% · Share (margin of error): 0.4% · Owner, moved 2021 or later: 3.4% · Renter, moved 2021 or later: 5.3% · Recent-mover units: 37,683 · Owner recent-mover units: 14,716 · Renter recent-mover units: 22,967 · Occupied housing units: 436,902South Carolina · Moved in 2021 or later: 10.2% · Share (margin of error): 0.2% · Owner, moved 2021 or later: 4.8% · Renter, moved 2021 or later: 5.4% · Recent-mover units: 211,118 · Owner recent-mover units: 99,457 · Renter recent-mover units: 111,661 · Occupied housing units: 2,070,390South Dakota · Moved in 2021 or later: 10.2% · Share (margin of error): 0.4% · Owner, moved 2021 or later: 3.9% · Renter, moved 2021 or later: 6.3% · Recent-mover units: 36,401 · Owner recent-mover units: 13,844 · Renter recent-mover units: 22,557 · Occupied housing units: 358,552Tennessee · Moved in 2021 or later: 10.3% · Share (margin of error): 0.2% · Owner, moved 2021 or later: 3.8% · Renter, moved 2021 or later: 6.4% · Recent-mover units: 284,561 · Owner recent-mover units: 106,454 · Renter recent-mover units: 178,107 · Occupied housing units: 2,768,743Texas · Moved in 2021 or later: 12.6% · Share (margin of error): 0.1% · Owner, moved 2021 or later: 3.9% · Renter, moved 2021 or later: 8.7% · Recent-mover units: 1,352,166 · Owner recent-mover units: 422,268 · Renter recent-mover units: 929,898 · Occupied housing units: 10,747,240Utah · Moved in 2021 or later: 11.9% · Share (margin of error): 0.2% · Owner, moved 2021 or later: 4.6% · Renter, moved 2021 or later: 7.3% · Recent-mover units: 129,974 · Owner recent-mover units: 49,994 · Renter recent-mover units: 79,980 · Occupied housing units: 1,094,896Vermont · Moved in 2021 or later: 8.2% · Share (margin of error): 0.4% · Owner, moved 2021 or later: 3.4% · Renter, moved 2021 or later: 4.8% · Recent-mover units: 22,117 · Owner recent-mover units: 9,201 · Renter recent-mover units: 12,916 · Occupied housing units: 269,466Virginia · Moved in 2021 or later: 10.7% · Share (margin of error): 0.1% · Owner, moved 2021 or later: 4.1% · Renter, moved 2021 or later: 6.6% · Recent-mover units: 354,590 · Owner recent-mover units: 135,632 · Renter recent-mover units: 218,958 · Occupied housing units: 3,326,260Washington · Moved in 2021 or later: 11.6% · Share (margin of error): 0.1% · Owner, moved 2021 or later: 4.1% · Renter, moved 2021 or later: 7.5% · Recent-mover units: 351,224 · Owner recent-mover units: 123,975 · Renter recent-mover units: 227,249 · Occupied housing units: 3,020,558West Virginia · Moved in 2021 or later: 7.6% · Share (margin of error): 0.2% · Owner, moved 2021 or later: 3.1% · Renter, moved 2021 or later: 4.4% · Recent-mover units: 54,567 · Owner recent-mover units: 22,652 · Renter recent-mover units: 31,915 · Occupied housing units: 721,448Wisconsin · Moved in 2021 or later: 9.3% · Share (margin of error): 0.1% · Owner, moved 2021 or later: 3.3% · Renter, moved 2021 or later: 6.0% · Recent-mover units: 228,450 · Owner recent-mover units: 80,586 · Renter recent-mover units: 147,864 · Occupied housing units: 2,446,028Wyoming · Moved in 2021 or later: 10.8% · Share (margin of error): 0.6% · Owner, moved 2021 or later: 4.4% · Renter, moved 2021 or later: 6.4% · Recent-mover units: 25,797 · Owner recent-mover units: 10,573 · Renter recent-mover units: 15,224 · Occupied housing units: 238,176District of Columbia · Moved in 2021 or later: 16.1% · Share (margin of error): 0.6% · Owner, moved 2021 or later: 3.3% · Renter, moved 2021 or later: 12.8% · Recent-mover units: 51,639 · Owner recent-mover units: 10,538 · Renter recent-mover units: 41,101 · Occupied housing units: 321,556District of Columbia · Moved in 2021 or later: 16.1% · Share (margin of error): 0.6% · Owner, moved 2021 or later: 3.3% · Renter, moved 2021 or later: 12.8% · Recent-mover units: 51,639 · Owner recent-mover units: 10,538 · Renter recent-mover units: 41,101 · Occupied housing units: 321,556Moved in 2021 or later7.6%16.1%
Summary

Darker amber is a higher share of occupied housing units where the householder moved in during 2021 or later. Puerto Rico is listed in the ranking and table but is not on this map.

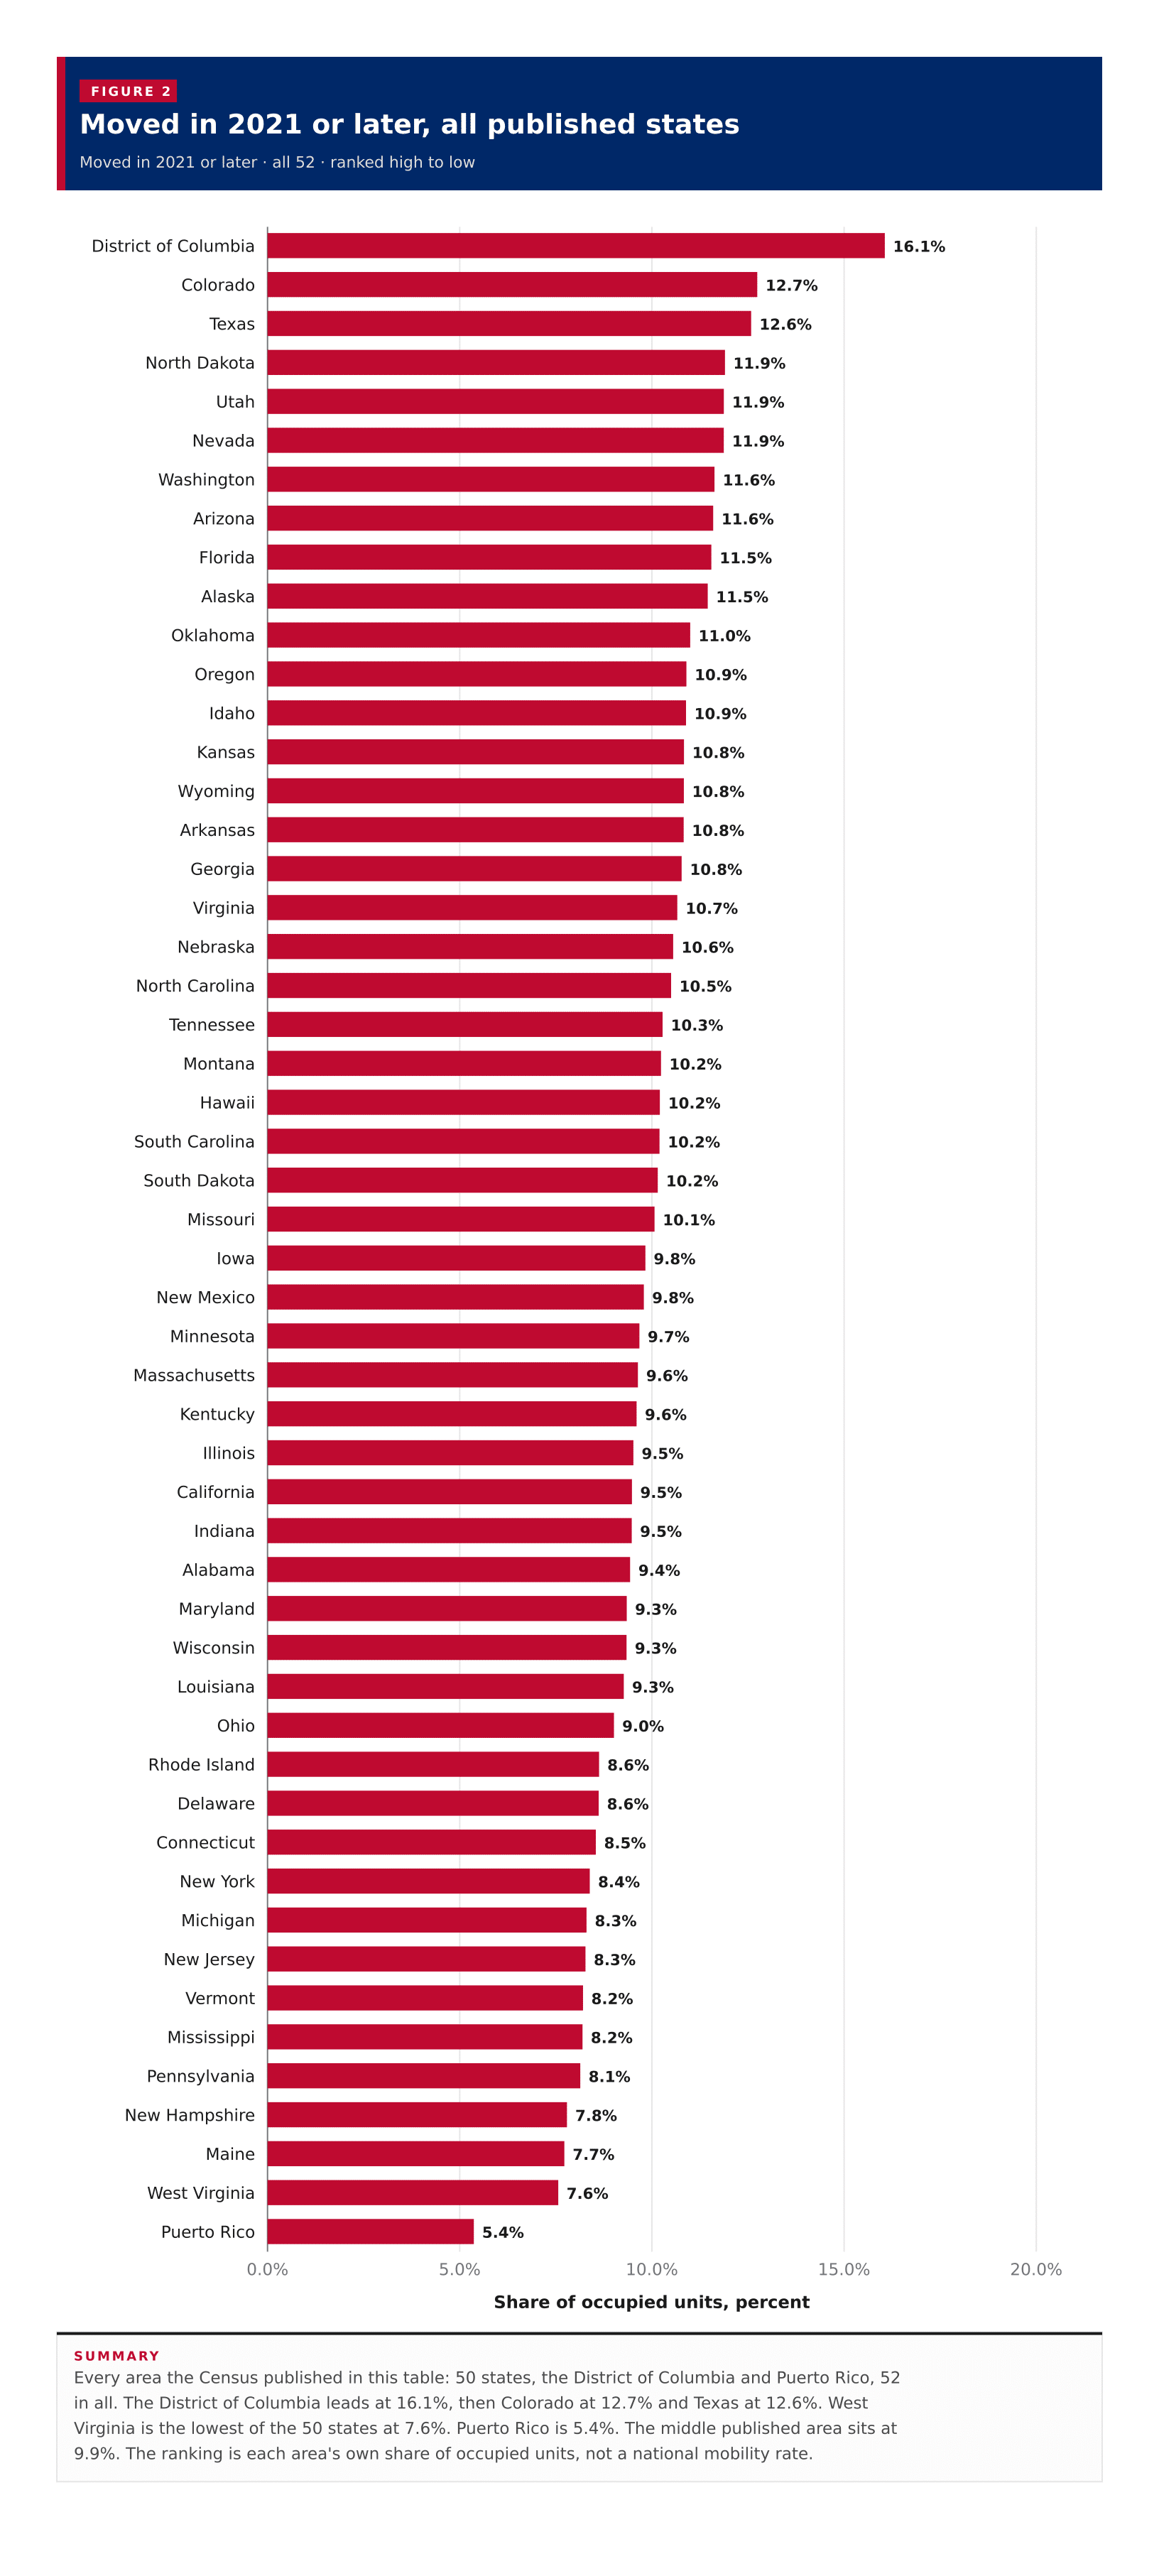
A typical published area has 9.9% of occupied housing units where the householder moved in during 2021 or later, the midpoint of the 50 states, the District of Columbia and Puerto Rico on the 2023 ACS five-year estimates. The District of Columbia leads at 16.1%, and Colorado is the highest of the 50 states at 12.7%. West Virginia is the lowest of the 50 states at 7.6%. Puerto Rico, which this table also returns, sits lower at 5.4%. In most areas renters account for more of that recent-mover share than owners. These are shares of occupied units in each area, not a national mobility rate.

In short

9.9%typical published areamidpoint of state shares, not a US rate
16.1%District of Columbiahighest share moved in 2021 or later
12.7%Coloradohighest of the 50 states
7.6%West Virginialowest of the 50 states
5.4%Puerto Ricolowest figure the Census published
Figure 1

Moved in 2021 or later, all published states

Moved in 2021 or later · all 52 · ranked high to low

52 items
View100%
DownloadPDFImageCSV
Moved in 2021 or later, all published statesEvery area the Census published in this table: 50 states, the District of Columbia and Puerto Rico, 52 in all. The District of Columbia leads at 16.1%, then Colorado at 12.7% and Texas at 12.6%. West Virginia is the lowest of the 50 states at 7.6%. Puerto Rico is 5.4%. The middle published area sits at 9.9%. The ranking is each area's own share of occupied units, not a national mobility rate.0.0%5.0%10.0%15.0%20.0%Share of occupied units, percent16.1%District of Columbia12.7%Colorado12.6%Texas11.9%North Dakota11.9%Utah11.9%Nevada11.6%Washington11.6%Arizona11.5%Florida11.5%Alaska11.0%Oklahoma10.9%Oregon10.9%Idaho10.8%Kansas10.8%Wyoming10.8%Arkansas10.8%Georgia10.7%Virginia10.6%Nebraska10.5%North Carolina10.3%Tennessee10.2%Montana10.2%Hawaii10.2%South Carolina10.2%South Dakota10.1%Missouri9.8%Iowa9.8%New Mexico9.7%Minnesota9.6%Massachusetts9.6%Kentucky9.5%Illinois9.5%California9.5%Indiana9.4%Alabama9.3%Maryland9.3%Wisconsin9.3%Louisiana9.0%Ohio8.6%Rhode Island8.6%Delaware8.5%Connecticut8.4%New York8.3%Michigan8.3%New Jersey8.2%Vermont8.2%Mississippi8.1%Pennsylvania7.8%New Hampshire7.7%Maine7.6%West Virginia5.4%Puerto Rico
Summary

Every area the Census published in this table: 50 states, the District of Columbia and Puerto Rico, 52 in all. The District of Columbia leads at 16.1%, then Colorado at 12.7% and Texas at 12.6%. West Virginia is the lowest of the 50 states at 7.6%. Puerto Rico is 5.4%. The middle published area sits at 9.9%. The ranking is each area's own share of occupied units, not a national mobility rate.

Figure 2

Owner-occupied, moved in 2021 or later, all published states

Owner, moved 2021 or later · all 52 · ranked high to low

52 items
View100%
DownloadPDFImageCSV
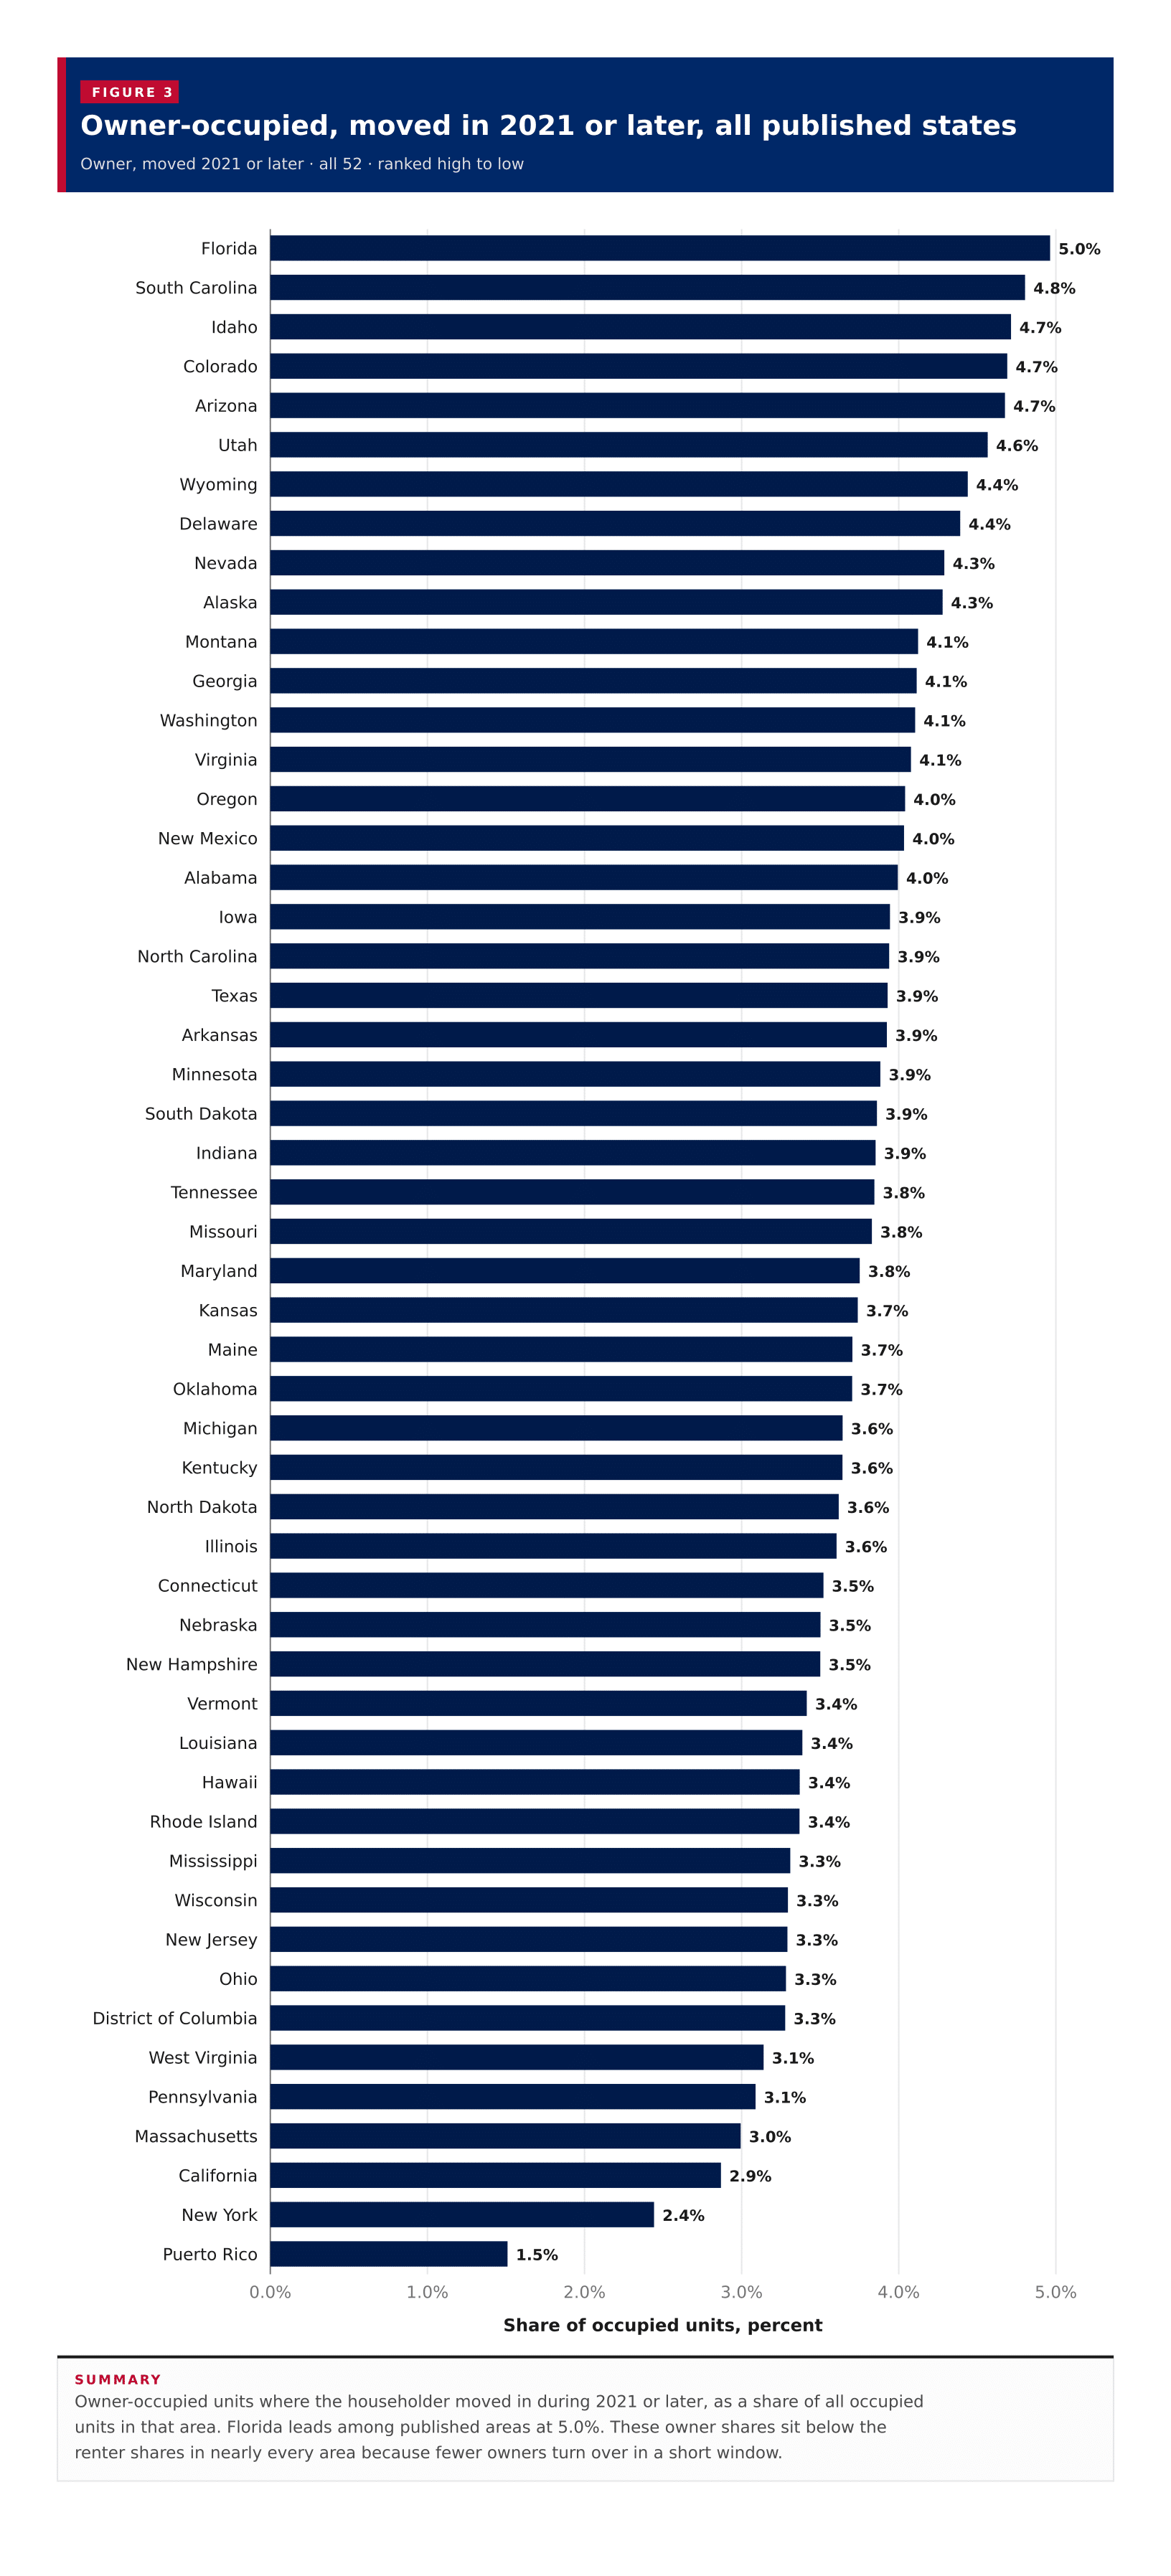
Owner-occupied, moved in 2021 or later, all published statesOwner-occupied units where the householder moved in during 2021 or later, as a share of all occupied units in that area. Florida leads among published areas at 5.0%. These owner shares sit below the renter shares in nearly every area because fewer owners turn over in a short window.0.0%1.0%2.0%3.0%4.0%5.0%Share of occupied units, percent5.0%Florida4.8%South Carolina4.7%Idaho4.7%Colorado4.7%Arizona4.6%Utah4.4%Wyoming4.4%Delaware4.3%Nevada4.3%Alaska4.1%Montana4.1%Georgia4.1%Washington4.1%Virginia4.0%Oregon4.0%New Mexico4.0%Alabama3.9%Iowa3.9%North Carolina3.9%Texas3.9%Arkansas3.9%Minnesota3.9%South Dakota3.9%Indiana3.8%Tennessee3.8%Missouri3.8%Maryland3.7%Kansas3.7%Maine3.7%Oklahoma3.6%Michigan3.6%Kentucky3.6%North Dakota3.6%Illinois3.5%Connecticut3.5%Nebraska3.5%New Hampshire3.4%Vermont3.4%Louisiana3.4%Hawaii3.4%Rhode Island3.3%Mississippi3.3%Wisconsin3.3%New Jersey3.3%Ohio3.3%District of Columbia3.1%West Virginia3.1%Pennsylvania3.0%Massachusetts2.9%California2.4%New York1.5%Puerto Rico
Summary

Owner-occupied units where the householder moved in during 2021 or later, as a share of all occupied units in that area. Florida leads among published areas at 5.0%. These owner shares sit below the renter shares in nearly every area because fewer owners turn over in a short window.

Figure 3

Renter-occupied, moved in 2021 or later, all published states

Renter, moved 2021 or later · all 52 · ranked high to low

52 items
View100%
DownloadPDFImageCSV
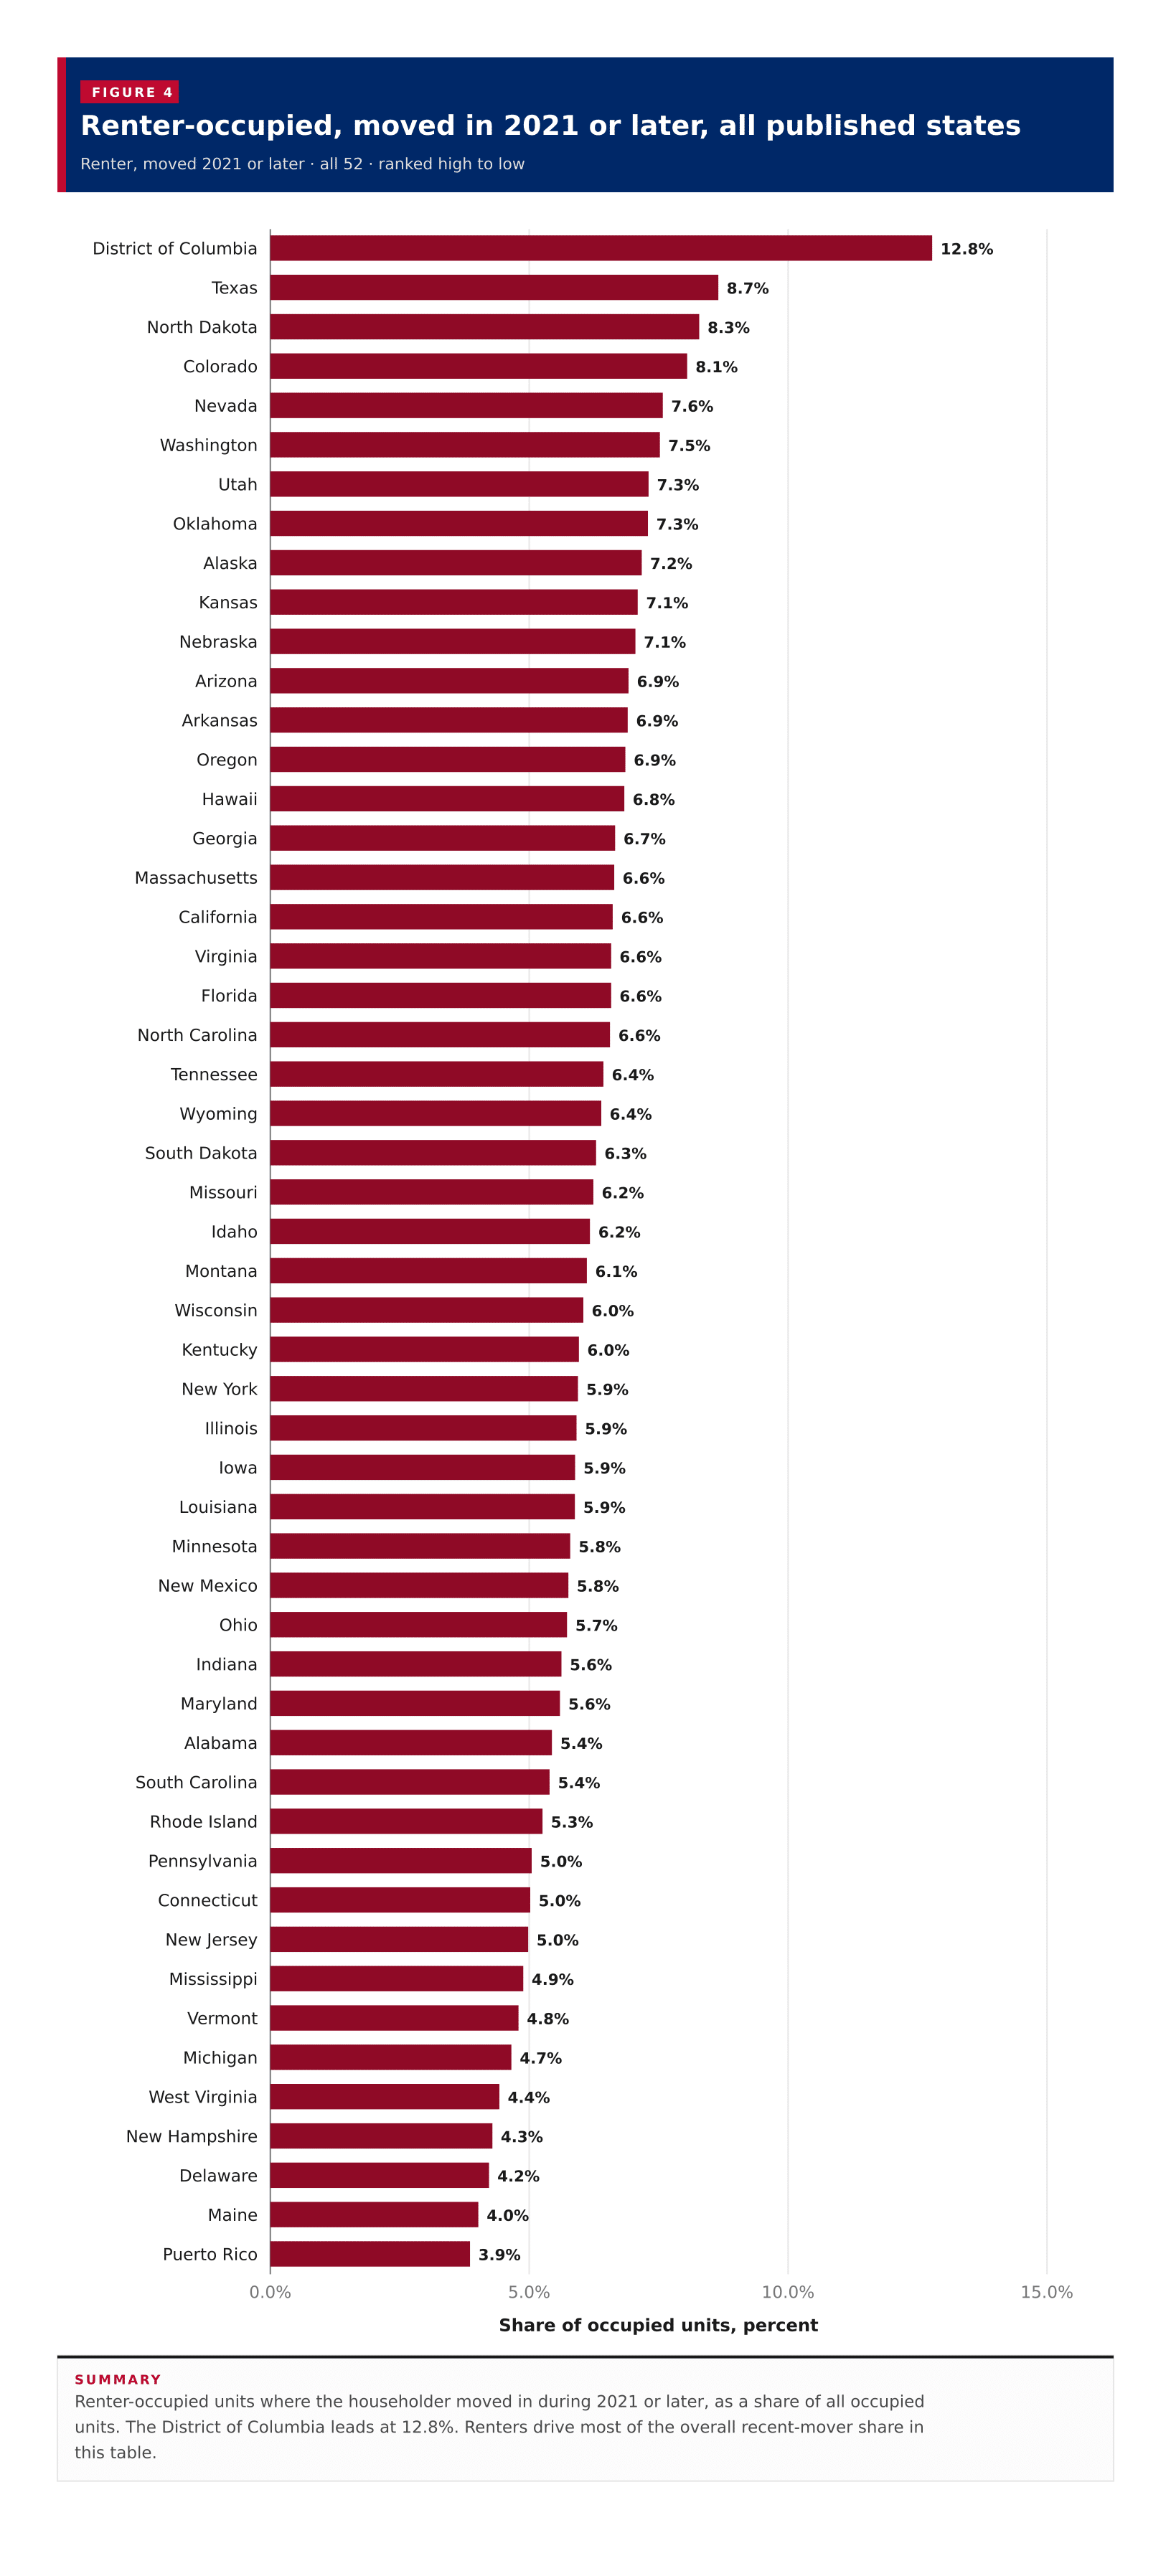
Renter-occupied, moved in 2021 or later, all published statesRenter-occupied units where the householder moved in during 2021 or later, as a share of all occupied units. The District of Columbia leads at 12.8%. Renters drive most of the overall recent-mover share in this table.0.0%5.0%10.0%15.0%Share of occupied units, percent12.8%District of Columbia8.7%Texas8.3%North Dakota8.1%Colorado7.6%Nevada7.5%Washington7.3%Utah7.3%Oklahoma7.2%Alaska7.1%Kansas7.1%Nebraska6.9%Arizona6.9%Arkansas6.9%Oregon6.8%Hawaii6.7%Georgia6.6%Massachusetts6.6%California6.6%Virginia6.6%Florida6.6%North Carolina6.4%Tennessee6.4%Wyoming6.3%South Dakota6.2%Missouri6.2%Idaho6.1%Montana6.0%Wisconsin6.0%Kentucky5.9%New York5.9%Illinois5.9%Iowa5.9%Louisiana5.8%Minnesota5.8%New Mexico5.7%Ohio5.6%Indiana5.6%Maryland5.4%Alabama5.4%South Carolina5.3%Rhode Island5.0%Pennsylvania5.0%Connecticut5.0%New Jersey4.9%Mississippi4.8%Vermont4.7%Michigan4.4%West Virginia4.3%New Hampshire4.2%Delaware4.0%Maine3.9%Puerto Rico
Summary

Renter-occupied units where the householder moved in during 2021 or later, as a share of all occupied units. The District of Columbia leads at 12.8%. Renters drive most of the overall recent-mover share in this table.

Figure 4

Owner against renter recent-mover shares

Renter, moved 2021 or later against owner, moved 2021 or later · one point per row, 52 of 52 plotted

52 items
View100%
DownloadPDFImageCSV
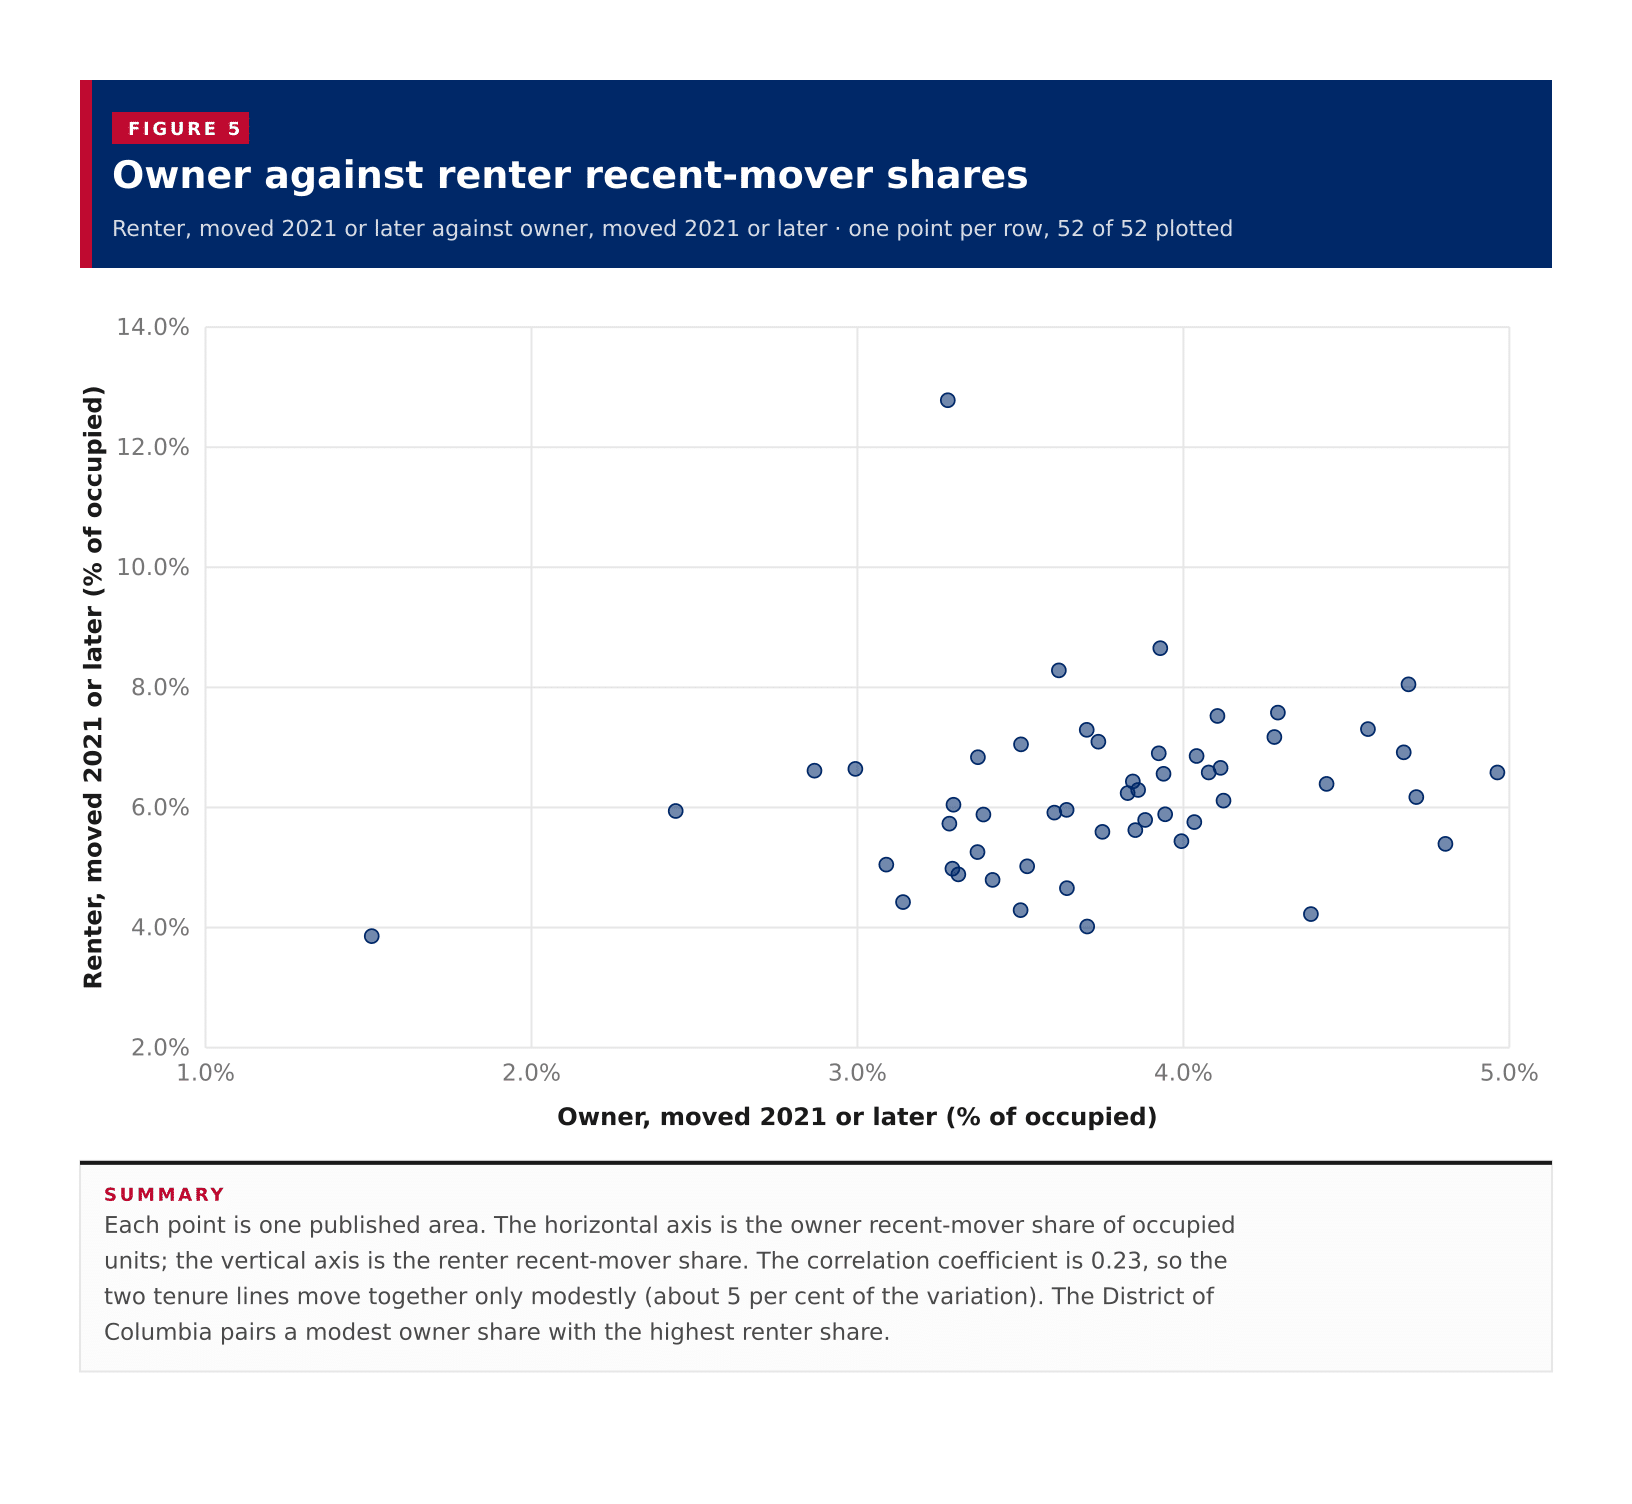
Owner against renter recent-mover sharesEach point is one published area. The horizontal axis is the owner recent-mover share of occupied units; the vertical axis is the renter recent-mover share. The correlation coefficient is 0.23, so the two tenure lines move together only modestly (about 5 per cent of the variation). The District of Columbia pairs a modest owner share with the highest renter share.2.0%4.0%6.0%8.0%10.0%12.0%14.0%1.0%2.0%3.0%4.0%5.0%Renter, moved 2021 or later (% of occupied)Owner, moved 2021 or later (% of occupied)
Summary

Each point is one published area. The horizontal axis is the owner recent-mover share of occupied units; the vertical axis is the renter recent-mover share. The correlation coefficient is 0.23, so the two tenure lines move together only modestly (about 5 per cent of the variation). The District of Columbia pairs a modest owner share with the highest renter share.

Table 1

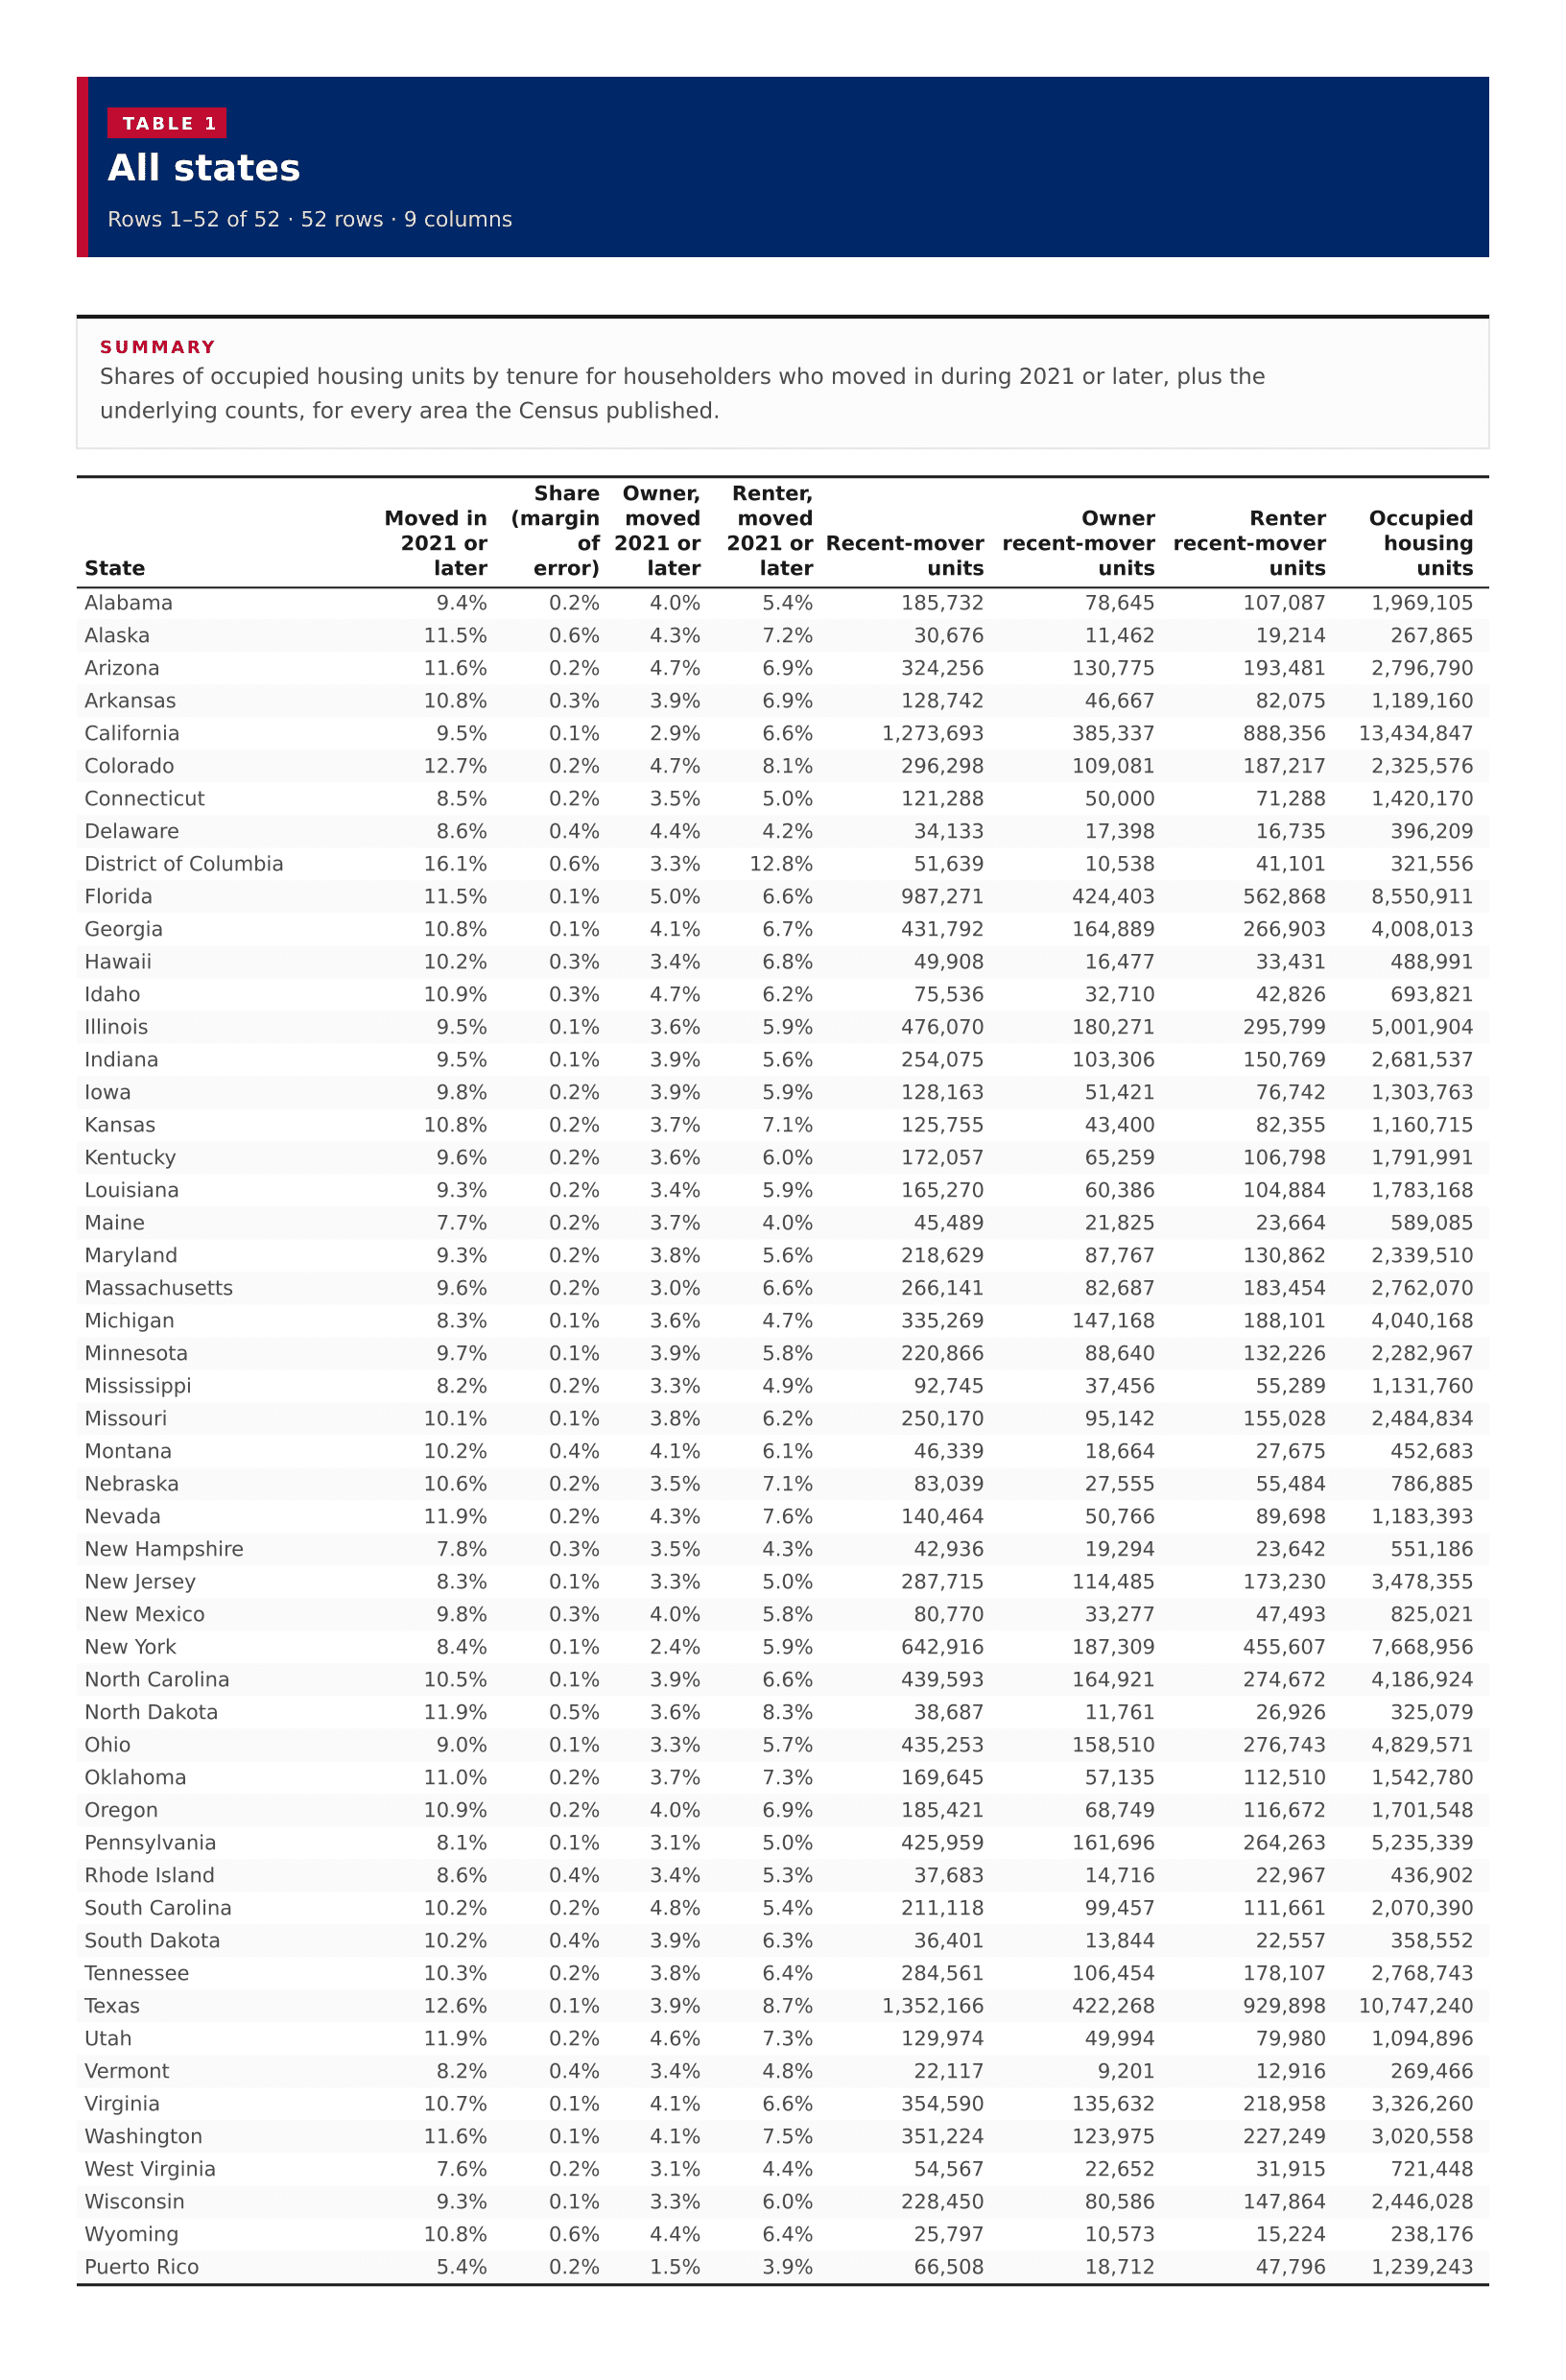
All states

52 rows · 9 columns

52 rows
View100%
DownloadPDFImageCSV
Summary

Shares of occupied housing units by tenure for householders who moved in during 2021 or later, plus the underlying counts, for every area the Census published.

All states
??????
Alabama9.4%0.2%4.0%5.4%185,73278,645107,0871,969,105
Alaska11.5%0.6%4.3%7.2%30,67611,46219,214267,865
Arizona11.6%0.2%4.7%6.9%324,256130,775193,4812,796,790
Arkansas10.8%0.3%3.9%6.9%128,74246,66782,0751,189,160
California9.5%0.1%2.9%6.6%1,273,693385,337888,35613,434,847
Colorado12.7%0.2%4.7%8.1%296,298109,081187,2172,325,576
Connecticut8.5%0.2%3.5%5.0%121,28850,00071,2881,420,170
Delaware8.6%0.4%4.4%4.2%34,13317,39816,735396,209
District of Columbia16.1%0.6%3.3%12.8%51,63910,53841,101321,556
Florida11.5%0.1%5.0%6.6%987,271424,403562,8688,550,911
Georgia10.8%0.1%4.1%6.7%431,792164,889266,9034,008,013
Hawaii10.2%0.3%3.4%6.8%49,90816,47733,431488,991
Idaho10.9%0.3%4.7%6.2%75,53632,71042,826693,821
Illinois9.5%0.1%3.6%5.9%476,070180,271295,7995,001,904
Indiana9.5%0.1%3.9%5.6%254,075103,306150,7692,681,537
Iowa9.8%0.2%3.9%5.9%128,16351,42176,7421,303,763
Kansas10.8%0.2%3.7%7.1%125,75543,40082,3551,160,715
Kentucky9.6%0.2%3.6%6.0%172,05765,259106,7981,791,991
Louisiana9.3%0.2%3.4%5.9%165,27060,386104,8841,783,168
Maine7.7%0.2%3.7%4.0%45,48921,82523,664589,085
Maryland9.3%0.2%3.8%5.6%218,62987,767130,8622,339,510
Massachusetts9.6%0.2%3.0%6.6%266,14182,687183,4542,762,070
Michigan8.3%0.1%3.6%4.7%335,269147,168188,1014,040,168
Minnesota9.7%0.1%3.9%5.8%220,86688,640132,2262,282,967
Mississippi8.2%0.2%3.3%4.9%92,74537,45655,2891,131,760
Missouri10.1%0.1%3.8%6.2%250,17095,142155,0282,484,834
Montana10.2%0.4%4.1%6.1%46,33918,66427,675452,683
Nebraska10.6%0.2%3.5%7.1%83,03927,55555,484786,885
Nevada11.9%0.2%4.3%7.6%140,46450,76689,6981,183,393
New Hampshire7.8%0.3%3.5%4.3%42,93619,29423,642551,186
New Jersey8.3%0.1%3.3%5.0%287,715114,485173,2303,478,355
New Mexico9.8%0.3%4.0%5.8%80,77033,27747,493825,021
New York8.4%0.1%2.4%5.9%642,916187,309455,6077,668,956
North Carolina10.5%0.1%3.9%6.6%439,593164,921274,6724,186,924
North Dakota11.9%0.5%3.6%8.3%38,68711,76126,926325,079
Ohio9.0%0.1%3.3%5.7%435,253158,510276,7434,829,571
Oklahoma11.0%0.2%3.7%7.3%169,64557,135112,5101,542,780
Oregon10.9%0.2%4.0%6.9%185,42168,749116,6721,701,548
Pennsylvania8.1%0.1%3.1%5.0%425,959161,696264,2635,235,339
Rhode Island8.6%0.4%3.4%5.3%37,68314,71622,967436,902
South Carolina10.2%0.2%4.8%5.4%211,11899,457111,6612,070,390
South Dakota10.2%0.4%3.9%6.3%36,40113,84422,557358,552
Tennessee10.3%0.2%3.8%6.4%284,561106,454178,1072,768,743
Texas12.6%0.1%3.9%8.7%1,352,166422,268929,89810,747,240
Utah11.9%0.2%4.6%7.3%129,97449,99479,9801,094,896
Vermont8.2%0.4%3.4%4.8%22,1179,20112,916269,466
Virginia10.7%0.1%4.1%6.6%354,590135,632218,9583,326,260
Washington11.6%0.1%4.1%7.5%351,224123,975227,2493,020,558
West Virginia7.6%0.2%3.1%4.4%54,56722,65231,915721,448
Wisconsin9.3%0.1%3.3%6.0%228,45080,586147,8642,446,028
Wyoming10.8%0.6%4.4%6.4%25,79710,57315,224238,176
Puerto Rico5.4%0.2%1.5%3.9%66,50818,71247,7961,239,243

Image files

Download all

Figure 1

Moved in 2021 or later, US states
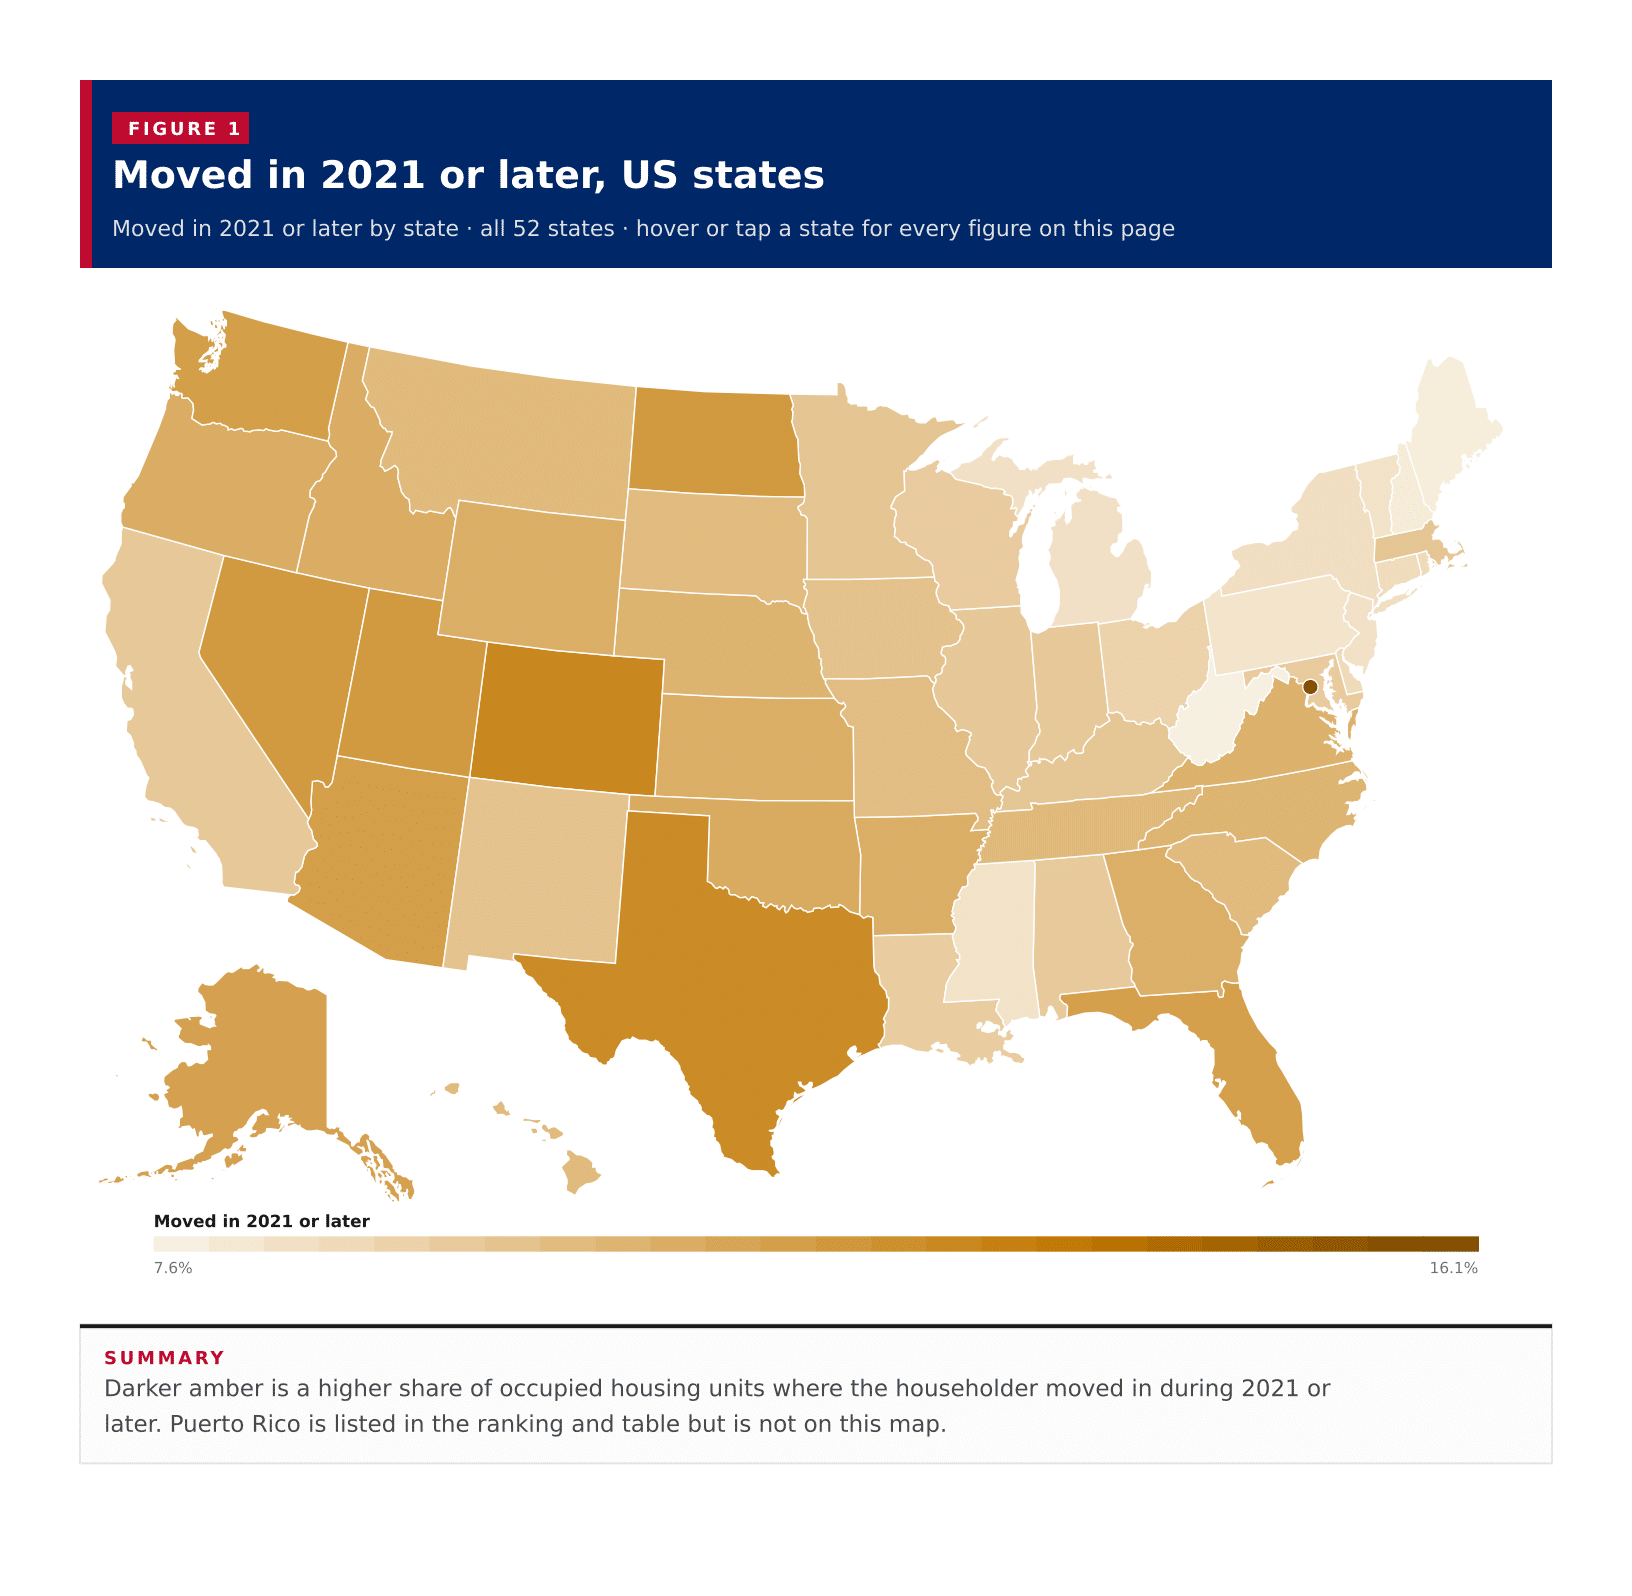
Figure 1: Moved in 2021 or later, US states
DownloadPDFImageCSV

Figure 2

Moved in 2021 or later, all published states

Figure 2: Moved in 2021 or later, all published states
DownloadPDFImageCSV

Figure 3

Owner-occupied, moved in 2021 or later, all published states

Figure 3: Owner-occupied, moved in 2021 or later, all published states
DownloadPDFImageCSV

Figure 4

Renter-occupied, moved in 2021 or later, all published states

Figure 4: Renter-occupied, moved in 2021 or later, all published states
DownloadPDFImageCSV

Figure 5

Owner against renter recent-mover shares

Figure 5: Owner against renter recent-mover shares
DownloadPDFImageCSV

About this data

  • The newest year bracket in ACS table B25038 for the 2023 five-year estimates is "Moved in 2021 or later." Shares are recomputed from the owner and renter component counts for that bracket divided by total occupied housing units.
  • A midpoint of state shares is not a United States mobility rate. Large states weigh more if every occupied unit is pooled, and these figures describe householders' year of move into the current unit, not the geographic mobility of people.
  • Owner and renter recent-mover lines use the same occupied-unit universe, so the two shares add to the overall recent-mover share.
  • The Census published 50 states, the District of Columbia and Puerto Rico. Alaska and Hawaii appear in the ranking and table; on the map they are inset. Puerto Rico is in the ranking and table but is not drawn on the state map.