Owner cost burden by US state

Summary

Owner cost burden, US states

Paying 30% or more by state · all 52 states · hover or tap a state for every figure on this page

52 items
View100%
DownloadPDFImageCSV
StatesCalifornia
Owner cost burden, US statesDarker amber is a higher share of owners paying 30% or more of household income on selected monthly owner costs. Puerto Rico is listed in the ranking and table but is not on this map.Alabama · Paying 30% or more: 17.5% · Paying 50% or more: 7.6% · With a mortgage, 30% or more: 23.2% · Without a mortgage, 30% or more: 10.5% · Median owner costs as % of income: 14.8% · Margin of error: 0.1% · Owners with ratio computed: 1,361,639 · Owner households: 1,377,062 · With mortgage, ratio computed: 747,997 · Without mortgage, ratio computed: 613,642Alaska · Paying 30% or more: 22.4% · Paying 50% or more: 8.8% · With a mortgage, 30% or more: 29.3% · Without a mortgage, 30% or more: 11.9% · Median owner costs as % of income: 17.5% · Margin of error: 0.3% · Owners with ratio computed: 177,314 · Owner households: 178,369 · With mortgage, ratio computed: 107,310 · Without mortgage, ratio computed: 70,004Arizona · Paying 30% or more: 21.0% · Paying 50% or more: 9.0% · With a mortgage, 30% or more: 26.5% · Without a mortgage, 30% or more: 11.9% · Median owner costs as % of income: 16.7% · Margin of error: 0.1% · Owners with ratio computed: 1,851,794 · Owner households: 1,873,231 · With mortgage, ratio computed: 1,159,980 · Without mortgage, ratio computed: 691,814Arkansas · Paying 30% or more: 16.6% · Paying 50% or more: 6.9% · With a mortgage, 30% or more: 22.1% · Without a mortgage, 30% or more: 10.4% · Median owner costs as % of income: 14.6% · Margin of error: 0.2% · Owners with ratio computed: 778,715 · Owner households: 786,534 · With mortgage, ratio computed: 417,273 · Without mortgage, ratio computed: 361,442California · Paying 30% or more: 30.9% · Paying 50% or more: 13.8% · With a mortgage, 30% or more: 37.7% · Without a mortgage, 30% or more: 16.4% · Median owner costs as % of income: 20.9% · Margin of error: 0.1% · Owners with ratio computed: 7,430,930 · Owner households: 7,494,811 · With mortgage, ratio computed: 5,067,615 · Without mortgage, ratio computed: 2,363,315Colorado · Paying 30% or more: 24.2% · Paying 50% or more: 9.6% · With a mortgage, 30% or more: 29.2% · Without a mortgage, 30% or more: 12.3% · Median owner costs as % of income: 18.6% · Margin of error: 0.1% · Owners with ratio computed: 1,531,896 · Owner households: 1,542,215 · With mortgage, ratio computed: 1,073,289 · Without mortgage, ratio computed: 458,607Connecticut · Paying 30% or more: 26.5% · Paying 50% or more: 11.3% · With a mortgage, 30% or more: 29.7% · Without a mortgage, 30% or more: 20.5% · Median owner costs as % of income: 19.6% · Margin of error: 0.2% · Owners with ratio computed: 933,782 · Owner households: 939,912 · With mortgage, ratio computed: 611,652 · Without mortgage, ratio computed: 322,130Delaware · Paying 30% or more: 20.5% · Paying 50% or more: 8.5% · With a mortgage, 30% or more: 25.2% · Without a mortgage, 30% or more: 11.8% · Median owner costs as % of income: 16.7% · Margin of error: 0.3% · Owners with ratio computed: 284,456 · Owner households: 286,340 · With mortgage, ratio computed: 183,698 · Without mortgage, ratio computed: 100,758Florida · Paying 30% or more: 26.5% · Paying 50% or more: 11.9% · With a mortgage, 30% or more: 34.0% · Without a mortgage, 30% or more: 16.5% · Median owner costs as % of income: 18.6% · Margin of error: 0.1% · Owners with ratio computed: 5,690,601 · Owner households: 5,756,809 · With mortgage, ratio computed: 3,236,402 · Without mortgage, ratio computed: 2,454,199Georgia · Paying 30% or more: 20.3% · Paying 50% or more: 8.6% · With a mortgage, 30% or more: 25.5% · Without a mortgage, 30% or more: 11.1% · Median owner costs as % of income: 16.6% · Margin of error: 0.1% · Owners with ratio computed: 2,592,363 · Owner households: 2,619,529 · With mortgage, ratio computed: 1,663,345 · Without mortgage, ratio computed: 929,018Hawaii · Paying 30% or more: 30.8% · Paying 50% or more: 13.7% · With a mortgage, 30% or more: 40.7% · Without a mortgage, 30% or more: 13.2% · Median owner costs as % of income: 20.0% · Margin of error: 0.3% · Owners with ratio computed: 302,636 · Owner households: 305,869 · With mortgage, ratio computed: 193,385 · Without mortgage, ratio computed: 109,251Idaho · Paying 30% or more: 20.4% · Paying 50% or more: 8.0% · With a mortgage, 30% or more: 26.7% · Without a mortgage, 30% or more: 9.6% · Median owner costs as % of income: 16.7% · Margin of error: 0.2% · Owners with ratio computed: 498,538 · Owner households: 502,140 · With mortgage, ratio computed: 315,175 · Without mortgage, ratio computed: 183,363Illinois · Paying 30% or more: 22.1% · Paying 50% or more: 9.3% · With a mortgage, 30% or more: 26.3% · Without a mortgage, 30% or more: 15.4% · Median owner costs as % of income: 17.8% · Margin of error: 0.1% · Owners with ratio computed: 3,315,900 · Owner households: 3,343,034 · With mortgage, ratio computed: 2,046,175 · Without mortgage, ratio computed: 1,269,725Indiana · Paying 30% or more: 16.2% · Paying 50% or more: 6.4% · With a mortgage, 30% or more: 19.5% · Without a mortgage, 30% or more: 10.4% · Median owner costs as % of income: 15.3% · Margin of error: 0.1% · Owners with ratio computed: 1,873,818 · Owner households: 1,886,485 · With mortgage, ratio computed: 1,206,553 · Without mortgage, ratio computed: 667,265Iowa · Paying 30% or more: 16.8% · Paying 50% or more: 6.2% · With a mortgage, 30% or more: 19.9% · Without a mortgage, 30% or more: 12.1% · Median owner costs as % of income: 16.0% · Margin of error: 0.2% · Owners with ratio computed: 927,280 · Owner households: 932,618 · With mortgage, ratio computed: 555,141 · Without mortgage, ratio computed: 372,139Kansas · Paying 30% or more: 17.1% · Paying 50% or more: 6.4% · With a mortgage, 30% or more: 21.4% · Without a mortgage, 30% or more: 11.3% · Median owner costs as % of income: 16.3% · Margin of error: 0.1% · Owners with ratio computed: 770,761 · Owner households: 776,311 · With mortgage, ratio computed: 446,295 · Without mortgage, ratio computed: 324,466Kentucky · Paying 30% or more: 17.7% · Paying 50% or more: 7.3% · With a mortgage, 30% or more: 22.1% · Without a mortgage, 30% or more: 11.8% · Median owner costs as % of income: 15.5% · Margin of error: 0.1% · Owners with ratio computed: 1,211,286 · Owner households: 1,223,574 · With mortgage, ratio computed: 691,362 · Without mortgage, ratio computed: 519,924Louisiana · Paying 30% or more: 19.4% · Paying 50% or more: 8.6% · With a mortgage, 30% or more: 26.5% · Without a mortgage, 30% or more: 11.6% · Median owner costs as % of income: 15.2% · Margin of error: 0.2% · Owners with ratio computed: 1,185,962 · Owner households: 1,200,407 · With mortgage, ratio computed: 623,823 · Without mortgage, ratio computed: 562,139Maine · Paying 30% or more: 22.0% · Paying 50% or more: 9.0% · With a mortgage, 30% or more: 26.7% · Without a mortgage, 30% or more: 15.2% · Median owner costs as % of income: 17.6% · Margin of error: 0.2% · Owners with ratio computed: 433,020 · Owner households: 436,029 · With mortgage, ratio computed: 255,334 · Without mortgage, ratio computed: 177,686Maryland · Paying 30% or more: 22.6% · Paying 50% or more: 9.3% · With a mortgage, 30% or more: 26.2% · Without a mortgage, 30% or more: 13.4% · Median owner costs as % of income: 18.1% · Margin of error: 0.2% · Owners with ratio computed: 1,567,513 · Owner households: 1,578,702 · With mortgage, ratio computed: 1,123,805 · Without mortgage, ratio computed: 443,708Massachusetts · Paying 30% or more: 26.3% · Paying 50% or more: 11.1% · With a mortgage, 30% or more: 29.9% · Without a mortgage, 30% or more: 18.9% · Median owner costs as % of income: 19.4% · Margin of error: 0.2% · Owners with ratio computed: 1,719,430 · Owner households: 1,728,986 · With mortgage, ratio computed: 1,155,780 · Without mortgage, ratio computed: 563,650Michigan · Paying 30% or more: 19.2% · Paying 50% or more: 8.0% · With a mortgage, 30% or more: 22.9% · Without a mortgage, 30% or more: 13.9% · Median owner costs as % of income: 16.4% · Margin of error: 0.1% · Owners with ratio computed: 2,921,953 · Owner households: 2,946,157 · With mortgage, ratio computed: 1,716,339 · Without mortgage, ratio computed: 1,205,614Minnesota · Paying 30% or more: 18.8% · Paying 50% or more: 7.1% · With a mortgage, 30% or more: 22.5% · Without a mortgage, 30% or more: 12.0% · Median owner costs as % of income: 17.0% · Margin of error: 0.1% · Owners with ratio computed: 1,644,234 · Owner households: 1,652,534 · With mortgage, ratio computed: 1,066,661 · Without mortgage, ratio computed: 577,573Mississippi · Paying 30% or more: 19.3% · Paying 50% or more: 8.4% · With a mortgage, 30% or more: 26.4% · Without a mortgage, 30% or more: 12.1% · Median owner costs as % of income: 15.2% · Margin of error: 0.2% · Owners with ratio computed: 774,899 · Owner households: 786,289 · With mortgage, ratio computed: 388,602 · Without mortgage, ratio computed: 386,297Missouri · Paying 30% or more: 17.5% · Paying 50% or more: 7.0% · With a mortgage, 30% or more: 21.3% · Without a mortgage, 30% or more: 11.6% · Median owner costs as % of income: 16.0% · Margin of error: 0.1% · Owners with ratio computed: 1,676,245 · Owner households: 1,688,072 · With mortgage, ratio computed: 1,018,775 · Without mortgage, ratio computed: 657,470Montana · Paying 30% or more: 22.0% · Paying 50% or more: 8.9% · With a mortgage, 30% or more: 29.3% · Without a mortgage, 30% or more: 13.1% · Median owner costs as % of income: 17.3% · Margin of error: 0.2% · Owners with ratio computed: 311,813 · Owner households: 314,266 · With mortgage, ratio computed: 172,040 · Without mortgage, ratio computed: 139,773Nebraska · Paying 30% or more: 17.7% · Paying 50% or more: 6.8% · With a mortgage, 30% or more: 21.4% · Without a mortgage, 30% or more: 12.4% · Median owner costs as % of income: 16.6% · Margin of error: 0.2% · Owners with ratio computed: 520,106 · Owner households: 523,603 · With mortgage, ratio computed: 307,620 · Without mortgage, ratio computed: 212,486Nevada · Paying 30% or more: 24.2% · Paying 50% or more: 10.6% · With a mortgage, 30% or more: 30.6% · Without a mortgage, 30% or more: 11.4% · Median owner costs as % of income: 18.1% · Margin of error: 0.2% · Owners with ratio computed: 693,943 · Owner households: 701,914 · With mortgage, ratio computed: 462,367 · Without mortgage, ratio computed: 231,576New Hampshire · Paying 30% or more: 24.8% · Paying 50% or more: 9.0% · With a mortgage, 30% or more: 27.9% · Without a mortgage, 30% or more: 19.4% · Median owner costs as % of income: 19.5% · Margin of error: 0.2% · Owners with ratio computed: 397,622 · Owner households: 399,663 · With mortgage, ratio computed: 251,983 · Without mortgage, ratio computed: 145,639New Jersey · Paying 30% or more: 28.7% · Paying 50% or more: 12.2% · With a mortgage, 30% or more: 32.4% · Without a mortgage, 30% or more: 21.9% · Median owner costs as % of income: 20.6% · Margin of error: 0.2% · Owners with ratio computed: 2,201,527 · Owner households: 2,215,482 · With mortgage, ratio computed: 1,419,981 · Without mortgage, ratio computed: 781,546New Mexico · Paying 30% or more: 20.6% · Paying 50% or more: 9.3% · With a mortgage, 30% or more: 28.2% · Without a mortgage, 30% or more: 12.0% · Median owner costs as % of income: 15.7% · Margin of error: 0.2% · Owners with ratio computed: 564,224 · Owner households: 572,064 · With mortgage, ratio computed: 297,149 · Without mortgage, ratio computed: 267,075New York · Paying 30% or more: 27.2% · Paying 50% or more: 12.6% · With a mortgage, 30% or more: 32.7% · Without a mortgage, 30% or more: 19.3% · Median owner costs as % of income: 18.8% · Margin of error: 0.2% · Owners with ratio computed: 4,131,658 · Owner households: 4,164,793 · With mortgage, ratio computed: 2,424,787 · Without mortgage, ratio computed: 1,706,871North Carolina · Paying 30% or more: 19.0% · Paying 50% or more: 7.9% · With a mortgage, 30% or more: 23.7% · Without a mortgage, 30% or more: 11.2% · Median owner costs as % of income: 16.0% · Margin of error: 0.1% · Owners with ratio computed: 2,754,698 · Owner households: 2,778,672 · With mortgage, ratio computed: 1,712,999 · Without mortgage, ratio computed: 1,041,699North Dakota · Paying 30% or more: 15.6% · Paying 50% or more: 5.5% · With a mortgage, 30% or more: 20.4% · Without a mortgage, 30% or more: 10.3% · Median owner costs as % of income: 14.8% · Margin of error: 0.2% · Owners with ratio computed: 204,862 · Owner households: 206,123 · With mortgage, ratio computed: 107,795 · Without mortgage, ratio computed: 97,067Ohio · Paying 30% or more: 17.3% · Paying 50% or more: 6.9% · With a mortgage, 30% or more: 20.5% · Without a mortgage, 30% or more: 12.2% · Median owner costs as % of income: 16.0% · Margin of error: 0.2% · Owners with ratio computed: 3,212,689 · Owner households: 3,235,568 · With mortgage, ratio computed: 1,975,269 · Without mortgage, ratio computed: 1,237,420Oklahoma · Paying 30% or more: 17.4% · Paying 50% or more: 7.0% · With a mortgage, 30% or more: 23.2% · Without a mortgage, 30% or more: 10.6% · Median owner costs as % of income: 15.5% · Margin of error: 0.1% · Owners with ratio computed: 1,004,453 · Owner households: 1,015,207 · With mortgage, ratio computed: 545,097 · Without mortgage, ratio computed: 459,356Oregon · Paying 30% or more: 25.0% · Paying 50% or more: 9.9% · With a mortgage, 30% or more: 30.3% · Without a mortgage, 30% or more: 15.0% · Median owner costs as % of income: 19.0% · Margin of error: 0.2% · Owners with ratio computed: 1,070,737 · Owner households: 1,078,343 · With mortgage, ratio computed: 701,865 · Without mortgage, ratio computed: 368,872Pennsylvania · Paying 30% or more: 19.7% · Paying 50% or more: 8.0% · With a mortgage, 30% or more: 23.6% · Without a mortgage, 30% or more: 14.2% · Median owner costs as % of income: 16.7% · Margin of error: 0.1% · Owners with ratio computed: 3,603,727 · Owner households: 3,629,624 · With mortgage, ratio computed: 2,118,371 · Without mortgage, ratio computed: 1,485,356Rhode Island · Paying 30% or more: 25.7% · Paying 50% or more: 10.6% · With a mortgage, 30% or more: 29.7% · Without a mortgage, 30% or more: 17.5% · Median owner costs as % of income: 19.4% · Margin of error: 0.2% · Owners with ratio computed: 275,130 · Owner households: 276,344 · With mortgage, ratio computed: 184,096 · Without mortgage, ratio computed: 91,034South Carolina · Paying 30% or more: 19.0% · Paying 50% or more: 8.2% · With a mortgage, 30% or more: 24.9% · Without a mortgage, 30% or more: 10.9% · Median owner costs as % of income: 15.4% · Margin of error: 0.2% · Owners with ratio computed: 1,462,687 · Owner households: 1,478,858 · With mortgage, ratio computed: 845,431 · Without mortgage, ratio computed: 617,256South Dakota · Paying 30% or more: 17.5% · Paying 50% or more: 6.5% · With a mortgage, 30% or more: 22.7% · Without a mortgage, 30% or more: 11.2% · Median owner costs as % of income: 16.3% · Margin of error: 0.2% · Owners with ratio computed: 244,530 · Owner households: 246,105 · With mortgage, ratio computed: 134,225 · Without mortgage, ratio computed: 110,305Tennessee · Paying 30% or more: 18.2% · Paying 50% or more: 7.5% · With a mortgage, 30% or more: 24.1% · Without a mortgage, 30% or more: 10.0% · Median owner costs as % of income: 15.7% · Margin of error: 0.1% · Owners with ratio computed: 1,838,294 · Owner households: 1,855,793 · With mortgage, ratio computed: 1,076,750 · Without mortgage, ratio computed: 761,544Texas · Paying 30% or more: 21.9% · Paying 50% or more: 9.0% · With a mortgage, 30% or more: 28.1% · Without a mortgage, 30% or more: 13.8% · Median owner costs as % of income: 17.5% · Margin of error: 0.3% · Owners with ratio computed: 6,664,244 · Owner households: 6,723,729 · With mortgage, ratio computed: 3,763,753 · Without mortgage, ratio computed: 2,900,491Utah · Paying 30% or more: 19.8% · Paying 50% or more: 7.2% · With a mortgage, 30% or more: 24.7% · Without a mortgage, 30% or more: 8.8% · Median owner costs as % of income: 17.2% · Margin of error: 0.2% · Owners with ratio computed: 769,480 · Owner households: 773,345 · With mortgage, ratio computed: 534,105 · Without mortgage, ratio computed: 235,375Vermont · Paying 30% or more: 24.6% · Paying 50% or more: 10.0% · With a mortgage, 30% or more: 28.2% · Without a mortgage, 30% or more: 19.0% · Median owner costs as % of income: 19.3% · Margin of error: 0.2% · Owners with ratio computed: 195,174 · Owner households: 196,162 · With mortgage, ratio computed: 118,653 · Without mortgage, ratio computed: 76,521Virginia · Paying 30% or more: 20.2% · Paying 50% or more: 8.0% · With a mortgage, 30% or more: 24.7% · Without a mortgage, 30% or more: 10.6% · Median owner costs as % of income: 17.2% · Margin of error: 0.1% · Owners with ratio computed: 2,220,435 · Owner households: 2,234,492 · With mortgage, ratio computed: 1,497,527 · Without mortgage, ratio computed: 722,908Washington · Paying 30% or more: 24.0% · Paying 50% or more: 9.3% · With a mortgage, 30% or more: 29.2% · Without a mortgage, 30% or more: 13.4% · Median owner costs as % of income: 18.9% · Margin of error: 0.1% · Owners with ratio computed: 1,917,816 · Owner households: 1,929,694 · With mortgage, ratio computed: 1,283,584 · Without mortgage, ratio computed: 634,232West Virginia · Paying 30% or more: 14.3% · Paying 50% or more: 6.1% · With a mortgage, 30% or more: 19.7% · Without a mortgage, 30% or more: 9.6% · Median owner costs as % of income: 13.3% · Margin of error: 0.1% · Owners with ratio computed: 530,439 · Owner households: 536,082 · With mortgage, ratio computed: 247,520 · Without mortgage, ratio computed: 282,919Wisconsin · Paying 30% or more: 18.4% · Paying 50% or more: 7.0% · With a mortgage, 30% or more: 22.1% · Without a mortgage, 30% or more: 12.3% · Median owner costs as % of income: 16.9% · Margin of error: 0.1% · Owners with ratio computed: 1,649,884 · Owner households: 1,660,505 · With mortgage, ratio computed: 1,022,974 · Without mortgage, ratio computed: 626,910Wyoming · Paying 30% or more: 19.6% · Paying 50% or more: 7.7% · With a mortgage, 30% or more: 25.1% · Without a mortgage, 30% or more: 12.2% · Median owner costs as % of income: 16.5% · Margin of error: 0.3% · Owners with ratio computed: 169,908 · Owner households: 171,299 · With mortgage, ratio computed: 97,182 · Without mortgage, ratio computed: 72,726District of Columbia · Paying 30% or more: 21.8% · Paying 50% or more: 8.8% · With a mortgage, 30% or more: 25.4% · Without a mortgage, 30% or more: 10.2% · Median owner costs as % of income: 18.1% · Margin of error: 0.3% · Owners with ratio computed: 131,064 · Owner households: 132,288 · With mortgage, ratio computed: 100,247 · Without mortgage, ratio computed: 30,817District of Columbia · Paying 30% or more: 21.8% · Paying 50% or more: 8.8% · With a mortgage, 30% or more: 25.4% · Without a mortgage, 30% or more: 10.2% · Median owner costs as % of income: 18.1% · Margin of error: 0.3% · Owners with ratio computed: 131,064 · Owner households: 132,288 · With mortgage, ratio computed: 100,247 · Without mortgage, ratio computed: 30,817Paying 30% or more14.3%30.9%
Summary

Darker amber is a higher share of owners paying 30% or more of household income on selected monthly owner costs. Puerto Rico is listed in the ranking and table but is not on this map.

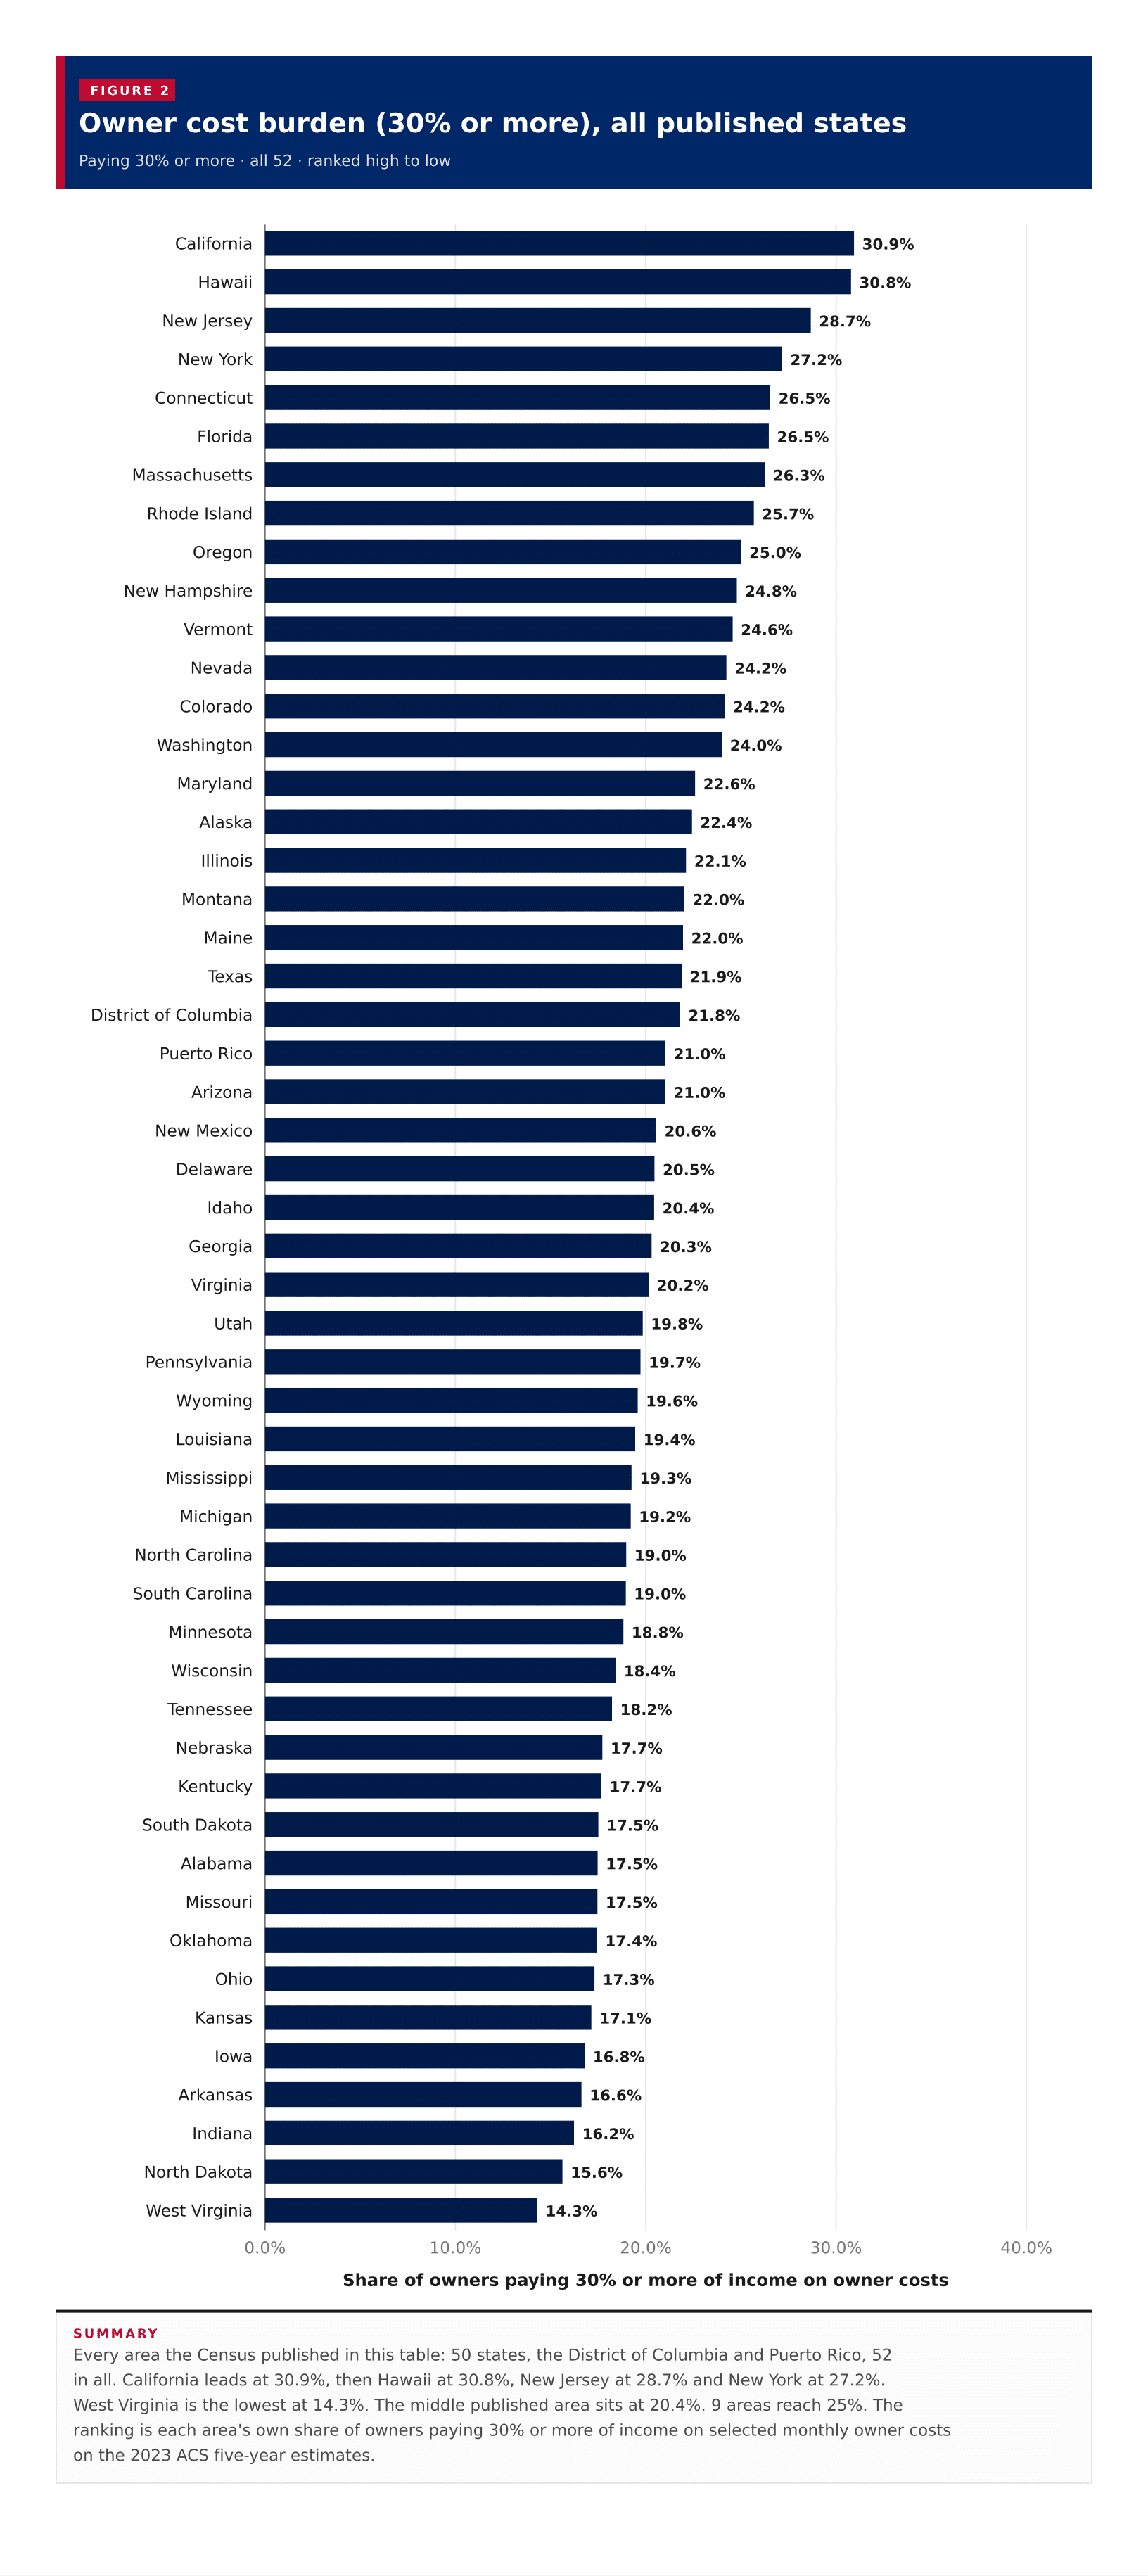
A typical published area has 20.4% of owner-occupied households paying 30% or more of household income on selected monthly owner costs, the midpoint of the 50 states, the District of Columbia and Puerto Rico on the 2023 ACS five-year estimates. California leads at 30.9%, then Hawaii at 30.8%, New Jersey at 28.7% and New York at 27.2%. West Virginia is the lowest at 14.3%. The main ranking covers owners with a mortgage and owners without one, among households with a computable cost-to-income ratio in each area, not a national average of states.

In short

20.4%typical published areathe middle area, not an average
30.9%Californiahighest share paying 30% or more
14.3%West Virginialowest of the published areas
9areas at or above 25%California, Hawaii, New Jersey, New York, Connecticut, Florida, Massachusetts, Rhode Island, Oregon
16.7%typical median owner-cost sharemidpoint of state medians from B25092
Figure 1

Owner cost burden (30% or more), all published states

Paying 30% or more · all 52 · ranked high to low

52 items
View100%
DownloadPDFImageCSV
Owner cost burden (30% or more), all published statesEvery area the Census published in this table: 50 states, the District of Columbia and Puerto Rico, 52 in all. California leads at 30.9%, then Hawaii at 30.8%, New Jersey at 28.7% and New York at 27.2%. West Virginia is the lowest at 14.3%. The middle published area sits at 20.4%. 9 areas reach 25%. The ranking is each area's own share of owners paying 30% or more of income on selected monthly owner costs on the 2023 ACS five-year estimates.0.0%10.0%20.0%30.0%40.0%Share of owners paying 30% or more of income on owner costs30.9%California30.8%Hawaii28.7%New Jersey27.2%New York26.5%Connecticut26.5%Florida26.3%Massachusetts25.7%Rhode Island25.0%Oregon24.8%New Hampshire24.6%Vermont24.2%Nevada24.2%Colorado24.0%Washington22.6%Maryland22.4%Alaska22.1%Illinois22.0%Montana22.0%Maine21.9%Texas21.8%District of Columbia21.0%Puerto Rico21.0%Arizona20.6%New Mexico20.5%Delaware20.4%Idaho20.3%Georgia20.2%Virginia19.8%Utah19.7%Pennsylvania19.6%Wyoming19.4%Louisiana19.3%Mississippi19.2%Michigan19.0%North Carolina19.0%South Carolina18.8%Minnesota18.4%Wisconsin18.2%Tennessee17.7%Nebraska17.7%Kentucky17.5%South Dakota17.5%Alabama17.5%Missouri17.4%Oklahoma17.3%Ohio17.1%Kansas16.8%Iowa16.6%Arkansas16.2%Indiana15.6%North Dakota14.3%West Virginia
Summary

Every area the Census published in this table: 50 states, the District of Columbia and Puerto Rico, 52 in all. California leads at 30.9%, then Hawaii at 30.8%, New Jersey at 28.7% and New York at 27.2%. West Virginia is the lowest at 14.3%. The middle published area sits at 20.4%. 9 areas reach 25%. The ranking is each area's own share of owners paying 30% or more of income on selected monthly owner costs on the 2023 ACS five-year estimates.

Figure 2

Owner cost burden with a mortgage (30% or more), all published states

With a mortgage, 30% or more · all 52 · ranked high to low

52 items
View100%
DownloadPDFImageCSV
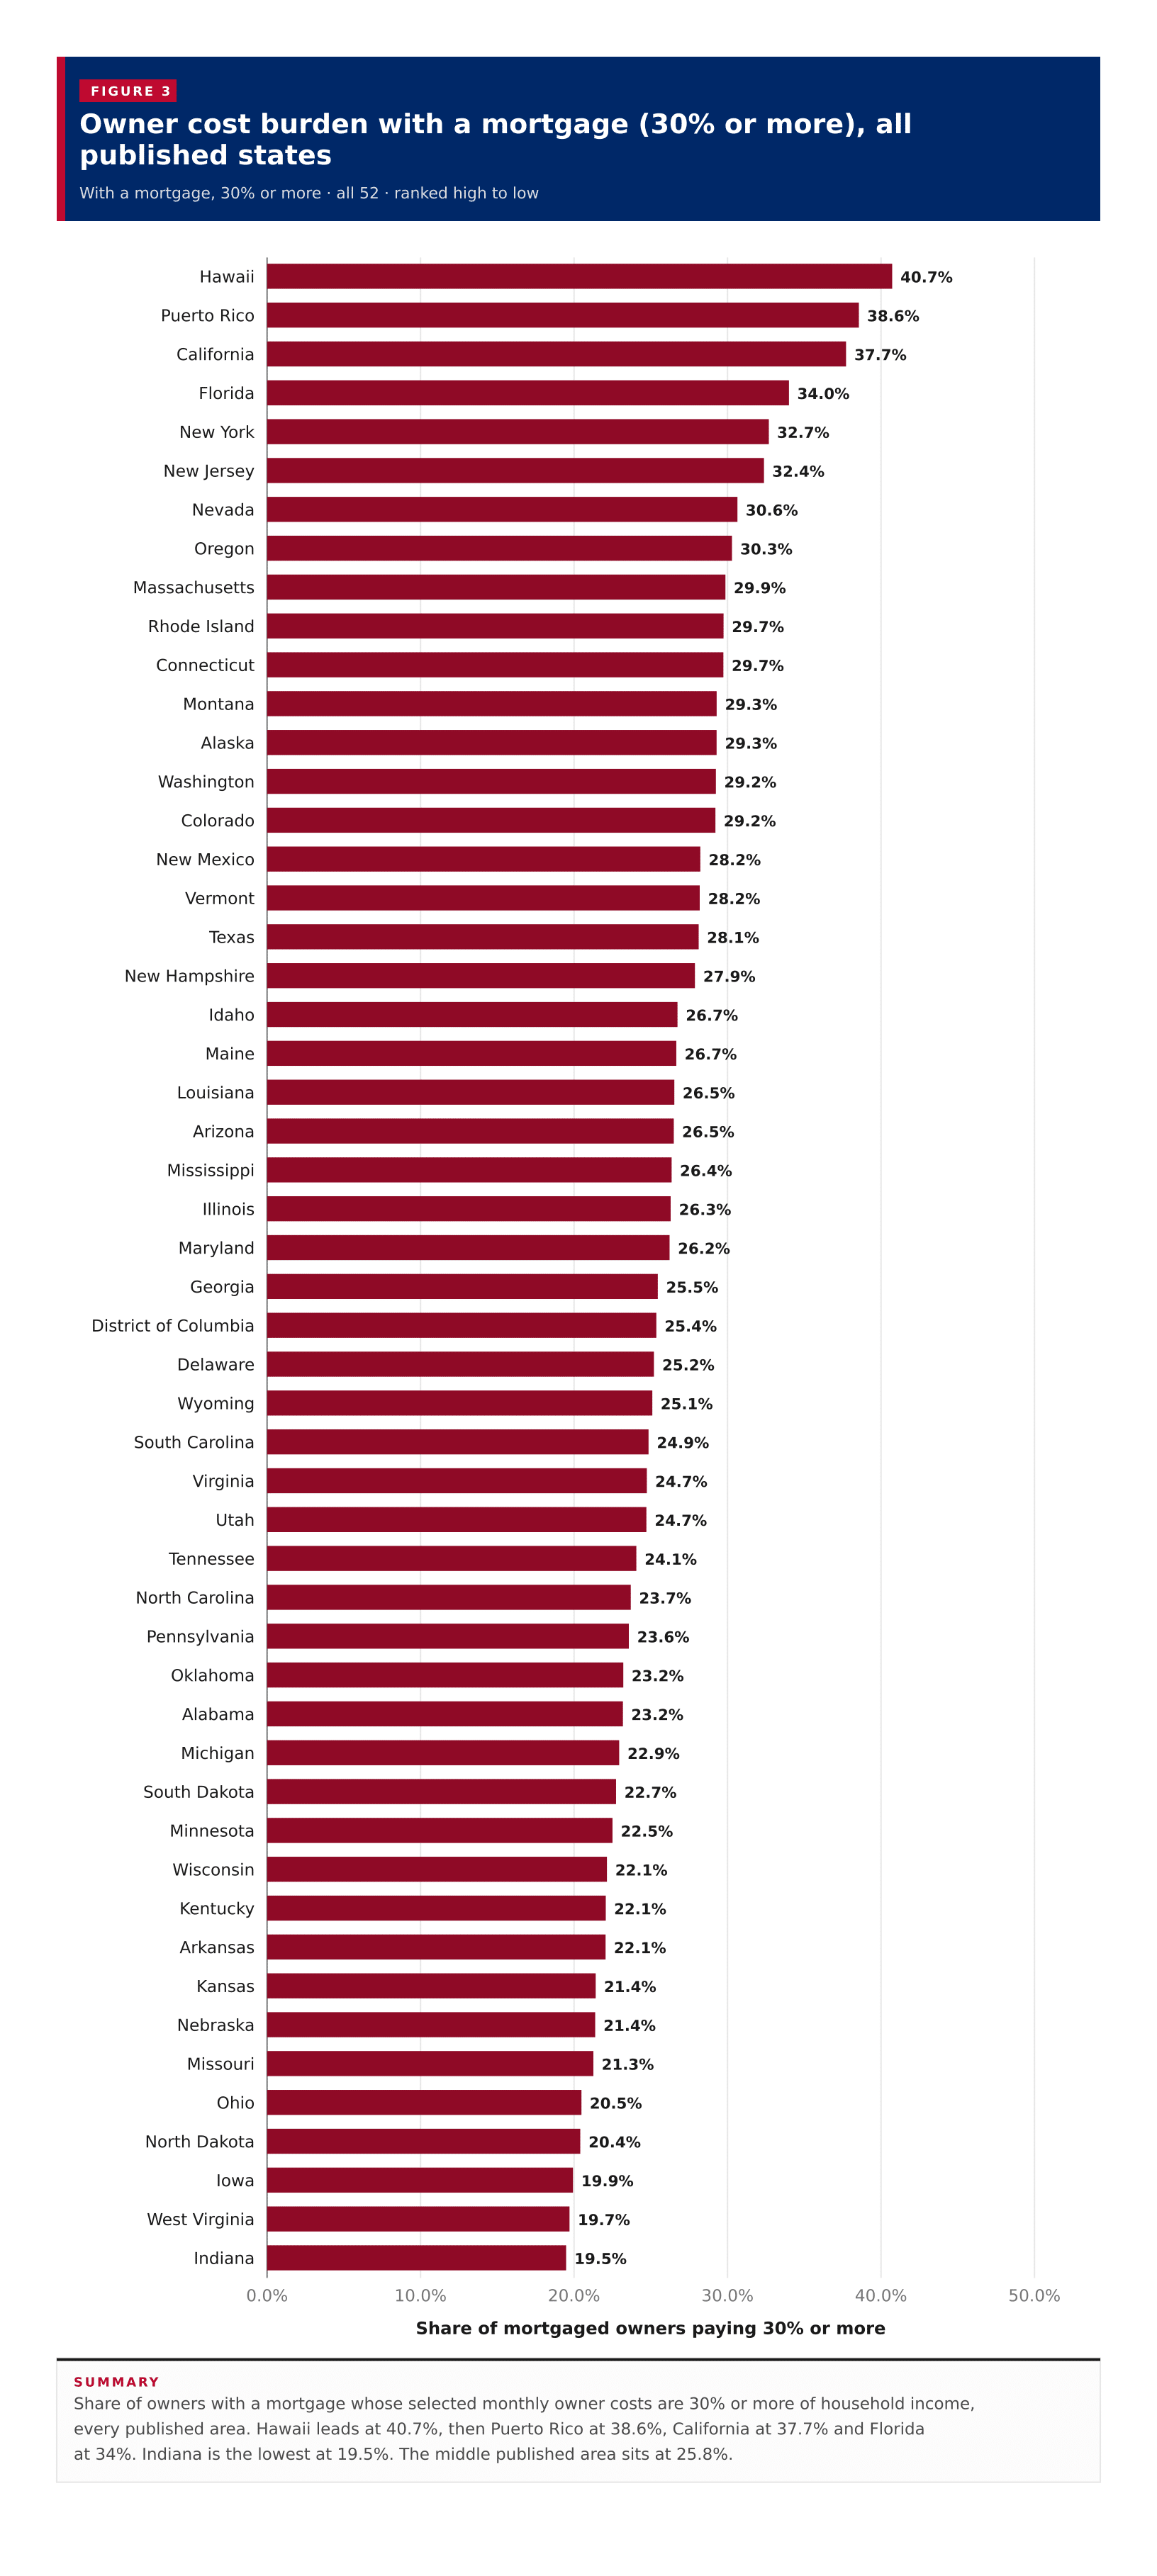
Owner cost burden with a mortgage (30% or more), all published statesShare of owners with a mortgage whose selected monthly owner costs are 30% or more of household income, every published area. Hawaii leads at 40.7%, then Puerto Rico at 38.6%, California at 37.7% and Florida at 34%. Indiana is the lowest at 19.5%. The middle published area sits at 25.8%.0.0%10.0%20.0%30.0%40.0%50.0%Share of mortgaged owners paying 30% or more40.7%Hawaii38.6%Puerto Rico37.7%California34.0%Florida32.7%New York32.4%New Jersey30.6%Nevada30.3%Oregon29.9%Massachusetts29.7%Rhode Island29.7%Connecticut29.3%Montana29.3%Alaska29.2%Washington29.2%Colorado28.2%New Mexico28.2%Vermont28.1%Texas27.9%New Hampshire26.7%Idaho26.7%Maine26.5%Louisiana26.5%Arizona26.4%Mississippi26.3%Illinois26.2%Maryland25.5%Georgia25.4%District of Columbia25.2%Delaware25.1%Wyoming24.9%South Carolina24.7%Virginia24.7%Utah24.1%Tennessee23.7%North Carolina23.6%Pennsylvania23.2%Oklahoma23.2%Alabama22.9%Michigan22.7%South Dakota22.5%Minnesota22.1%Wisconsin22.1%Kentucky22.1%Arkansas21.4%Kansas21.4%Nebraska21.3%Missouri20.5%Ohio20.4%North Dakota19.9%Iowa19.7%West Virginia19.5%Indiana
Summary

Share of owners with a mortgage whose selected monthly owner costs are 30% or more of household income, every published area. Hawaii leads at 40.7%, then Puerto Rico at 38.6%, California at 37.7% and Florida at 34%. Indiana is the lowest at 19.5%. The middle published area sits at 25.8%.

Figure 3

Owner cost burden without a mortgage (30% or more), all published states

Without a mortgage, 30% or more · all 52 · ranked high to low

52 items
View100%
DownloadPDFImageCSV
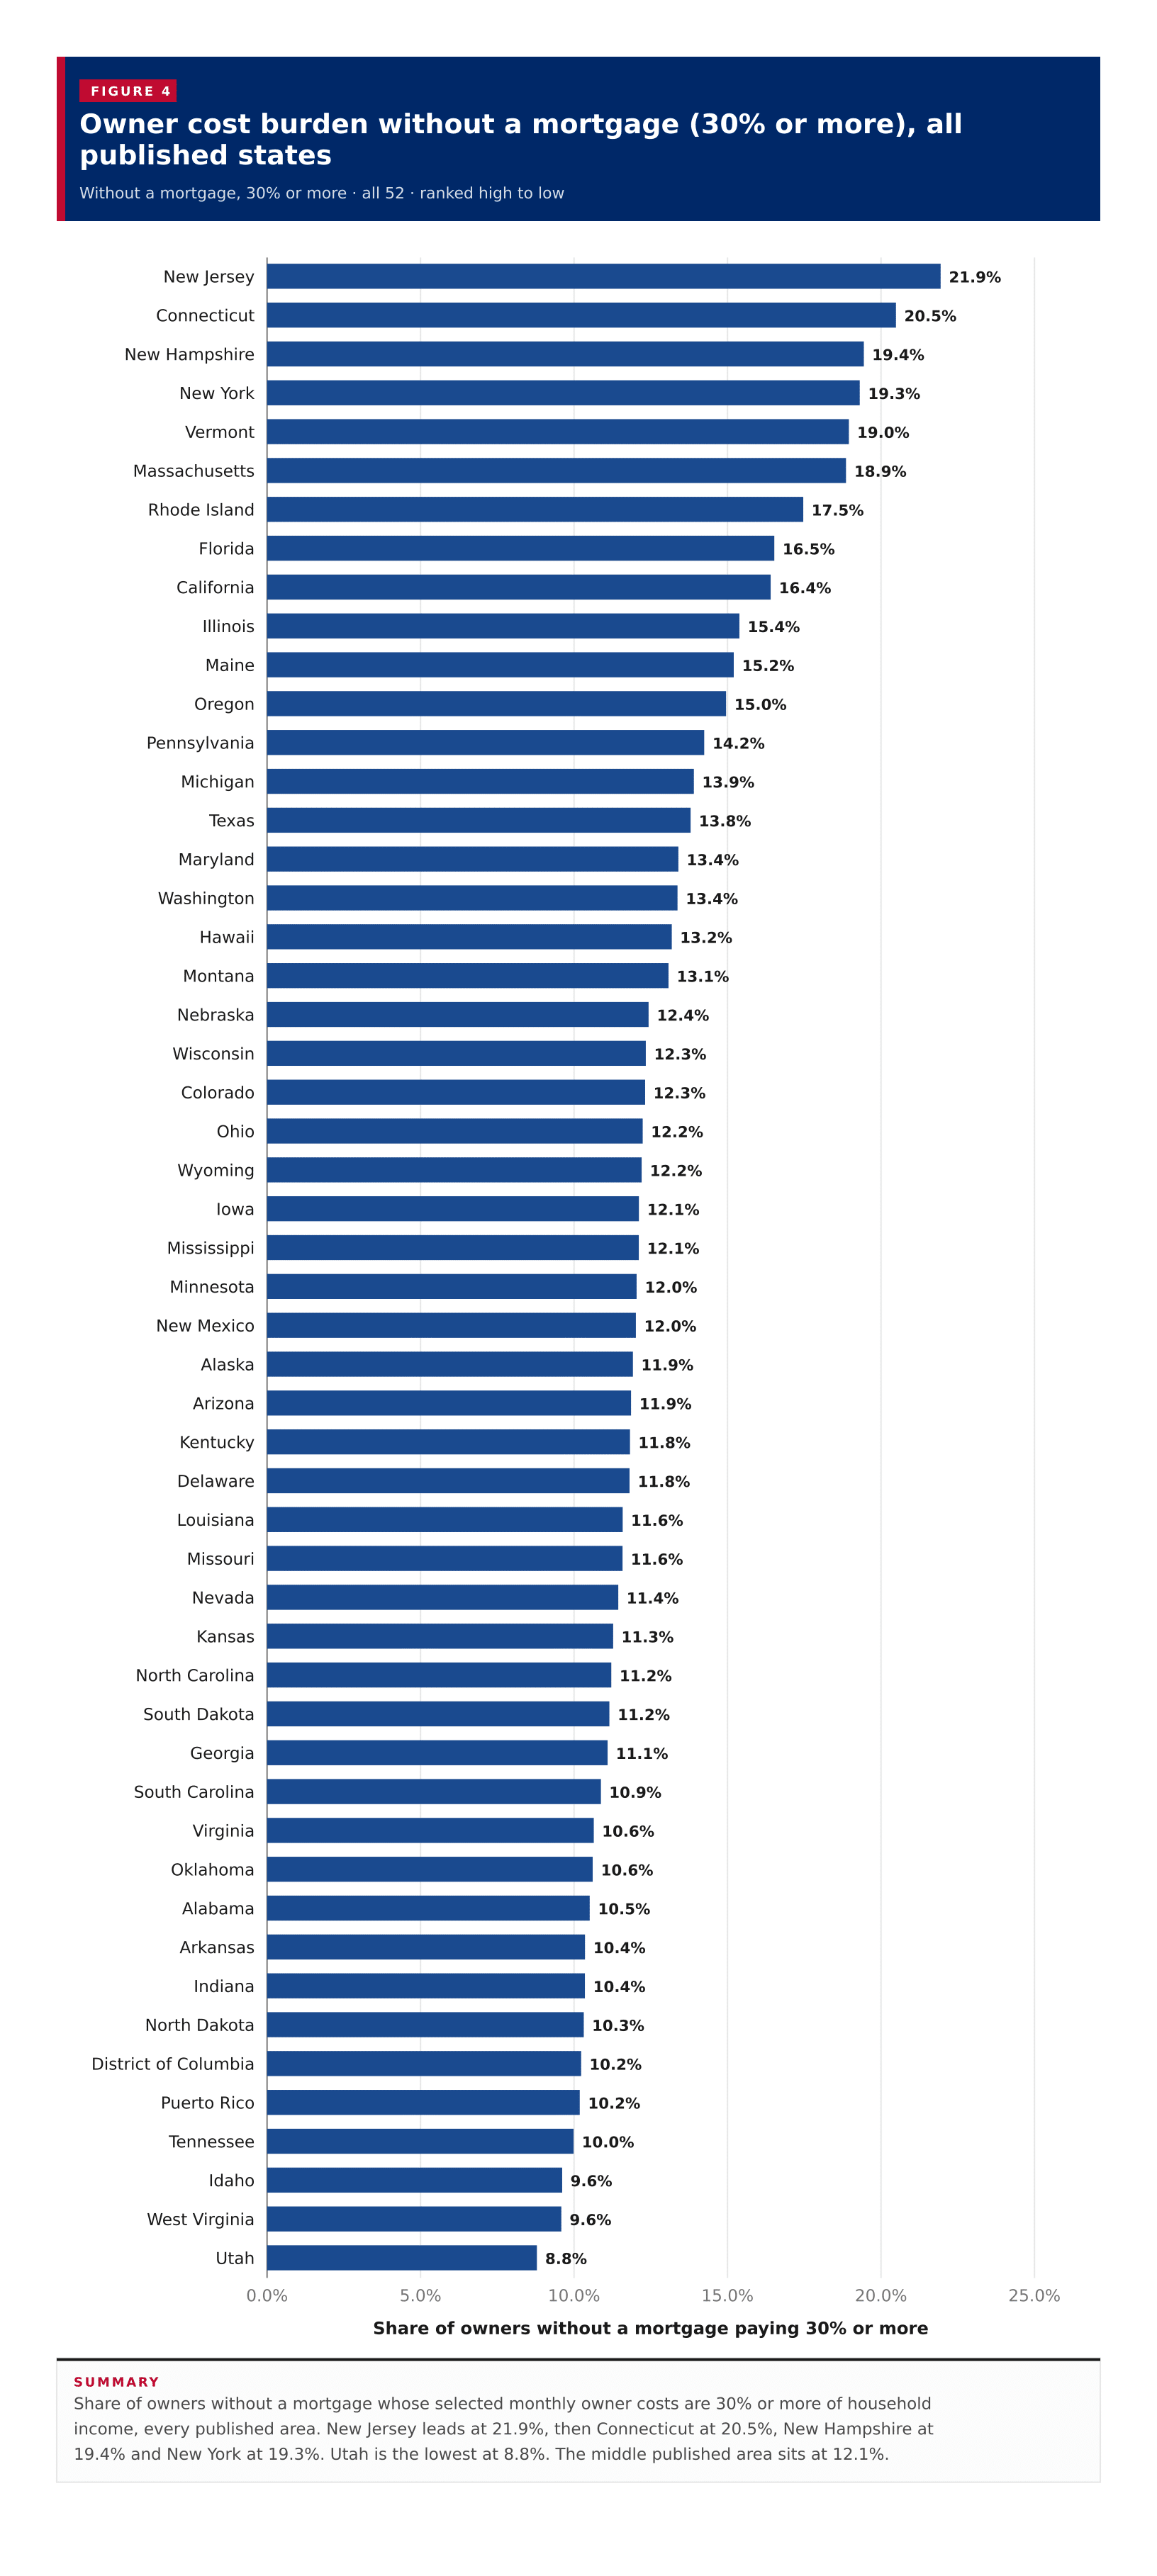
Owner cost burden without a mortgage (30% or more), all published statesShare of owners without a mortgage whose selected monthly owner costs are 30% or more of household income, every published area. New Jersey leads at 21.9%, then Connecticut at 20.5%, New Hampshire at 19.4% and New York at 19.3%. Utah is the lowest at 8.8%. The middle published area sits at 12.1%.0.0%5.0%10.0%15.0%20.0%25.0%Share of owners without a mortgage paying 30% or more21.9%New Jersey20.5%Connecticut19.4%New Hampshire19.3%New York19.0%Vermont18.9%Massachusetts17.5%Rhode Island16.5%Florida16.4%California15.4%Illinois15.2%Maine15.0%Oregon14.2%Pennsylvania13.9%Michigan13.8%Texas13.4%Maryland13.4%Washington13.2%Hawaii13.1%Montana12.4%Nebraska12.3%Wisconsin12.3%Colorado12.2%Ohio12.2%Wyoming12.1%Iowa12.1%Mississippi12.0%Minnesota12.0%New Mexico11.9%Alaska11.9%Arizona11.8%Kentucky11.8%Delaware11.6%Louisiana11.6%Missouri11.4%Nevada11.3%Kansas11.2%North Carolina11.2%South Dakota11.1%Georgia10.9%South Carolina10.6%Virginia10.6%Oklahoma10.5%Alabama10.4%Arkansas10.4%Indiana10.3%North Dakota10.2%District of Columbia10.2%Puerto Rico10.0%Tennessee9.6%Idaho9.6%West Virginia8.8%Utah
Summary

Share of owners without a mortgage whose selected monthly owner costs are 30% or more of household income, every published area. New Jersey leads at 21.9%, then Connecticut at 20.5%, New Hampshire at 19.4% and New York at 19.3%. Utah is the lowest at 8.8%. The middle published area sits at 12.1%.

Figure 4

Median owner-cost share against owner cost burden

Paying 30% or more against median owner costs as % of income · one point per row, 52 of 52 plotted

52 items
View100%
DownloadPDFImageCSV
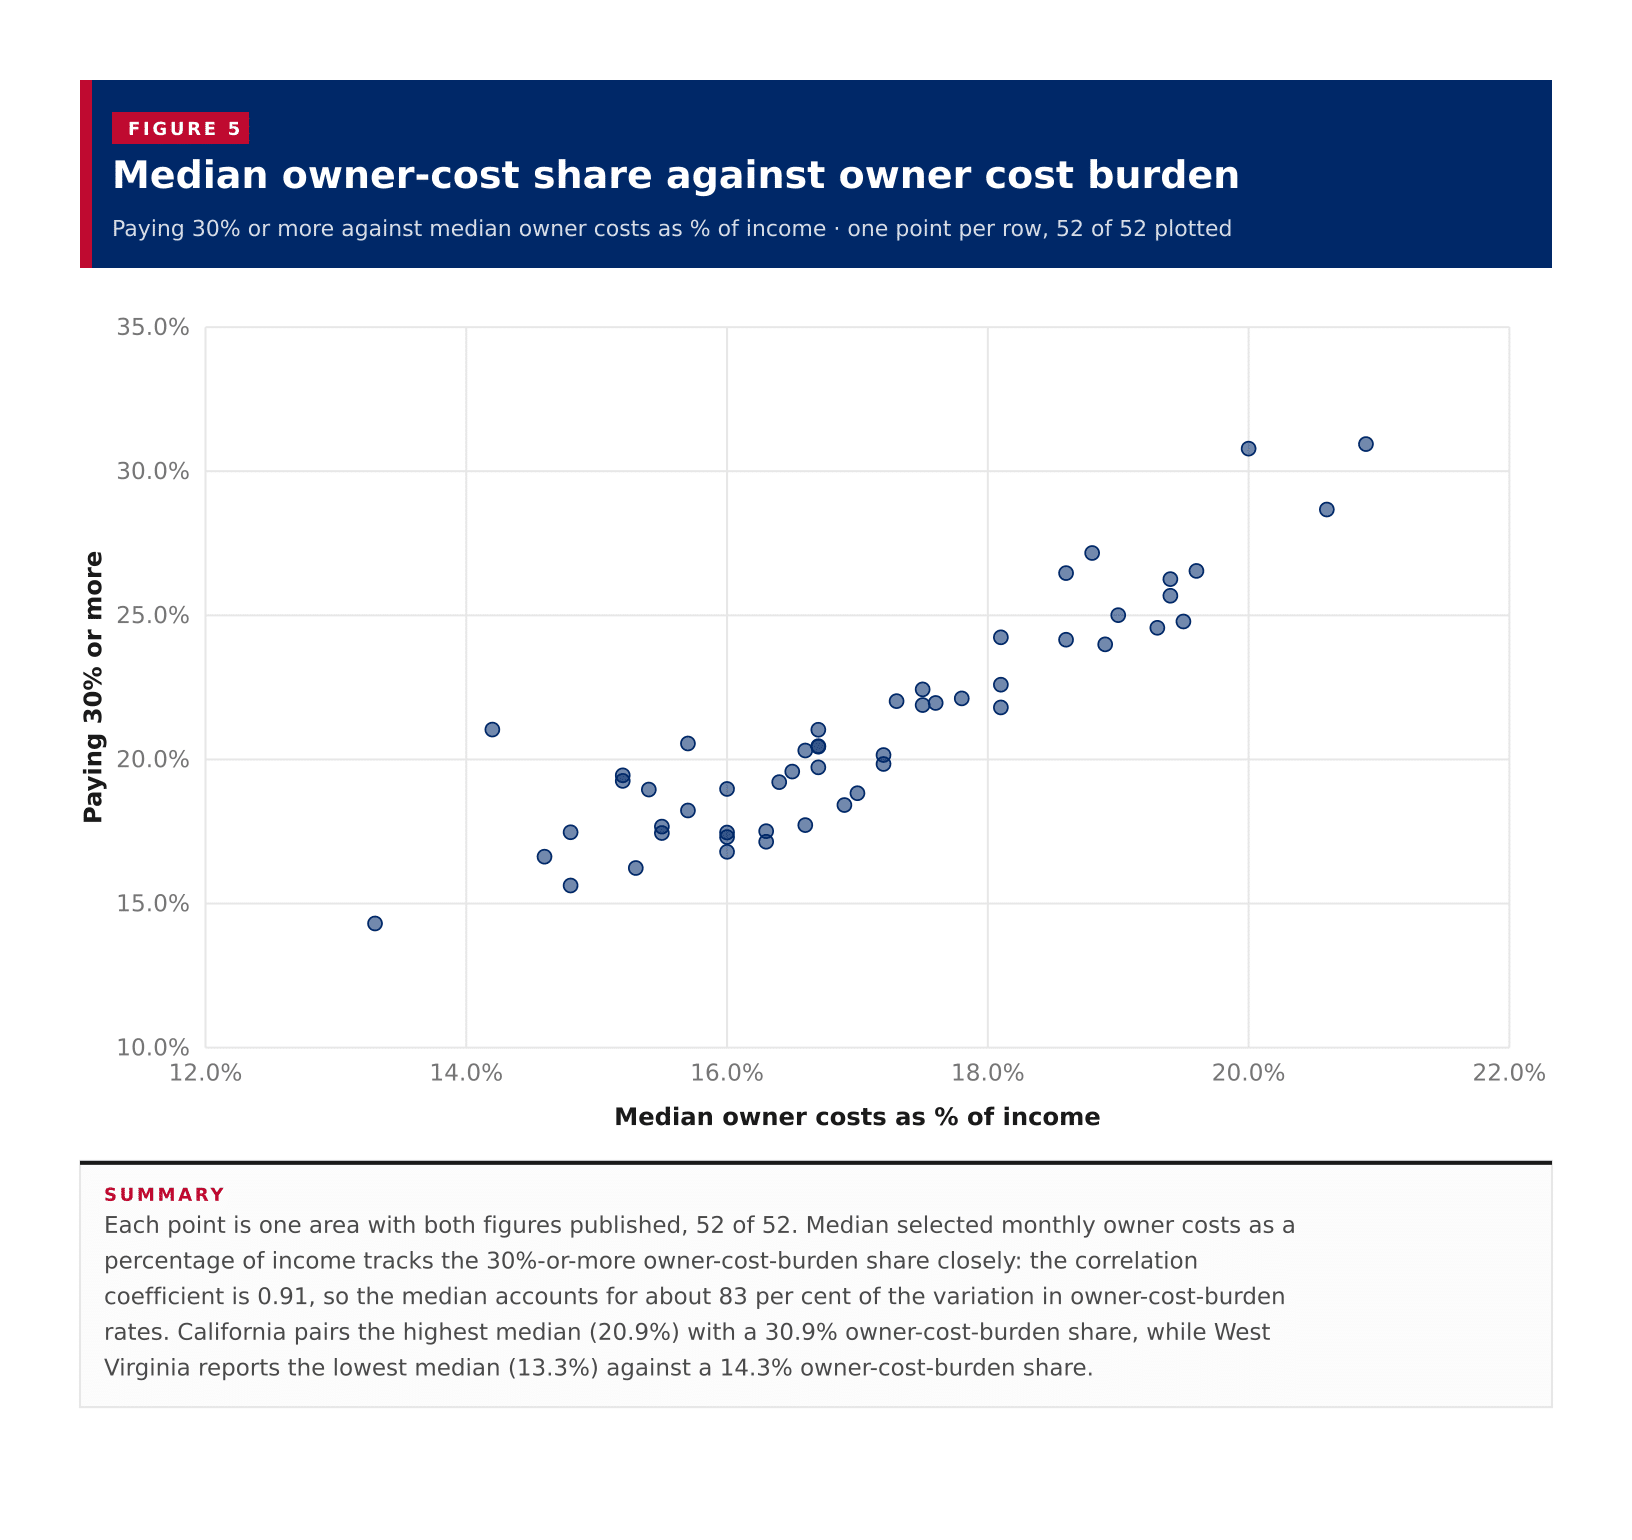
Median owner-cost share against owner cost burdenEach point is one area with both figures published, 52 of 52. Median selected monthly owner costs as a percentage of income tracks the 30%-or-more owner-cost-burden share closely: the correlation coefficient is 0.91, so the median accounts for about 83 per cent of the variation in owner-cost-burden rates. California pairs the highest median (20.9%) with a 30.9% owner-cost-burden share, while West Virginia reports the lowest median (13.3%) against a 14.3% owner-cost-burden share.10.0%15.0%20.0%25.0%30.0%35.0%12.0%14.0%16.0%18.0%20.0%22.0%Paying 30% or moreMedian owner costs as % of income
Summary

Each point is one area with both figures published, 52 of 52. Median selected monthly owner costs as a percentage of income tracks the 30%-or-more owner-cost-burden share closely: the correlation coefficient is 0.91, so the median accounts for about 83 per cent of the variation in owner-cost-burden rates. California pairs the highest median (20.9%) with a 30.9% owner-cost-burden share, while West Virginia reports the lowest median (13.3%) against a 14.3% owner-cost-burden share.

Table 1

All states

52 rows · 11 columns · sorted by paying 30% or more, low to high

52 rows
View100%
DownloadPDFImageCSV
Summary

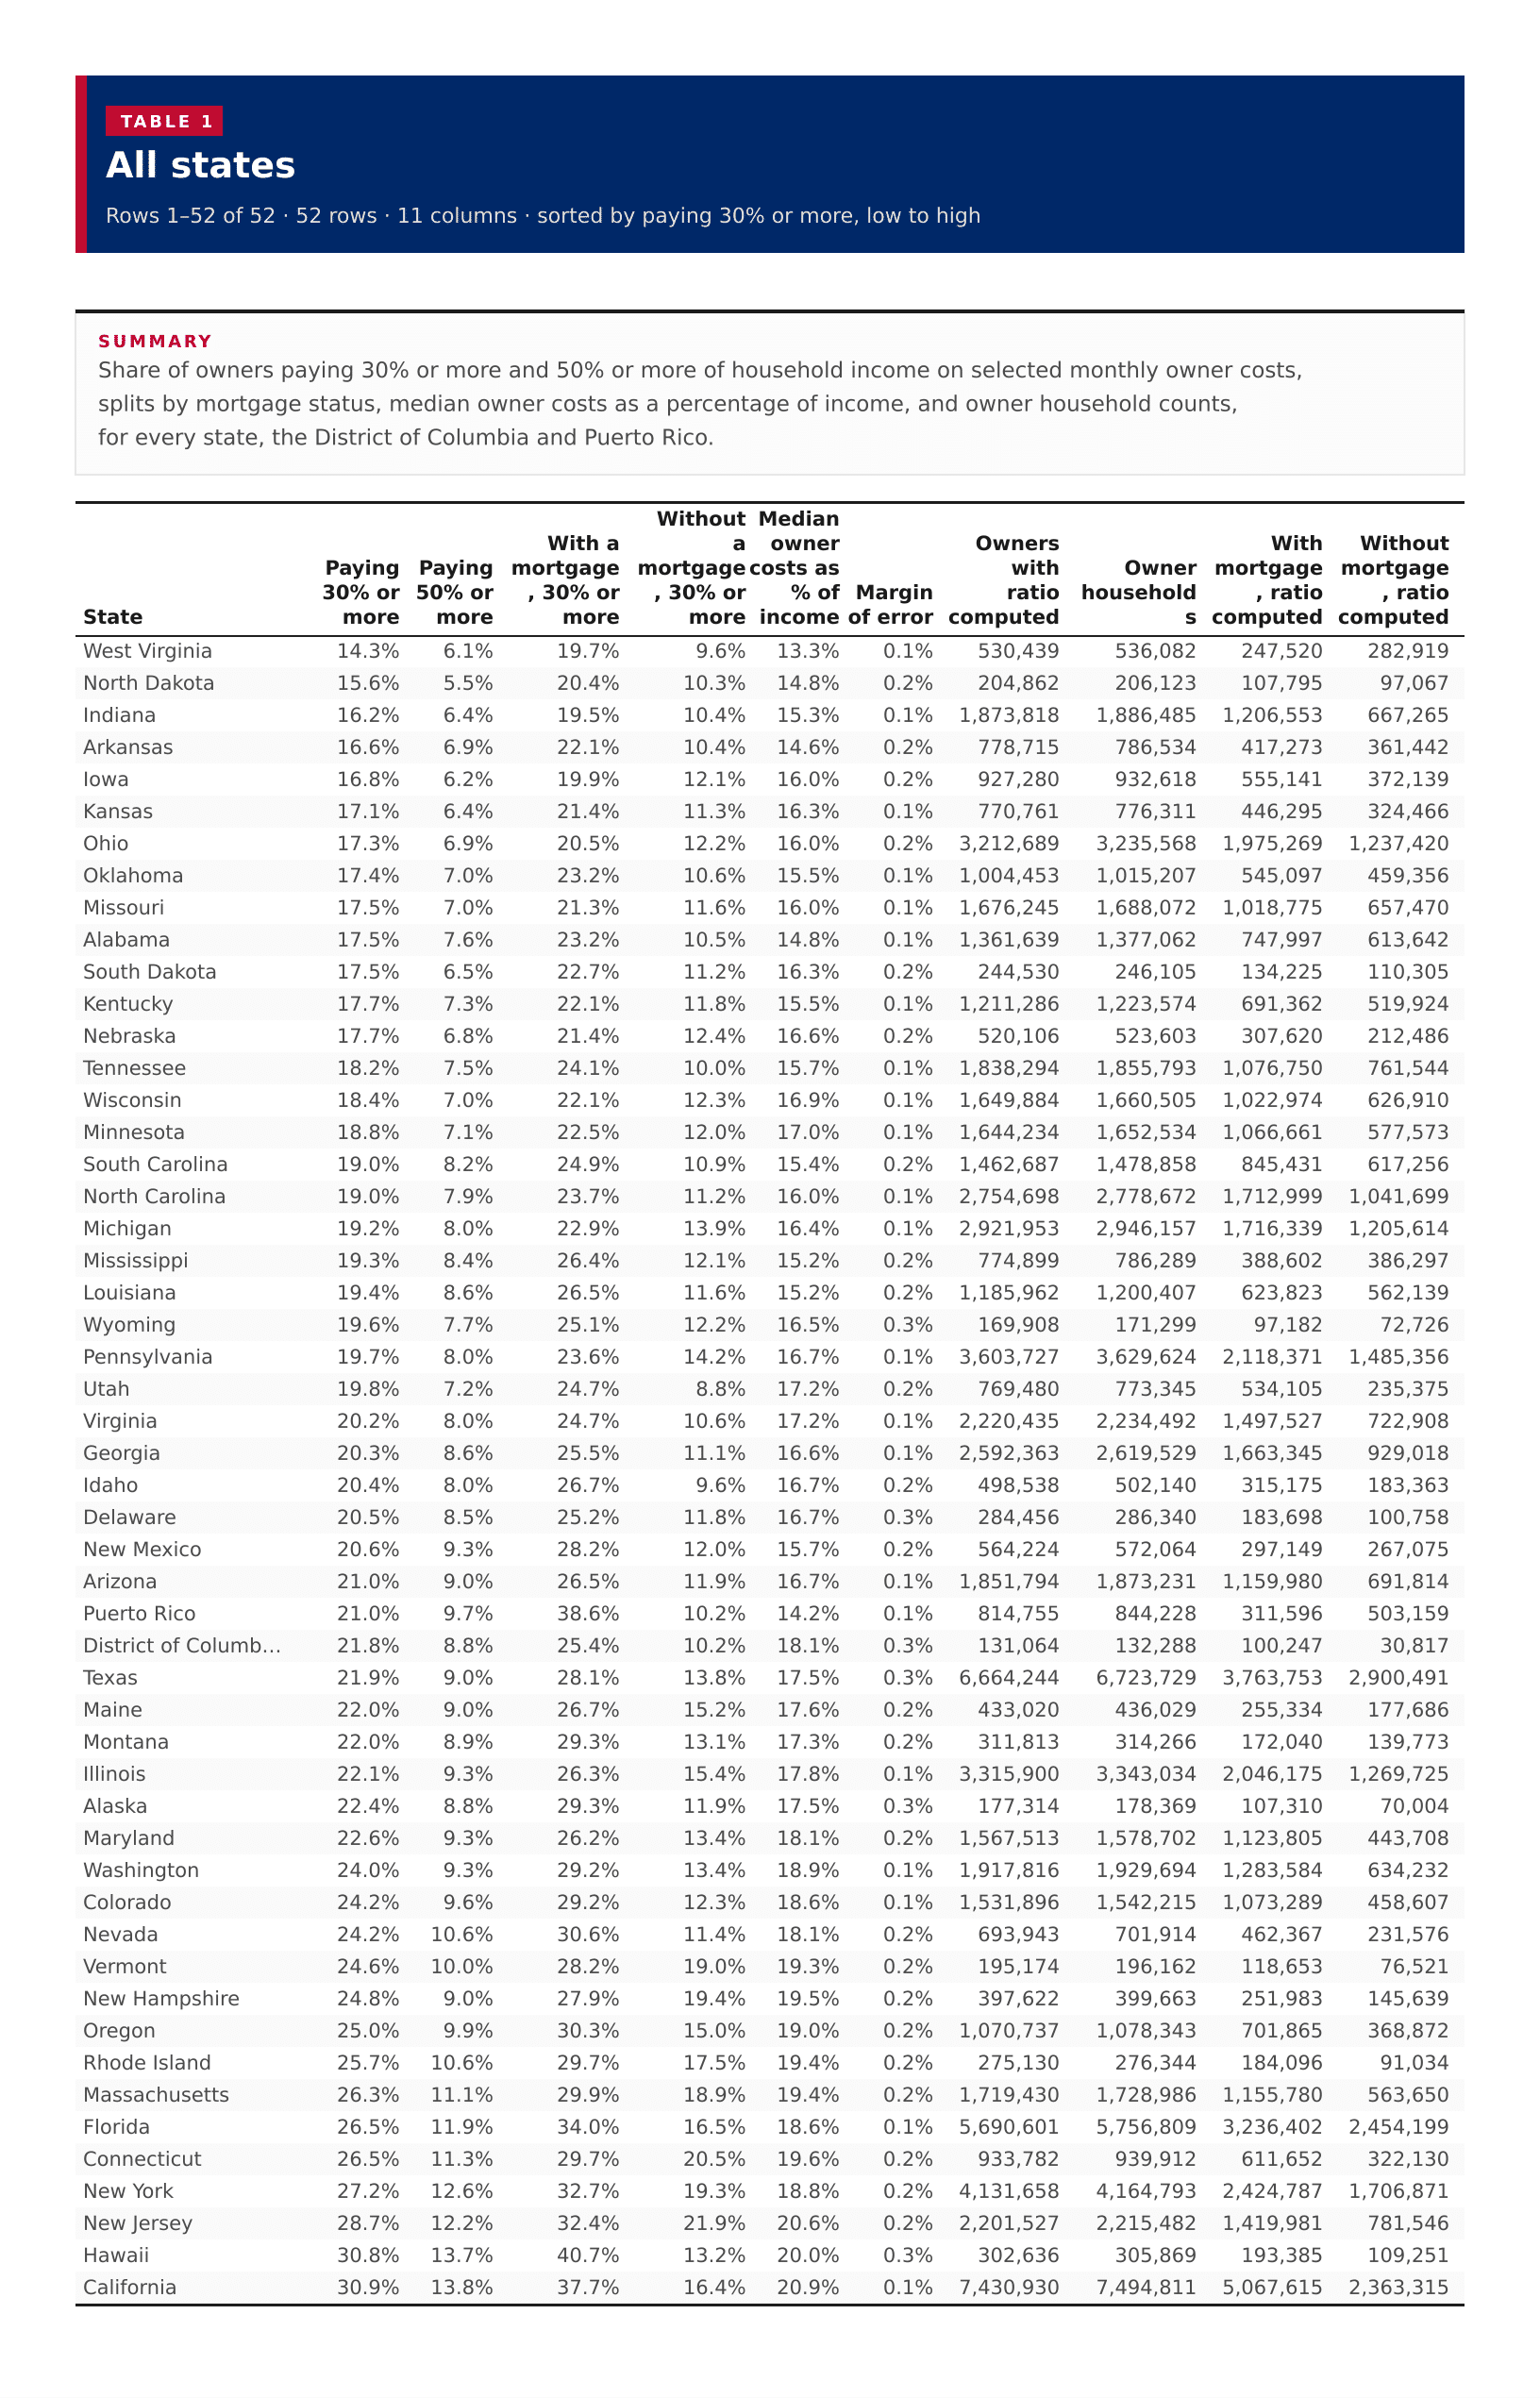
Share of owners paying 30% or more and 50% or more of household income on selected monthly owner costs, splits by mortgage status, median owner costs as a percentage of income, and owner household counts, for every state, the District of Columbia and Puerto Rico.

All states
??????????
West Virginia14.3%6.1%19.7%9.6%13.3%0.1%530,439536,082247,520282,919
North Dakota15.6%5.5%20.4%10.3%14.8%0.2%204,862206,123107,79597,067
Indiana16.2%6.4%19.5%10.4%15.3%0.1%1,873,8181,886,4851,206,553667,265
Arkansas16.6%6.9%22.1%10.4%14.6%0.2%778,715786,534417,273361,442
Iowa16.8%6.2%19.9%12.1%16.0%0.2%927,280932,618555,141372,139
Kansas17.1%6.4%21.4%11.3%16.3%0.1%770,761776,311446,295324,466
Ohio17.3%6.9%20.5%12.2%16.0%0.2%3,212,6893,235,5681,975,2691,237,420
Oklahoma17.4%7.0%23.2%10.6%15.5%0.1%1,004,4531,015,207545,097459,356
Missouri17.5%7.0%21.3%11.6%16.0%0.1%1,676,2451,688,0721,018,775657,470
Alabama17.5%7.6%23.2%10.5%14.8%0.1%1,361,6391,377,062747,997613,642
South Dakota17.5%6.5%22.7%11.2%16.3%0.2%244,530246,105134,225110,305
Kentucky17.7%7.3%22.1%11.8%15.5%0.1%1,211,2861,223,574691,362519,924
Nebraska17.7%6.8%21.4%12.4%16.6%0.2%520,106523,603307,620212,486
Tennessee18.2%7.5%24.1%10.0%15.7%0.1%1,838,2941,855,7931,076,750761,544
Wisconsin18.4%7.0%22.1%12.3%16.9%0.1%1,649,8841,660,5051,022,974626,910
Minnesota18.8%7.1%22.5%12.0%17.0%0.1%1,644,2341,652,5341,066,661577,573
South Carolina19.0%8.2%24.9%10.9%15.4%0.2%1,462,6871,478,858845,431617,256
North Carolina19.0%7.9%23.7%11.2%16.0%0.1%2,754,6982,778,6721,712,9991,041,699
Michigan19.2%8.0%22.9%13.9%16.4%0.1%2,921,9532,946,1571,716,3391,205,614
Mississippi19.3%8.4%26.4%12.1%15.2%0.2%774,899786,289388,602386,297
Louisiana19.4%8.6%26.5%11.6%15.2%0.2%1,185,9621,200,407623,823562,139
Wyoming19.6%7.7%25.1%12.2%16.5%0.3%169,908171,29997,18272,726
Pennsylvania19.7%8.0%23.6%14.2%16.7%0.1%3,603,7273,629,6242,118,3711,485,356
Utah19.8%7.2%24.7%8.8%17.2%0.2%769,480773,345534,105235,375
Virginia20.2%8.0%24.7%10.6%17.2%0.1%2,220,4352,234,4921,497,527722,908
Georgia20.3%8.6%25.5%11.1%16.6%0.1%2,592,3632,619,5291,663,345929,018
Idaho20.4%8.0%26.7%9.6%16.7%0.2%498,538502,140315,175183,363
Delaware20.5%8.5%25.2%11.8%16.7%0.3%284,456286,340183,698100,758
New Mexico20.6%9.3%28.2%12.0%15.7%0.2%564,224572,064297,149267,075
Arizona21.0%9.0%26.5%11.9%16.7%0.1%1,851,7941,873,2311,159,980691,814
Puerto Rico21.0%9.7%38.6%10.2%14.2%0.1%814,755844,228311,596503,159
District of Columbia21.8%8.8%25.4%10.2%18.1%0.3%131,064132,288100,24730,817
Texas21.9%9.0%28.1%13.8%17.5%0.3%6,664,2446,723,7293,763,7532,900,491
Maine22.0%9.0%26.7%15.2%17.6%0.2%433,020436,029255,334177,686
Montana22.0%8.9%29.3%13.1%17.3%0.2%311,813314,266172,040139,773
Illinois22.1%9.3%26.3%15.4%17.8%0.1%3,315,9003,343,0342,046,1751,269,725
Alaska22.4%8.8%29.3%11.9%17.5%0.3%177,314178,369107,31070,004
Maryland22.6%9.3%26.2%13.4%18.1%0.2%1,567,5131,578,7021,123,805443,708
Washington24.0%9.3%29.2%13.4%18.9%0.1%1,917,8161,929,6941,283,584634,232
Colorado24.2%9.6%29.2%12.3%18.6%0.1%1,531,8961,542,2151,073,289458,607
Nevada24.2%10.6%30.6%11.4%18.1%0.2%693,943701,914462,367231,576
Vermont24.6%10.0%28.2%19.0%19.3%0.2%195,174196,162118,65376,521
New Hampshire24.8%9.0%27.9%19.4%19.5%0.2%397,622399,663251,983145,639
Oregon25.0%9.9%30.3%15.0%19.0%0.2%1,070,7371,078,343701,865368,872
Rhode Island25.7%10.6%29.7%17.5%19.4%0.2%275,130276,344184,09691,034
Massachusetts26.3%11.1%29.9%18.9%19.4%0.2%1,719,4301,728,9861,155,780563,650
Florida26.5%11.9%34.0%16.5%18.6%0.1%5,690,6015,756,8093,236,4022,454,199
Connecticut26.5%11.3%29.7%20.5%19.6%0.2%933,782939,912611,652322,130
New York27.2%12.6%32.7%19.3%18.8%0.2%4,131,6584,164,7932,424,7871,706,871
New Jersey28.7%12.2%32.4%21.9%20.6%0.2%2,201,5272,215,4821,419,981781,546
Hawaii30.8%13.7%40.7%13.2%20.0%0.3%302,636305,869193,385109,251
California30.9%13.8%37.7%16.4%20.9%0.1%7,430,9307,494,8115,067,6152,363,315

Image files

Download all

Figure 1

Owner cost burden, US states
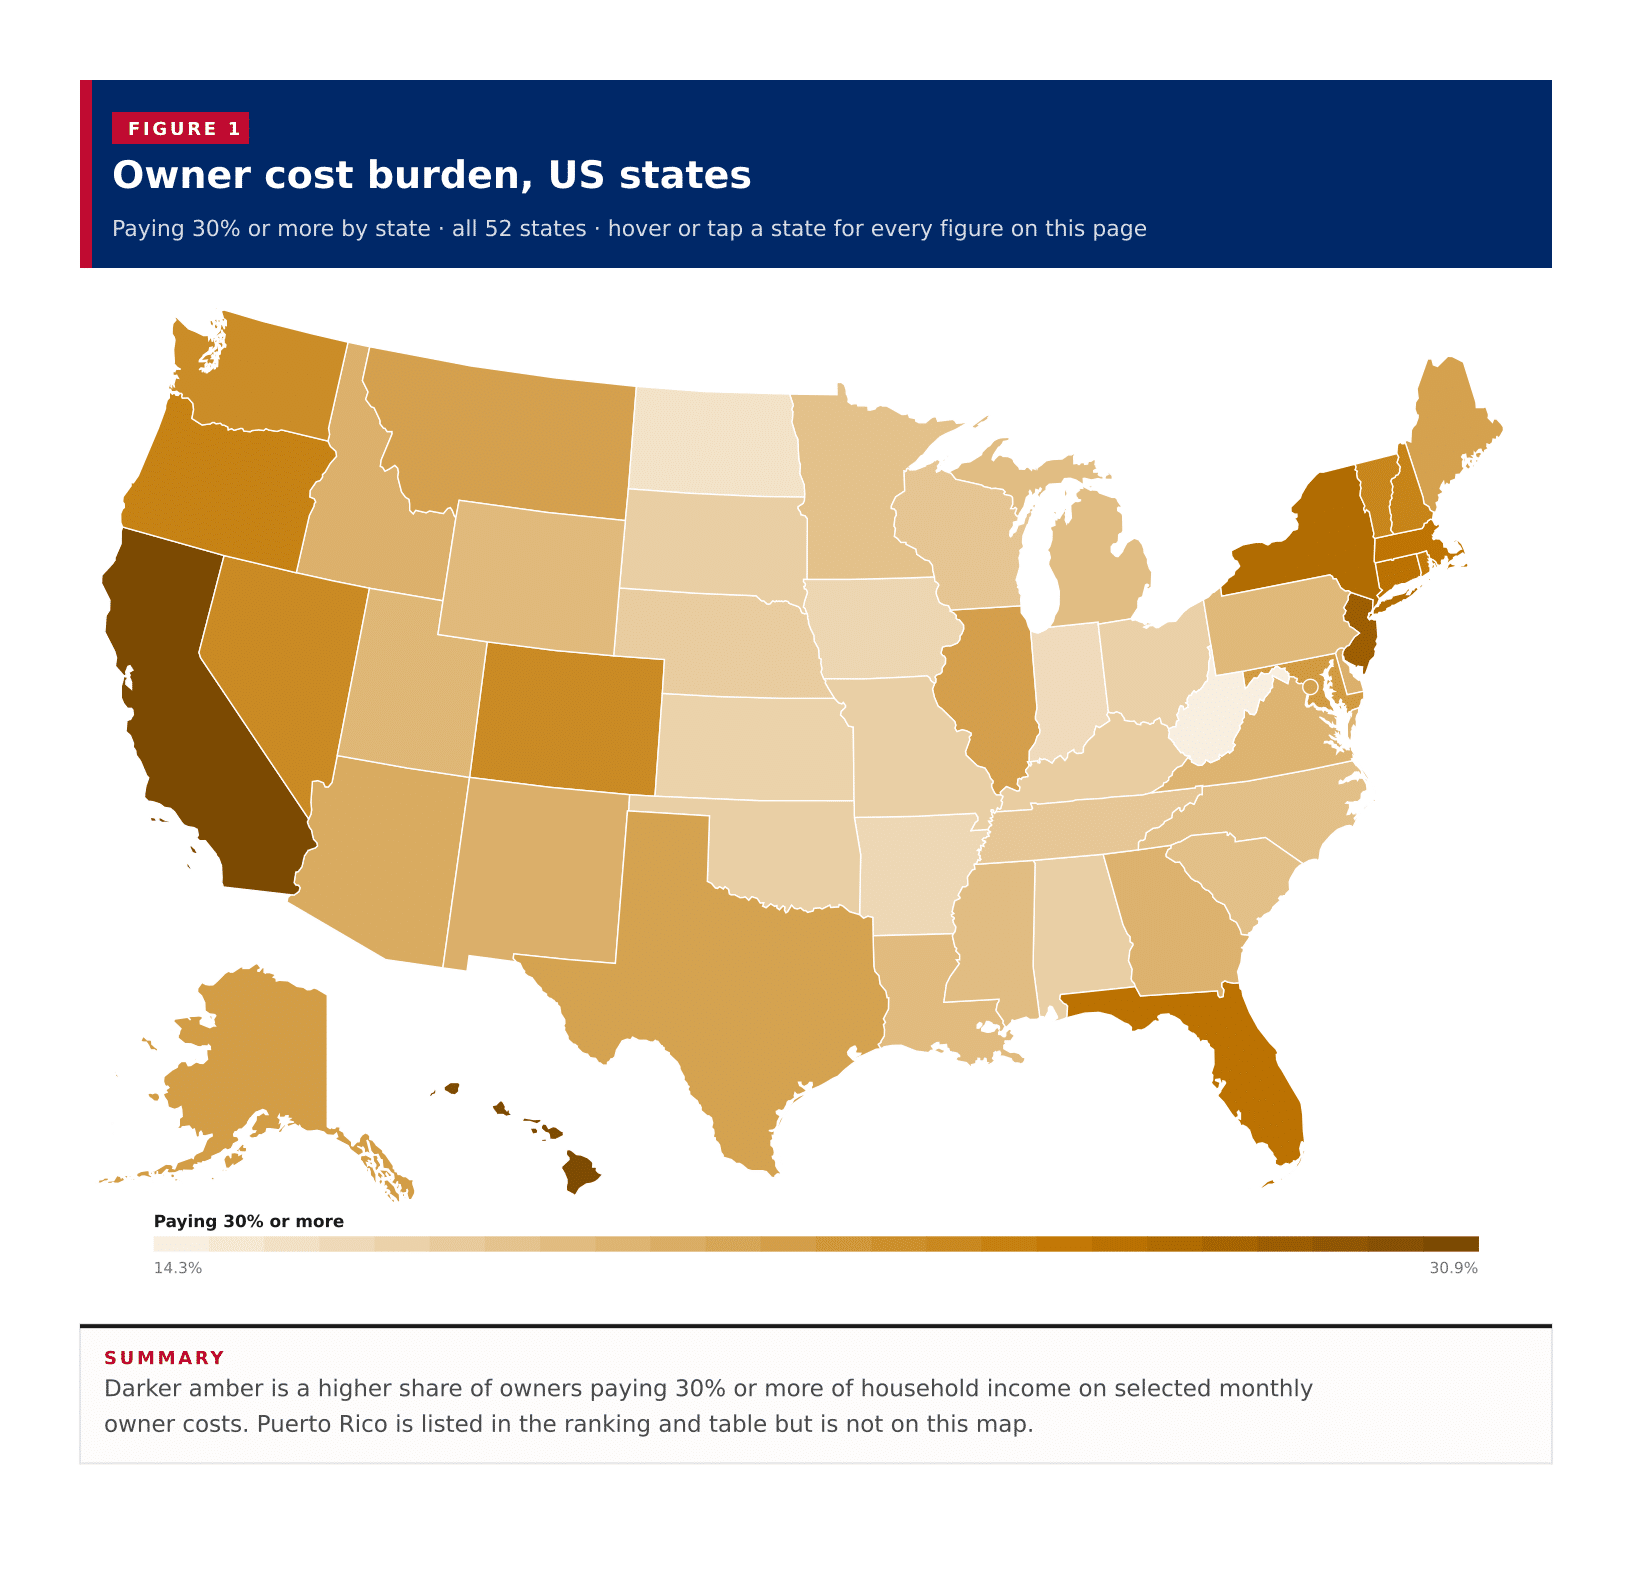
Figure 1: Owner cost burden, US states
DownloadPDFImageCSV

Figure 2

Owner cost burden (30% or more), all published states

Figure 2: Owner cost burden (30% or more), all published states
DownloadPDFImageCSV

Figure 3

Owner cost burden with a mortgage (30% or more), all published states

Figure 3: Owner cost burden with a mortgage (30% or more), all published states
DownloadPDFImageCSV

Figure 4

Owner cost burden without a mortgage (30% or more), all published states

Figure 4: Owner cost burden without a mortgage (30% or more), all published states
DownloadPDFImageCSV

Figure 5

Median owner-cost share against owner cost burden

Figure 5: Median owner-cost share against owner cost burden
DownloadPDFImageCSV

About this data

  • Owner cost burden is the share of owner-occupied households whose selected monthly owner costs are 30% or more of household income. Severe owner cost burden is the share at 50% or more. Both are computed from ACS table B25091 by adding the bracket lines at 30% and above (or 50% and above) for owners with a mortgage and owners without one.
  • The main ranking uses all owner-occupied households with a computable cost-to-income ratio: owners with a mortgage and owners without one, excluding households where the ratio was not computed (zero or negative income).
  • Separate rankings show the same 30%-or-more share among owners with a mortgage only and among owners without a mortgage only. Cost burdens are typically higher for mortgaged owners.
  • A midpoint of state shares is not a United States owner-cost rate. Each figure is for that state, the District of Columbia or Puerto Rico alone.
  • Median selected monthly owner costs as a percentage of household income comes from ACS table B25092. It is the midpoint for owner-occupied households in that area and cannot be averaged across states.
  • The Census published 50 states, the District of Columbia and Puerto Rico. None of the estimates were suppressed. Alaska and Hawaii appear in the ranking and table; on the map they are shown in the usual insets.