Figure 1
Overcrowded housing, US states
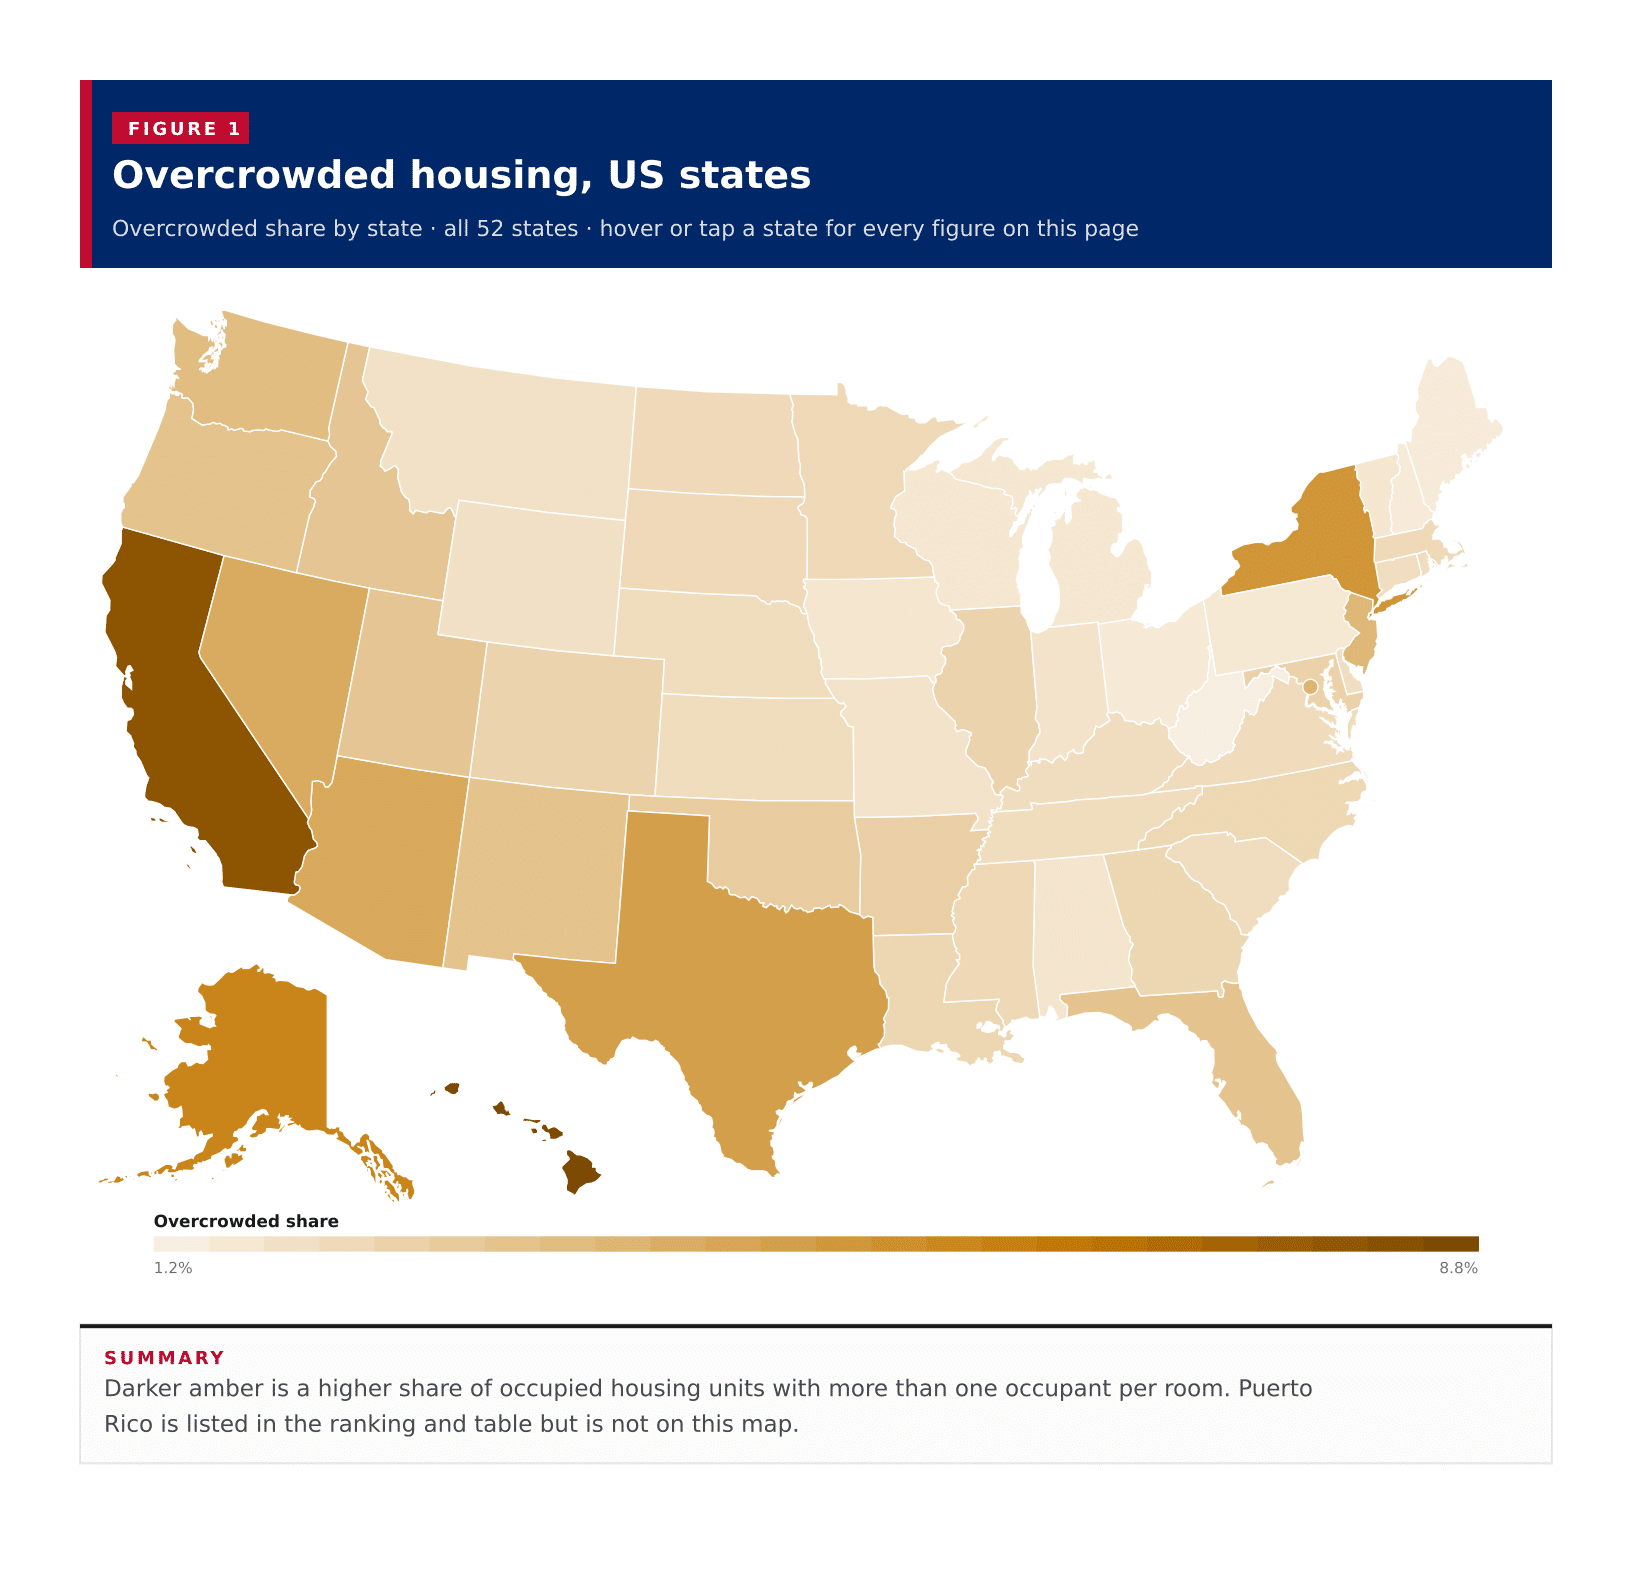
Overcrowded share by state · all 52 states · hover or tap a state for every figure on this page
A typical published area has 2.2% of occupied housing units with more than one occupant per room, the midpoint of the 50 states, the District of Columbia and Puerto Rico on the 2023 ACS five-year estimates. Hawaii leads at 8.8%, then California at 8.2%, Alaska at 5.9% and New York at 5.2%. West Virginia is the lowest at 1.2%. 4 areas reach 5%. Each share is overcrowded occupied units divided by total occupied units in that area, not a United States overcrowding rate.
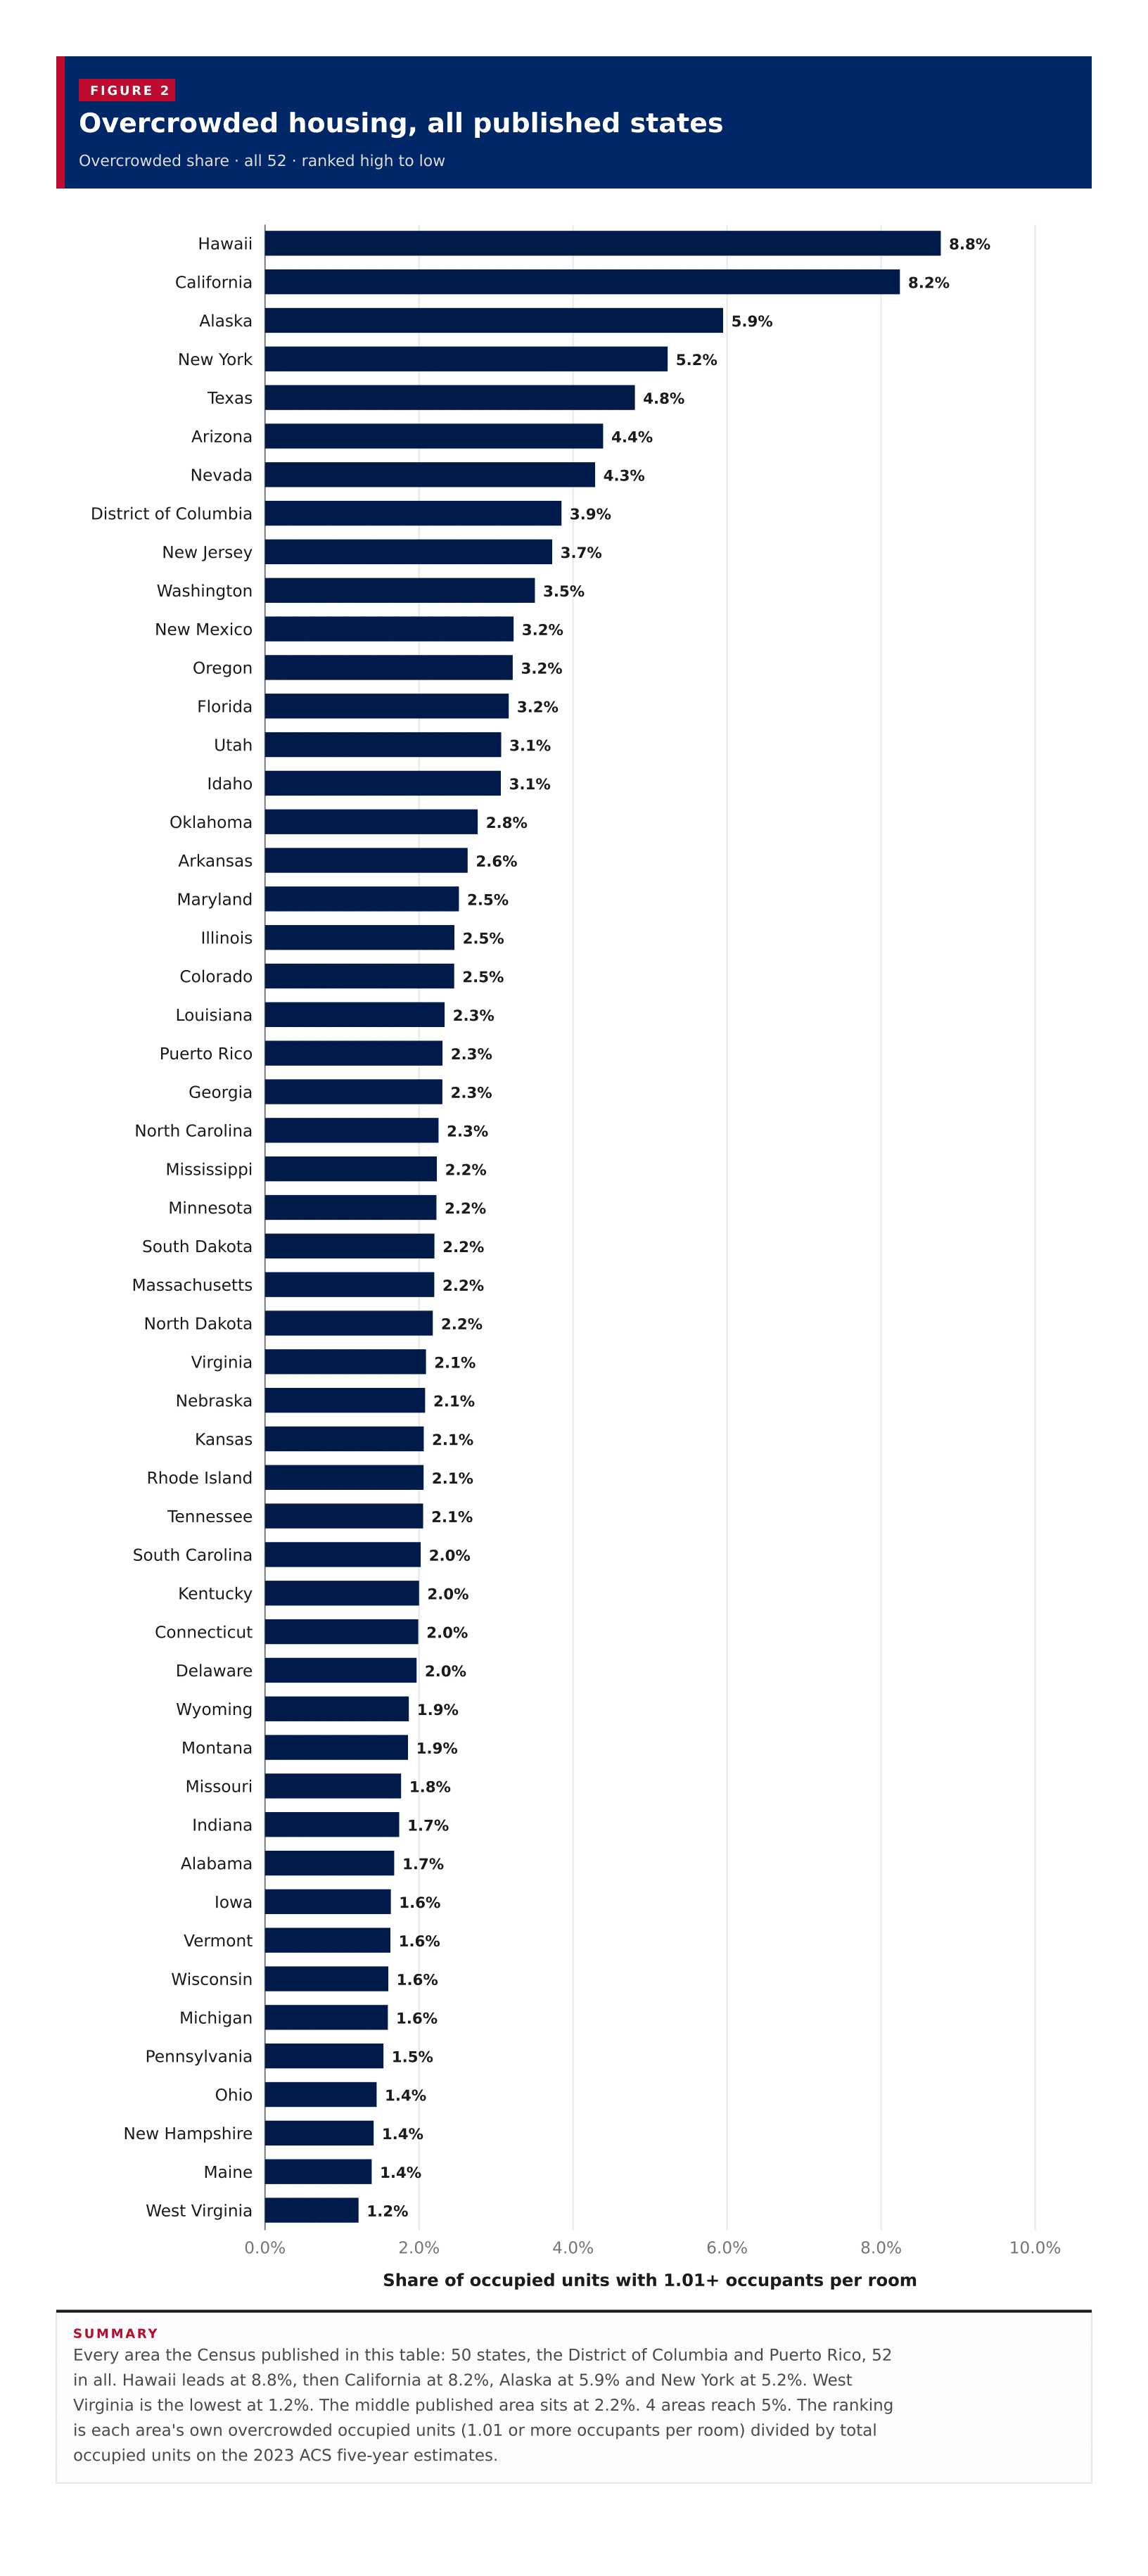
Overcrowded share · all 52 · ranked high to low
Every area the Census published in this table: 50 states, the District of Columbia and Puerto Rico, 52 in all. Hawaii leads at 8.8%, then California at 8.2%, Alaska at 5.9% and New York at 5.2%. West Virginia is the lowest at 1.2%. The middle published area sits at 2.2%. 4 areas reach 5%. The ranking is each area's own overcrowded occupied units (1.01 or more occupants per room) divided by total occupied units on the 2023 ACS five-year estimates.
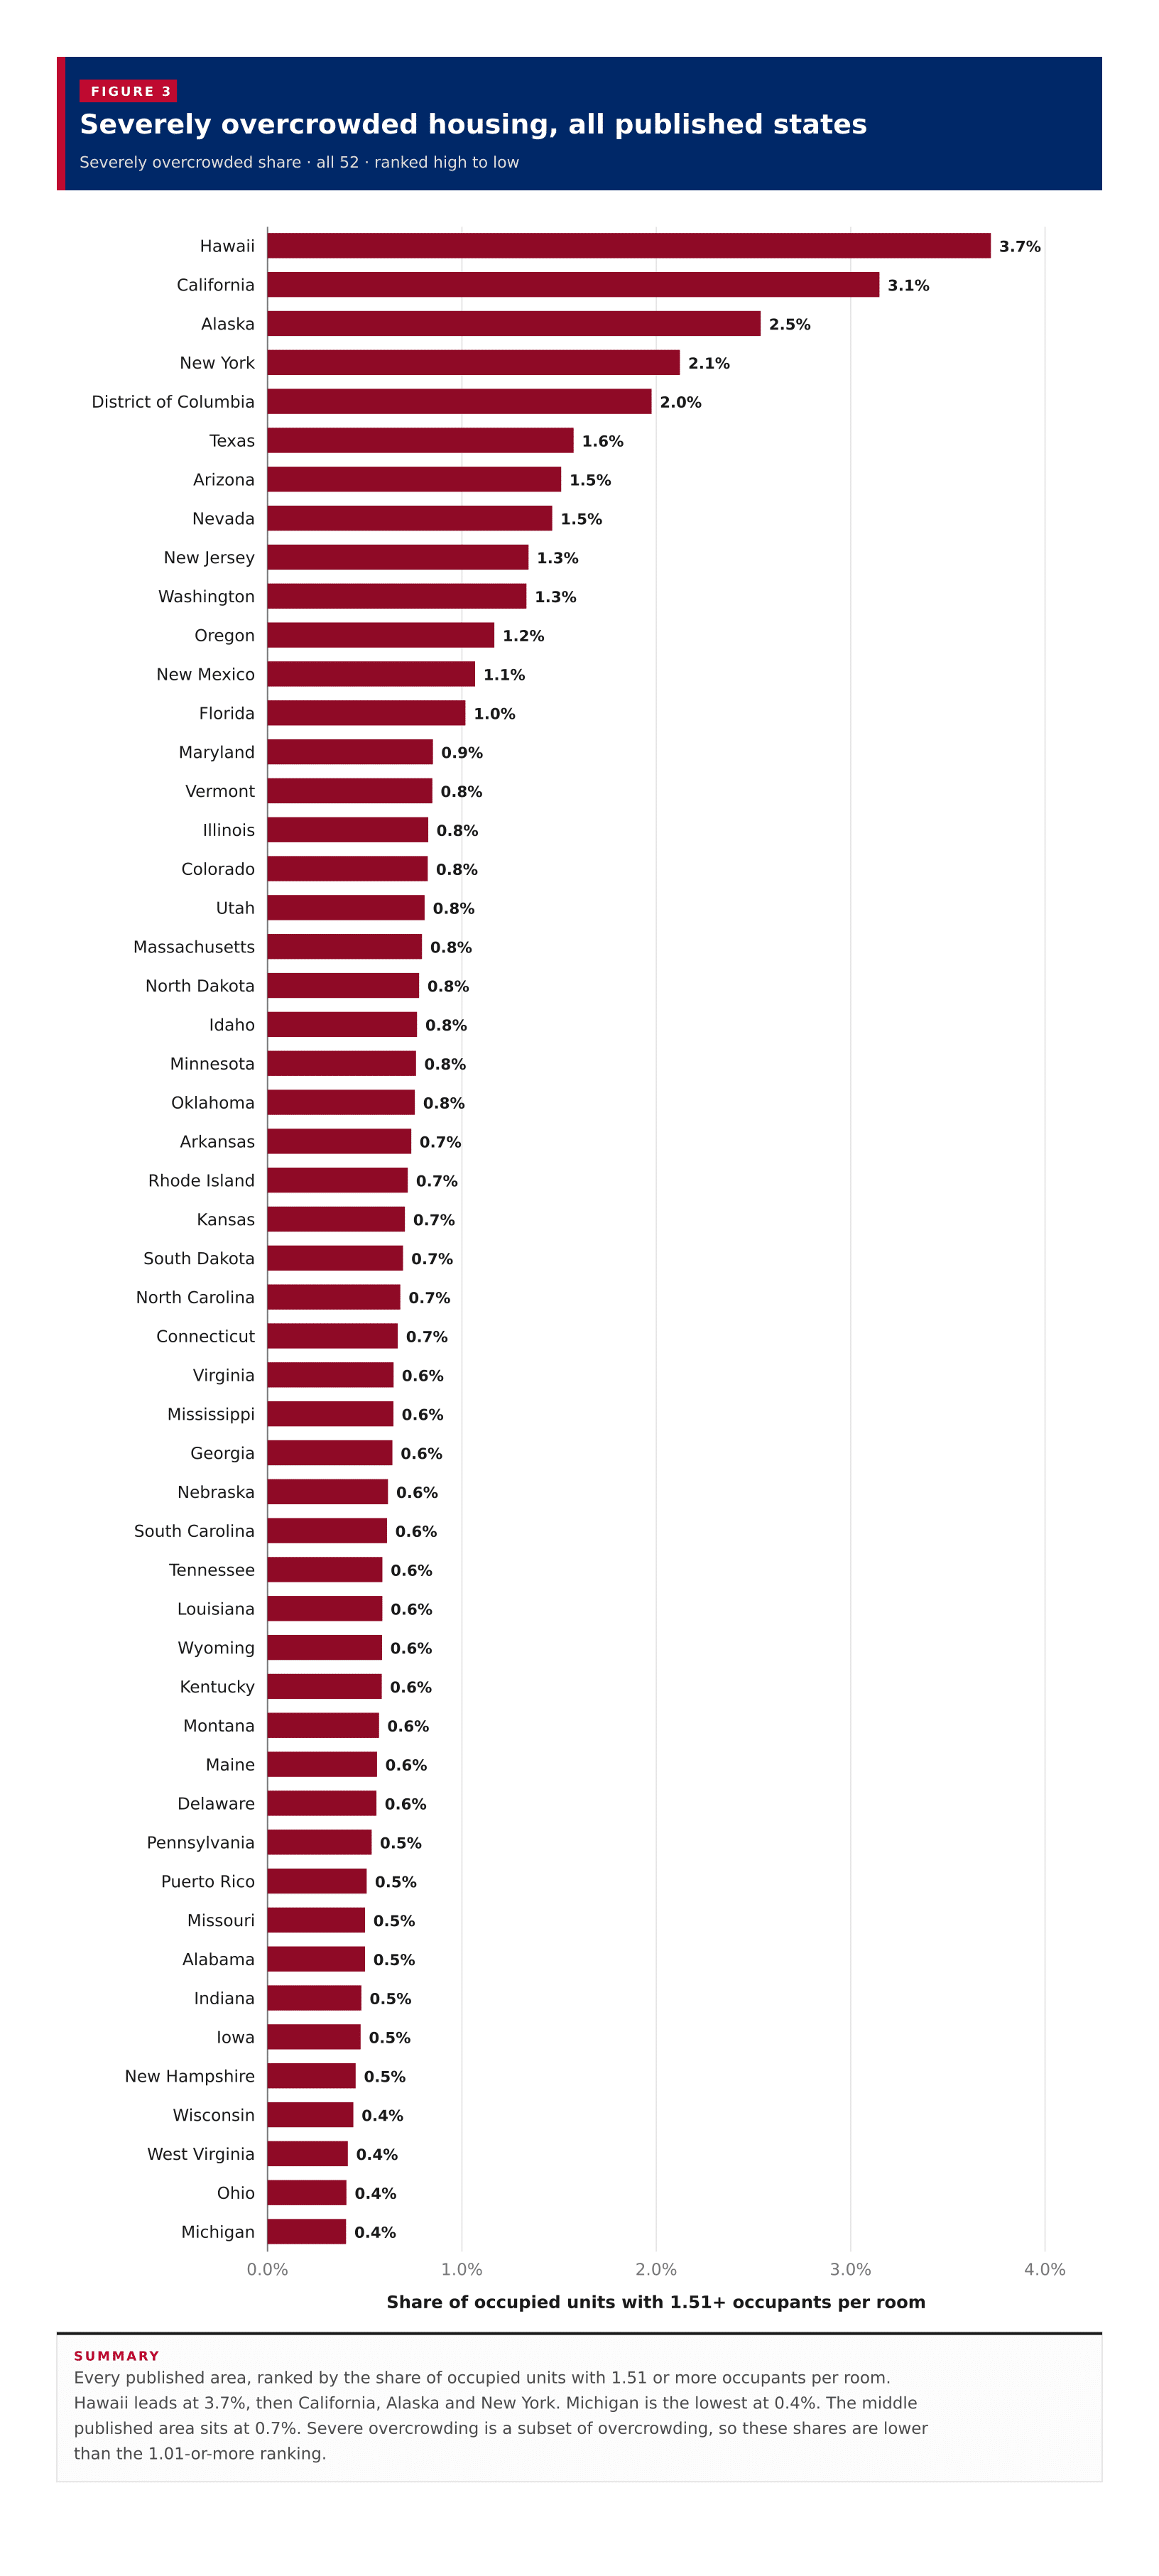
Severely overcrowded share · all 52 · ranked high to low
Every published area, ranked by the share of occupied units with 1.51 or more occupants per room. Hawaii leads at 3.7%, then California, Alaska and New York. Michigan is the lowest at 0.4%. The middle published area sits at 0.7%. Severe overcrowding is a subset of overcrowding, so these shares are lower than the 1.01-or-more ranking.
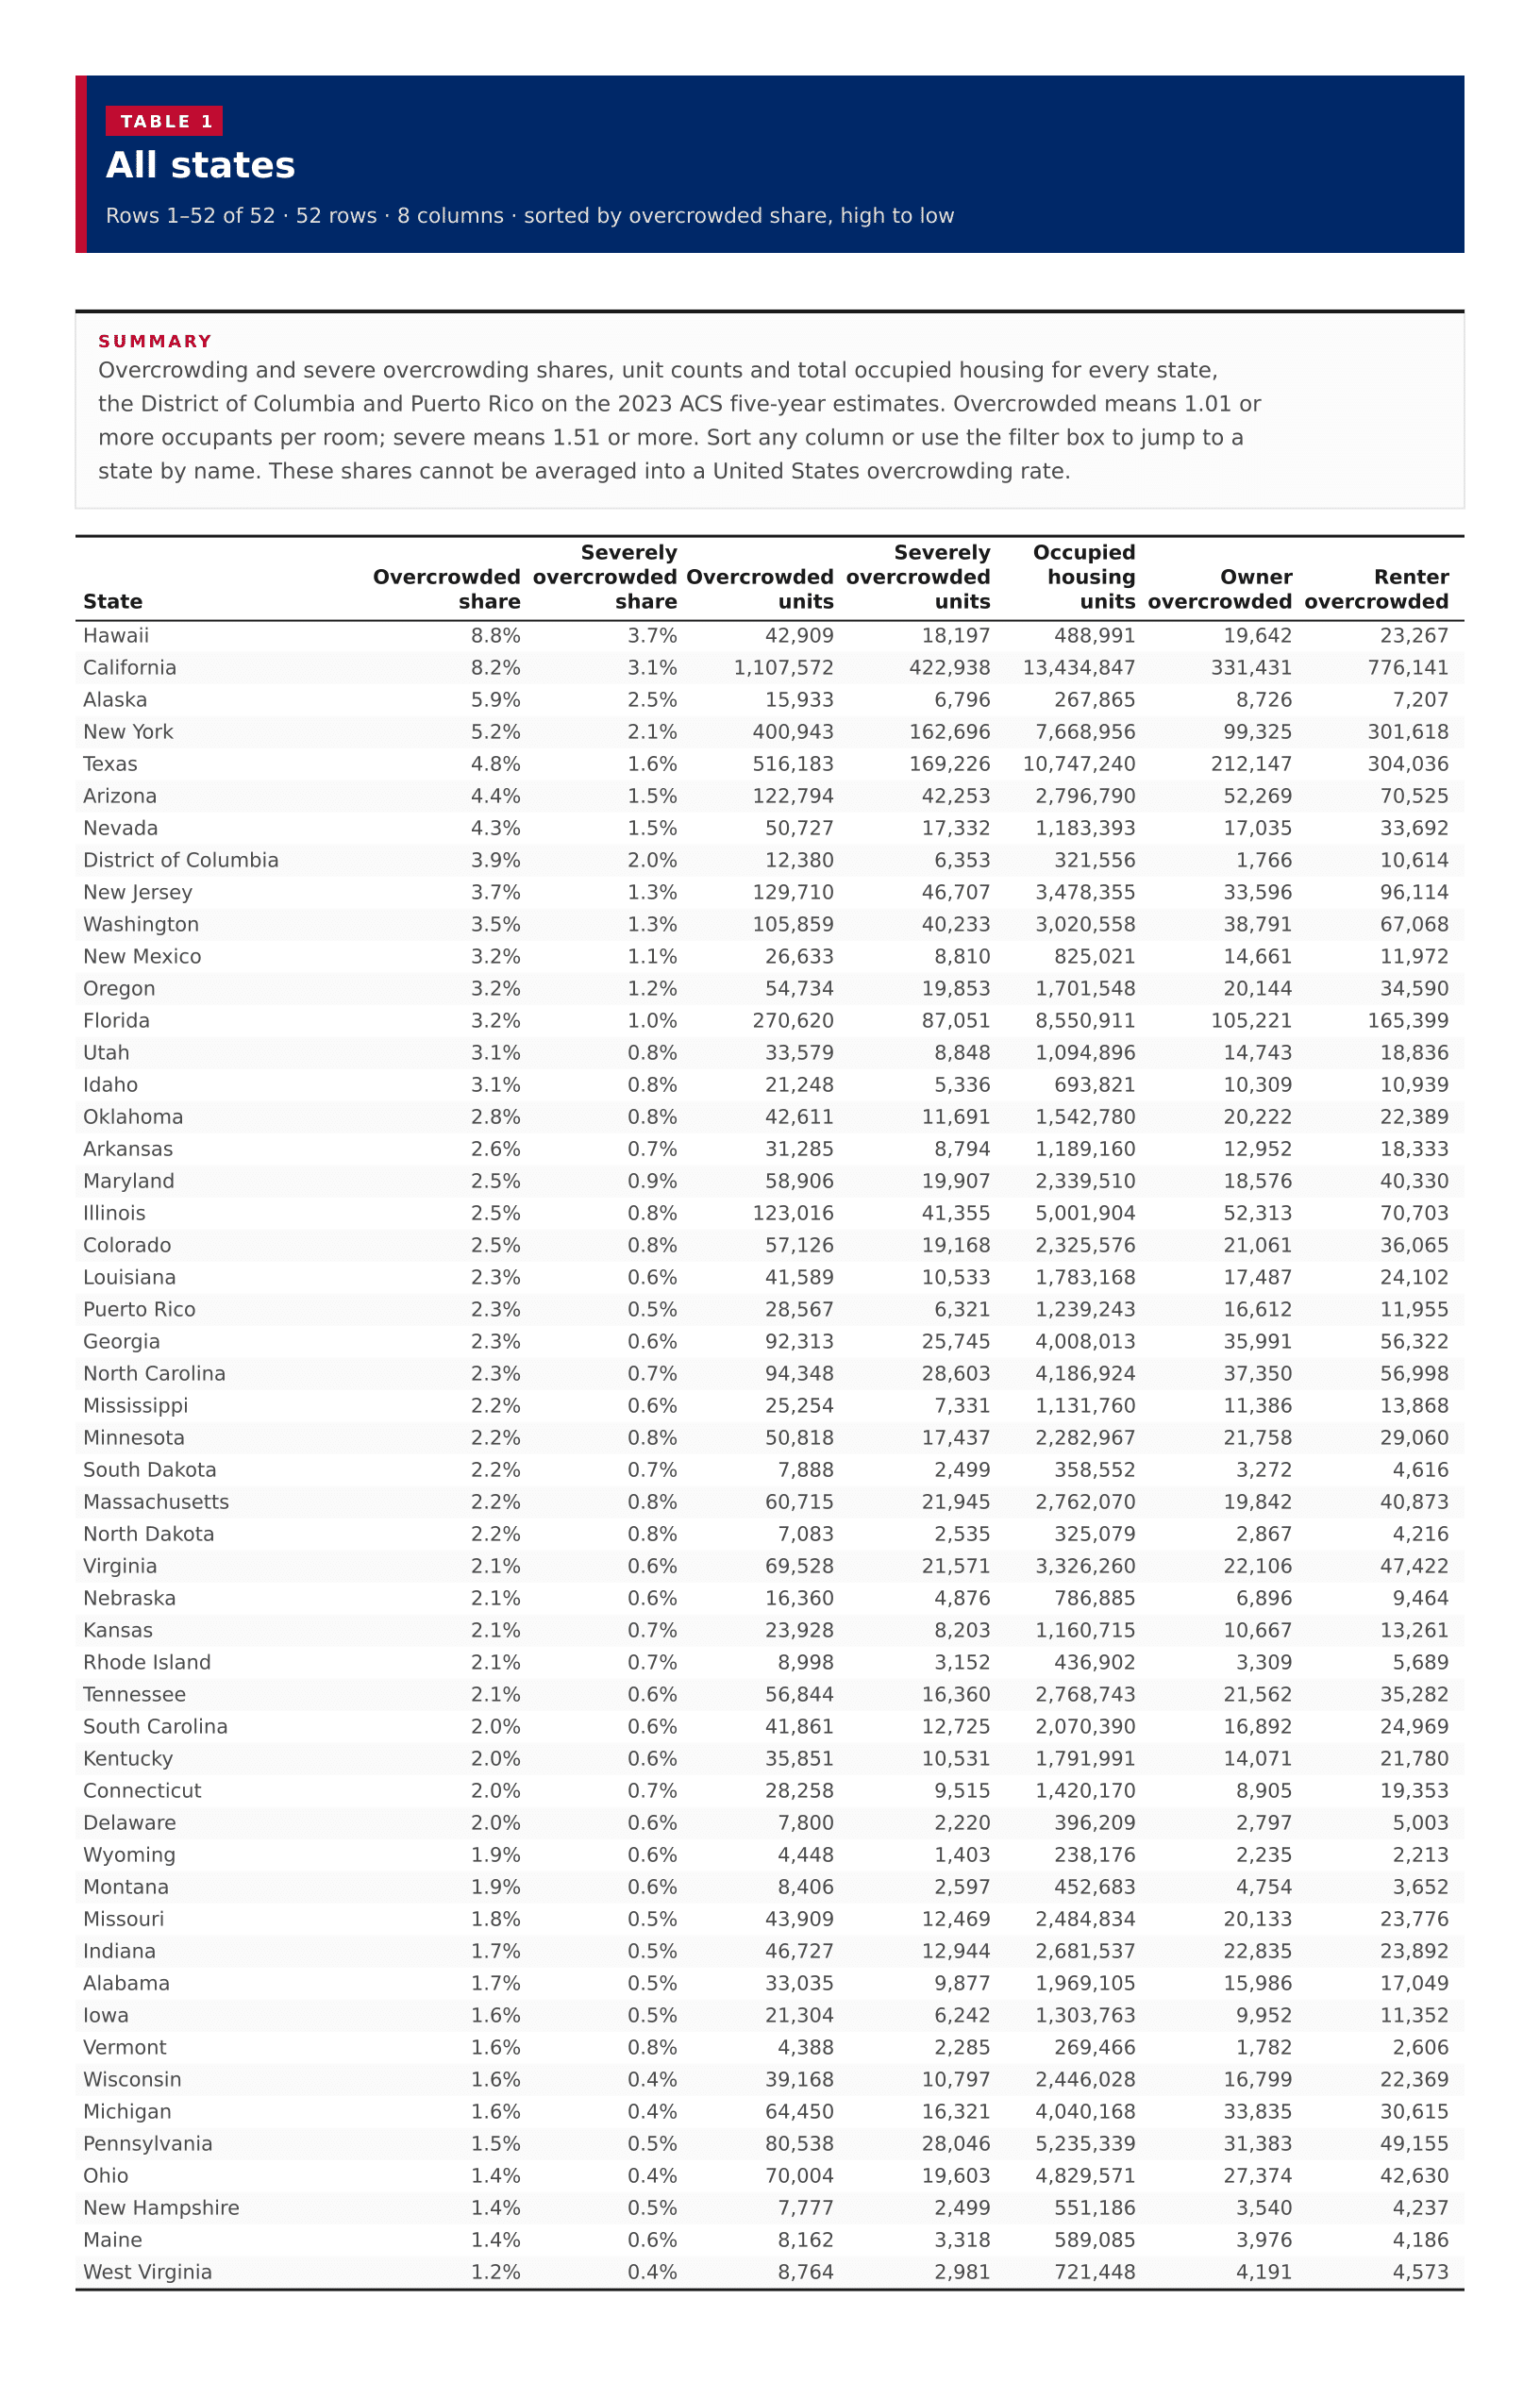
52 rows · 8 columns · sorted by overcrowded share, high to low
Overcrowding and severe overcrowding shares, unit counts and total occupied housing for every state, the District of Columbia and Puerto Rico on the 2023 ACS five-year estimates. Overcrowded means 1.01 or more occupants per room; severe means 1.51 or more. Sort any column or use the filter box to jump to a state by name. These shares cannot be averaged into a United States overcrowding rate.
| ? | ? | ? | ? | ? | ? | ? | |
|---|---|---|---|---|---|---|---|
| Hawaii | 8.8% | 3.7% | 42,909 | 18,197 | 488,991 | 19,642 | 23,267 |
| California | 8.2% | 3.1% | 1,107,572 | 422,938 | 13,434,847 | 331,431 | 776,141 |
| Alaska | 5.9% | 2.5% | 15,933 | 6,796 | 267,865 | 8,726 | 7,207 |
| New York | 5.2% | 2.1% | 400,943 | 162,696 | 7,668,956 | 99,325 | 301,618 |
| Texas | 4.8% | 1.6% | 516,183 | 169,226 | 10,747,240 | 212,147 | 304,036 |
| Arizona | 4.4% | 1.5% | 122,794 | 42,253 | 2,796,790 | 52,269 | 70,525 |
| Nevada | 4.3% | 1.5% | 50,727 | 17,332 | 1,183,393 | 17,035 | 33,692 |
| District of Columbia | 3.9% | 2.0% | 12,380 | 6,353 | 321,556 | 1,766 | 10,614 |
| New Jersey | 3.7% | 1.3% | 129,710 | 46,707 | 3,478,355 | 33,596 | 96,114 |
| Washington | 3.5% | 1.3% | 105,859 | 40,233 | 3,020,558 | 38,791 | 67,068 |
| New Mexico | 3.2% | 1.1% | 26,633 | 8,810 | 825,021 | 14,661 | 11,972 |
| Oregon | 3.2% | 1.2% | 54,734 | 19,853 | 1,701,548 | 20,144 | 34,590 |
| Florida | 3.2% | 1.0% | 270,620 | 87,051 | 8,550,911 | 105,221 | 165,399 |
| Utah | 3.1% | 0.8% | 33,579 | 8,848 | 1,094,896 | 14,743 | 18,836 |
| Idaho | 3.1% | 0.8% | 21,248 | 5,336 | 693,821 | 10,309 | 10,939 |
| Oklahoma | 2.8% | 0.8% | 42,611 | 11,691 | 1,542,780 | 20,222 | 22,389 |
| Arkansas | 2.6% | 0.7% | 31,285 | 8,794 | 1,189,160 | 12,952 | 18,333 |
| Maryland | 2.5% | 0.9% | 58,906 | 19,907 | 2,339,510 | 18,576 | 40,330 |
| Illinois | 2.5% | 0.8% | 123,016 | 41,355 | 5,001,904 | 52,313 | 70,703 |
| Colorado | 2.5% | 0.8% | 57,126 | 19,168 | 2,325,576 | 21,061 | 36,065 |
| Louisiana | 2.3% | 0.6% | 41,589 | 10,533 | 1,783,168 | 17,487 | 24,102 |
| Puerto Rico | 2.3% | 0.5% | 28,567 | 6,321 | 1,239,243 | 16,612 | 11,955 |
| Georgia | 2.3% | 0.6% | 92,313 | 25,745 | 4,008,013 | 35,991 | 56,322 |
| North Carolina | 2.3% | 0.7% | 94,348 | 28,603 | 4,186,924 | 37,350 | 56,998 |
| Mississippi | 2.2% | 0.6% | 25,254 | 7,331 | 1,131,760 | 11,386 | 13,868 |
| Minnesota | 2.2% | 0.8% | 50,818 | 17,437 | 2,282,967 | 21,758 | 29,060 |
| South Dakota | 2.2% | 0.7% | 7,888 | 2,499 | 358,552 | 3,272 | 4,616 |
| Massachusetts | 2.2% | 0.8% | 60,715 | 21,945 | 2,762,070 | 19,842 | 40,873 |
| North Dakota | 2.2% | 0.8% | 7,083 | 2,535 | 325,079 | 2,867 | 4,216 |
| Virginia | 2.1% | 0.6% | 69,528 | 21,571 | 3,326,260 | 22,106 | 47,422 |
| Nebraska | 2.1% | 0.6% | 16,360 | 4,876 | 786,885 | 6,896 | 9,464 |
| Kansas | 2.1% | 0.7% | 23,928 | 8,203 | 1,160,715 | 10,667 | 13,261 |
| Rhode Island | 2.1% | 0.7% | 8,998 | 3,152 | 436,902 | 3,309 | 5,689 |
| Tennessee | 2.1% | 0.6% | 56,844 | 16,360 | 2,768,743 | 21,562 | 35,282 |
| South Carolina | 2.0% | 0.6% | 41,861 | 12,725 | 2,070,390 | 16,892 | 24,969 |
| Kentucky | 2.0% | 0.6% | 35,851 | 10,531 | 1,791,991 | 14,071 | 21,780 |
| Connecticut | 2.0% | 0.7% | 28,258 | 9,515 | 1,420,170 | 8,905 | 19,353 |
| Delaware | 2.0% | 0.6% | 7,800 | 2,220 | 396,209 | 2,797 | 5,003 |
| Wyoming | 1.9% | 0.6% | 4,448 | 1,403 | 238,176 | 2,235 | 2,213 |
| Montana | 1.9% | 0.6% | 8,406 | 2,597 | 452,683 | 4,754 | 3,652 |
| Missouri | 1.8% | 0.5% | 43,909 | 12,469 | 2,484,834 | 20,133 | 23,776 |
| Indiana | 1.7% | 0.5% | 46,727 | 12,944 | 2,681,537 | 22,835 | 23,892 |
| Alabama | 1.7% | 0.5% | 33,035 | 9,877 | 1,969,105 | 15,986 | 17,049 |
| Iowa | 1.6% | 0.5% | 21,304 | 6,242 | 1,303,763 | 9,952 | 11,352 |
| Vermont | 1.6% | 0.8% | 4,388 | 2,285 | 269,466 | 1,782 | 2,606 |
| Wisconsin | 1.6% | 0.4% | 39,168 | 10,797 | 2,446,028 | 16,799 | 22,369 |
| Michigan | 1.6% | 0.4% | 64,450 | 16,321 | 4,040,168 | 33,835 | 30,615 |
| Pennsylvania | 1.5% | 0.5% | 80,538 | 28,046 | 5,235,339 | 31,383 | 49,155 |
| Ohio | 1.4% | 0.4% | 70,004 | 19,603 | 4,829,571 | 27,374 | 42,630 |
| New Hampshire | 1.4% | 0.5% | 7,777 | 2,499 | 551,186 | 3,540 | 4,237 |
| Maine | 1.4% | 0.6% | 8,162 | 3,318 | 589,085 | 3,976 | 4,186 |
| West Virginia | 1.2% | 0.4% | 8,764 | 2,981 | 721,448 | 4,191 | 4,573 |