Median home value by US state

Summary

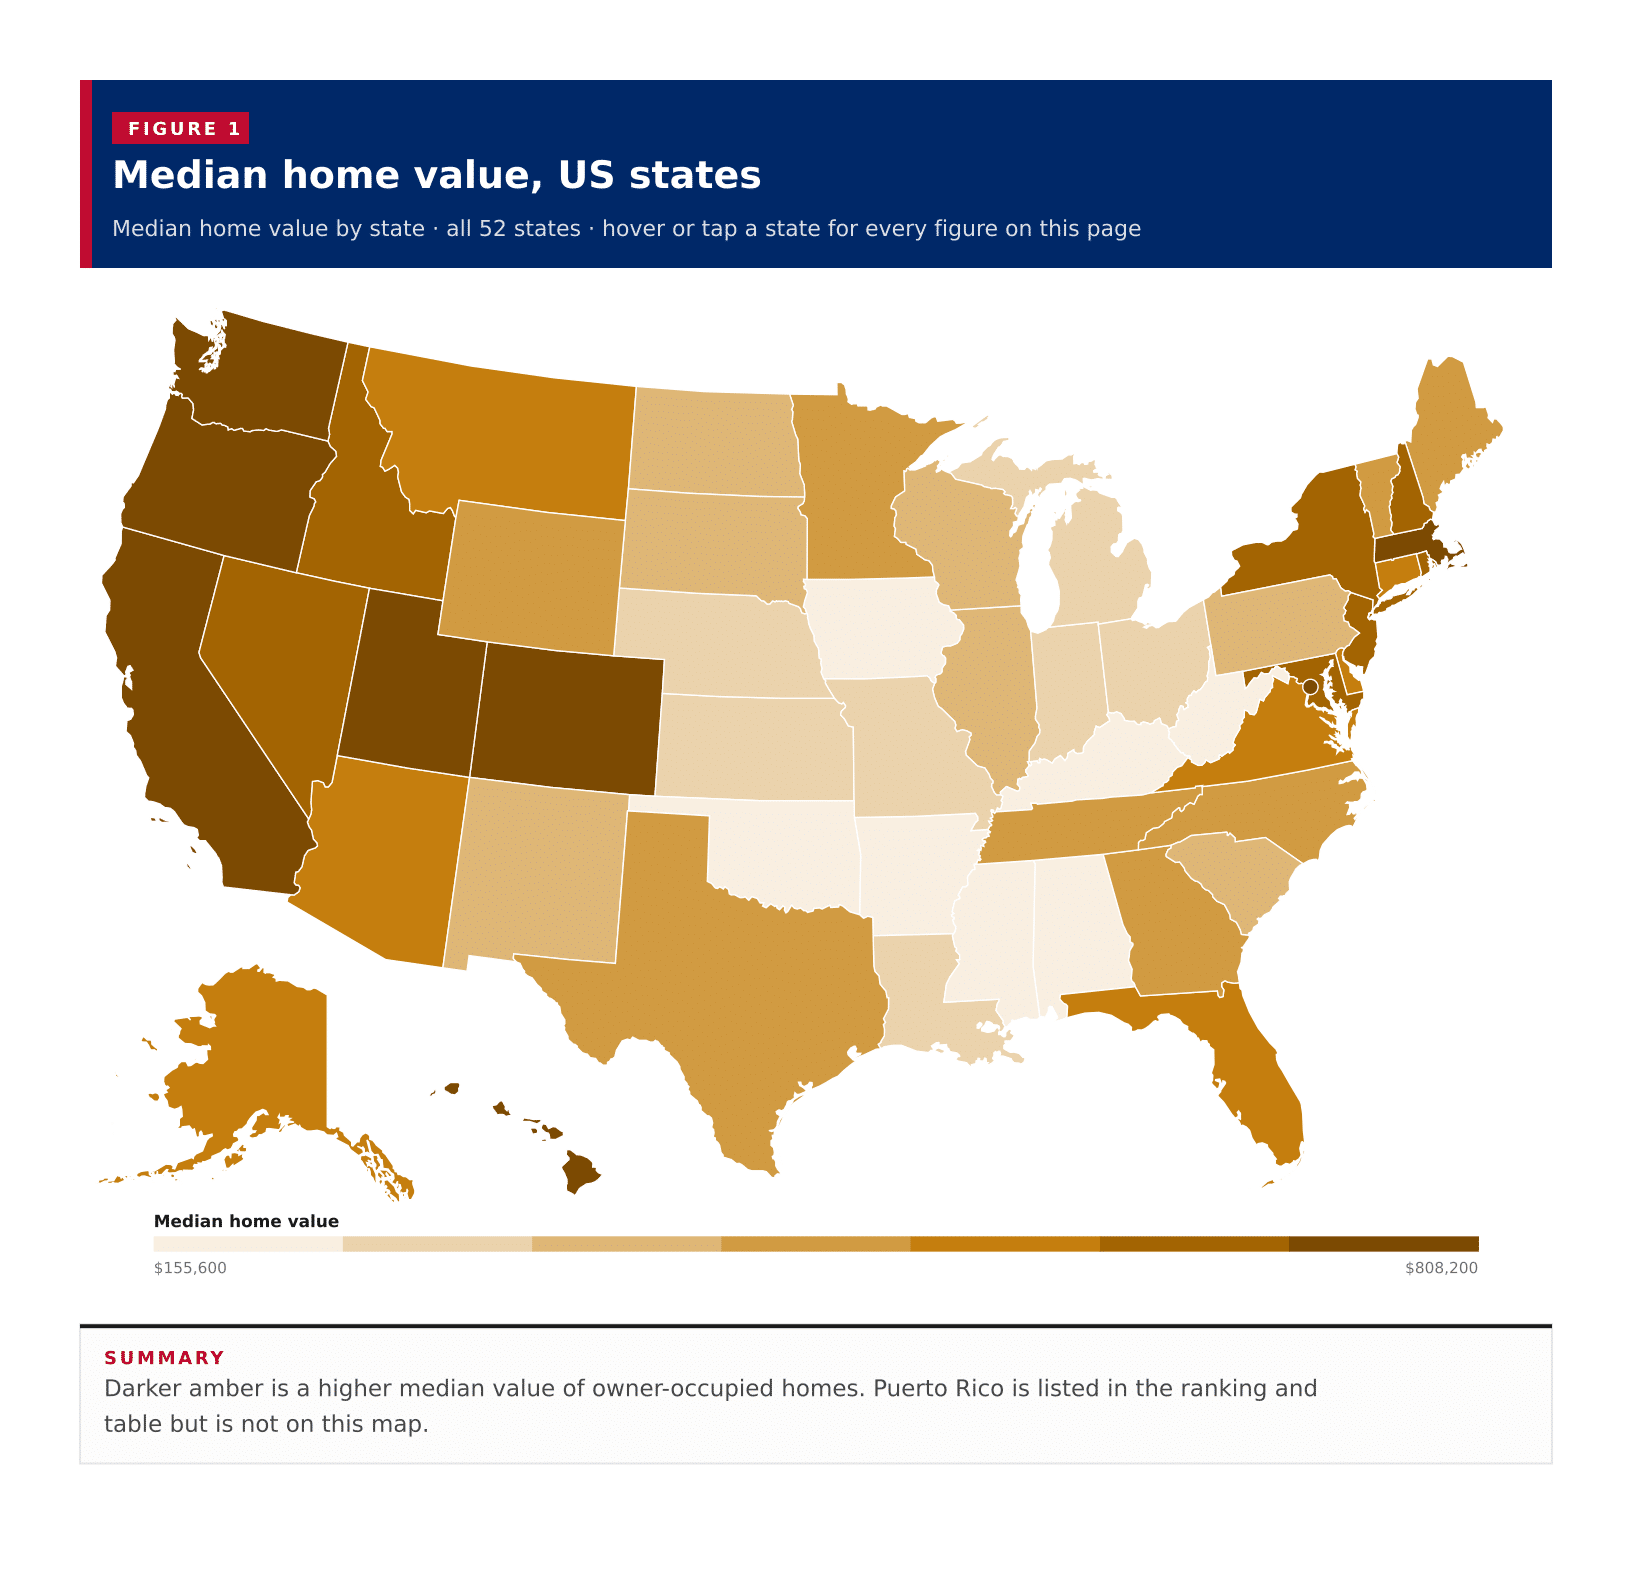
Median home value, US states

Median home value by state · all 52 states · hover or tap a state for every figure on this page

52 items
View100%
DownloadPDFImageCSV
StatesHawaii
Median home value, US statesDarker amber is a higher median value of owner-occupied homes. Puerto Rico is listed in the ranking and table but is not on this map.Alabama · Median home value: $195,100 · Margin of error: $1,110Alaska · Median home value: $333,300 · Margin of error: $3,665Arizona · Median home value: $358,900 · Margin of error: $1,200Arkansas · Median home value: $175,300 · Margin of error: $1,508California · Median home value: $695,400 · Margin of error: $1,030Colorado · Median home value: $502,200 · Margin of error: $2,298Connecticut · Median home value: $343,200 · Margin of error: $1,807Delaware · Median home value: $326,800 · Margin of error: $3,051Florida · Median home value: $325,000 · Margin of error: $895Georgia · Median home value: $272,900 · Margin of error: $1,058Hawaii · Median home value: $808,200 · Margin of error: $6,690Idaho · Median home value: $376,000 · Margin of error: $2,962Illinois · Median home value: $250,500 · Margin of error: $863Indiana · Median home value: $201,600 · Margin of error: $922Iowa · Median home value: $195,900 · Margin of error: $929Kansas · Median home value: $203,400 · Margin of error: $1,329Kentucky · Median home value: $192,300 · Margin of error: $1,018Louisiana · Median home value: $208,700 · Margin of error: $1,365Maine · Median home value: $266,400 · Margin of error: $2,109Maryland · Median home value: $397,700 · Margin of error: $1,433Massachusetts · Median home value: $525,800 · Margin of error: $2,244Michigan · Median home value: $217,600 · Margin of error: $692Minnesota · Median home value: $305,500 · Margin of error: $890Mississippi · Median home value: $161,400 · Margin of error: $1,296Missouri · Median home value: $215,600 · Margin of error: $942Montana · Median home value: $338,100 · Margin of error: $3,741Nebraska · Median home value: $223,800 · Margin of error: $1,268Nevada · Median home value: $406,100 · Margin of error: $2,207New Hampshire · Median home value: $367,200 · Margin of error: $2,362New Jersey · Median home value: $427,600 · Margin of error: $1,335New Mexico · Median home value: $232,200 · Margin of error: $1,548New York · Median home value: $403,000 · Margin of error: $1,347North Carolina · Median home value: $259,400 · Margin of error: $931North Dakota · Median home value: $241,100 · Margin of error: $2,406Ohio · Median home value: $199,200 · Margin of error: $485Oklahoma · Median home value: $185,900 · Margin of error: $1,137Oregon · Median home value: $454,200 · Margin of error: $1,608Pennsylvania · Median home value: $240,500 · Margin of error: $622Rhode Island · Median home value: $368,800 · Margin of error: $2,560South Carolina · Median home value: $236,700 · Margin of error: $1,344South Dakota · Median home value: $236,800 · Margin of error: $1,986Tennessee · Median home value: $256,800 · Margin of error: $1,438Texas · Median home value: $260,400 · Margin of error: $738Utah · Median home value: $455,000 · Margin of error: $1,576Vermont · Median home value: $290,500 · Margin of error: $2,466Virginia · Median home value: $360,700 · Margin of error: $1,182Washington · Median home value: $519,800 · Margin of error: $2,550West Virginia · Median home value: $155,600 · Margin of error: $1,679Wisconsin · Median home value: $247,400 · Margin of error: $937Wyoming · Median home value: $285,100 · Margin of error: $3,775District of Columbia · Median home value: $724,600 · Margin of error: $9,892District of Columbia · Median home value: $724,600 · Margin of error: $9,892Median home value$155,600$808,200
Summary

Darker amber is a higher median value of owner-occupied homes. Puerto Rico is listed in the ranking and table but is not on this map.

A typical published area has a median home value of $269,650, the midpoint of the 50 states, the District of Columbia and Puerto Rico on the 2023 ACS five-year estimates. Hawaii leads at $808,200, followed by the District of Columbia at $724,600 and California at $695,400. Six areas clear $500,000. West Virginia is the lowest of the 50 states at $155,600. Puerto Rico, which this table also returns, sits lower at $124,600. Hawaii is $652,600 above West Virginia and $683,600 above Puerto Rico. These are medians for owner-occupied homes in each area in 2023 dollars, not a national average of sale prices.

In short

$269,650typical published areathe middle of the ranked list, not a US median
$808,200Hawaiihighest median home value
$155,600West Virginialowest of the 50 states
$124,600Puerto Ricolowest figure the Census published
6areas at or above $500,000Hawaii, District of Columbia, California, Massachusetts, Washington and Colorado
Figure 1

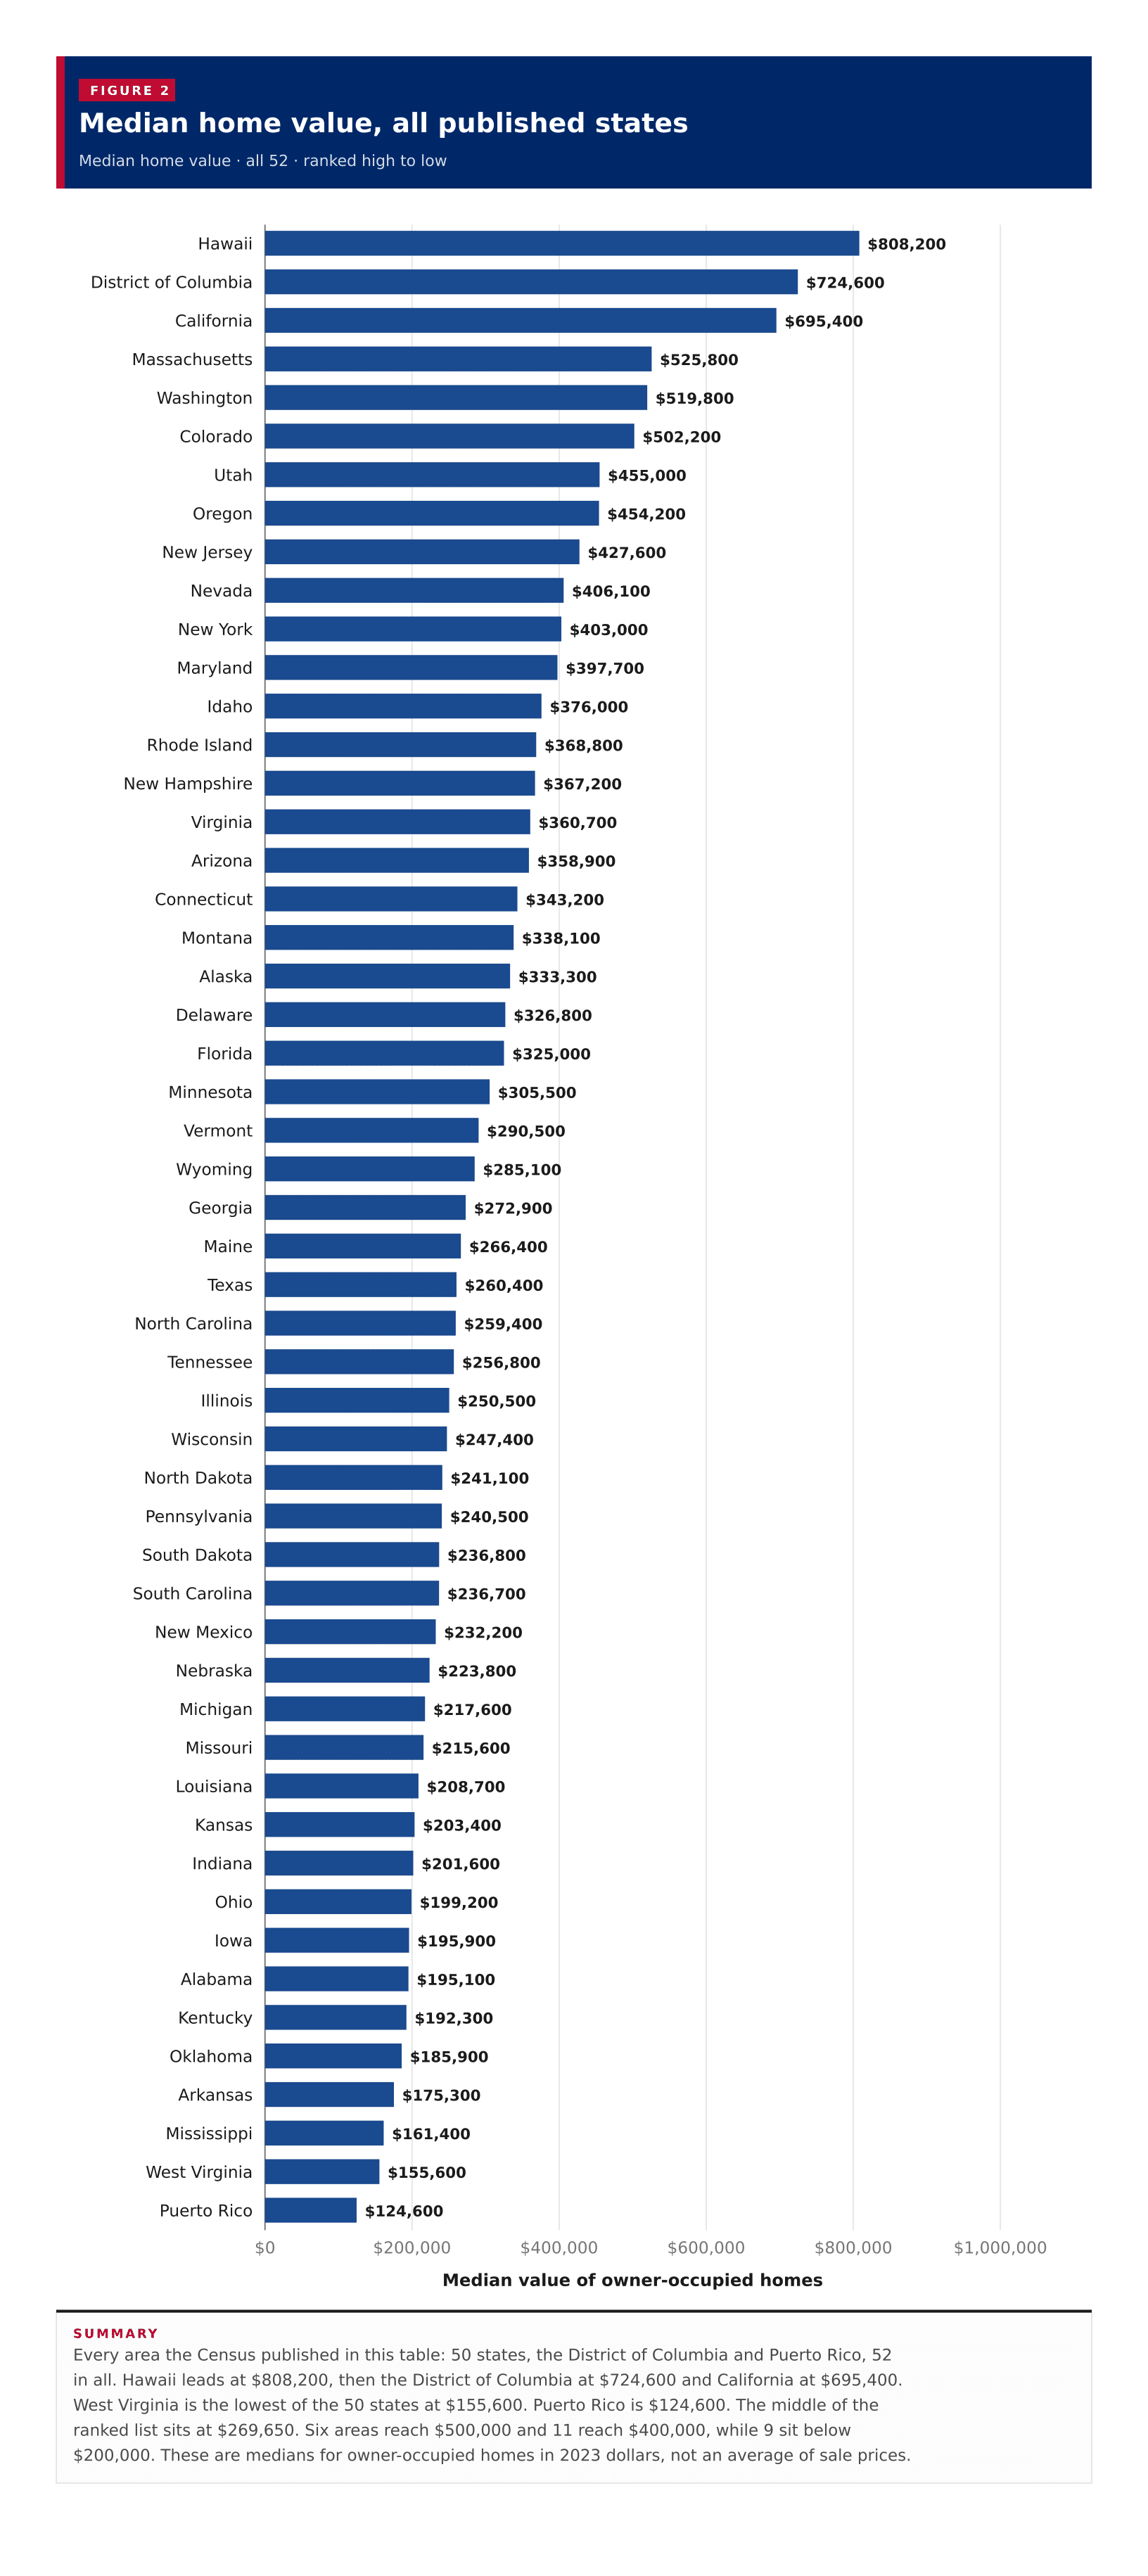
Median home value, all published states

Median home value · all 52 · ranked high to low

52 items
View100%
DownloadPDFImageCSV
Median home value, all published statesEvery area the Census published in this table: 50 states, the District of Columbia and Puerto Rico, 52 in all. Hawaii leads at $808,200, then the District of Columbia at $724,600 and California at $695,400. West Virginia is the lowest of the 50 states at $155,600. Puerto Rico is $124,600. The middle of the ranked list sits at $269,650. Six areas reach $500,000 and 11 reach $400,000, while 9 sit below $200,000. These are medians for owner-occupied homes in 2023 dollars, not an average of sale prices.$0$200,000$400,000$600,000$800,000$1,000,000Median value of owner-occupied homes$808,200Hawaii$724,600District of Columbia$695,400California$525,800Massachusetts$519,800Washington$502,200Colorado$455,000Utah$454,200Oregon$427,600New Jersey$406,100Nevada$403,000New York$397,700Maryland$376,000Idaho$368,800Rhode Island$367,200New Hampshire$360,700Virginia$358,900Arizona$343,200Connecticut$338,100Montana$333,300Alaska$326,800Delaware$325,000Florida$305,500Minnesota$290,500Vermont$285,100Wyoming$272,900Georgia$266,400Maine$260,400Texas$259,400North Carolina$256,800Tennessee$250,500Illinois$247,400Wisconsin$241,100North Dakota$240,500Pennsylvania$236,800South Dakota$236,700South Carolina$232,200New Mexico$223,800Nebraska$217,600Michigan$215,600Missouri$208,700Louisiana$203,400Kansas$201,600Indiana$199,200Ohio$195,900Iowa$195,100Alabama$192,300Kentucky$185,900Oklahoma$175,300Arkansas$161,400Mississippi$155,600West Virginia$124,600Puerto Rico
Summary

Every area the Census published in this table: 50 states, the District of Columbia and Puerto Rico, 52 in all. Hawaii leads at $808,200, then the District of Columbia at $724,600 and California at $695,400. West Virginia is the lowest of the 50 states at $155,600. Puerto Rico is $124,600. The middle of the ranked list sits at $269,650. Six areas reach $500,000 and 11 reach $400,000, while 9 sit below $200,000. These are medians for owner-occupied homes in 2023 dollars, not an average of sale prices.

Table 1

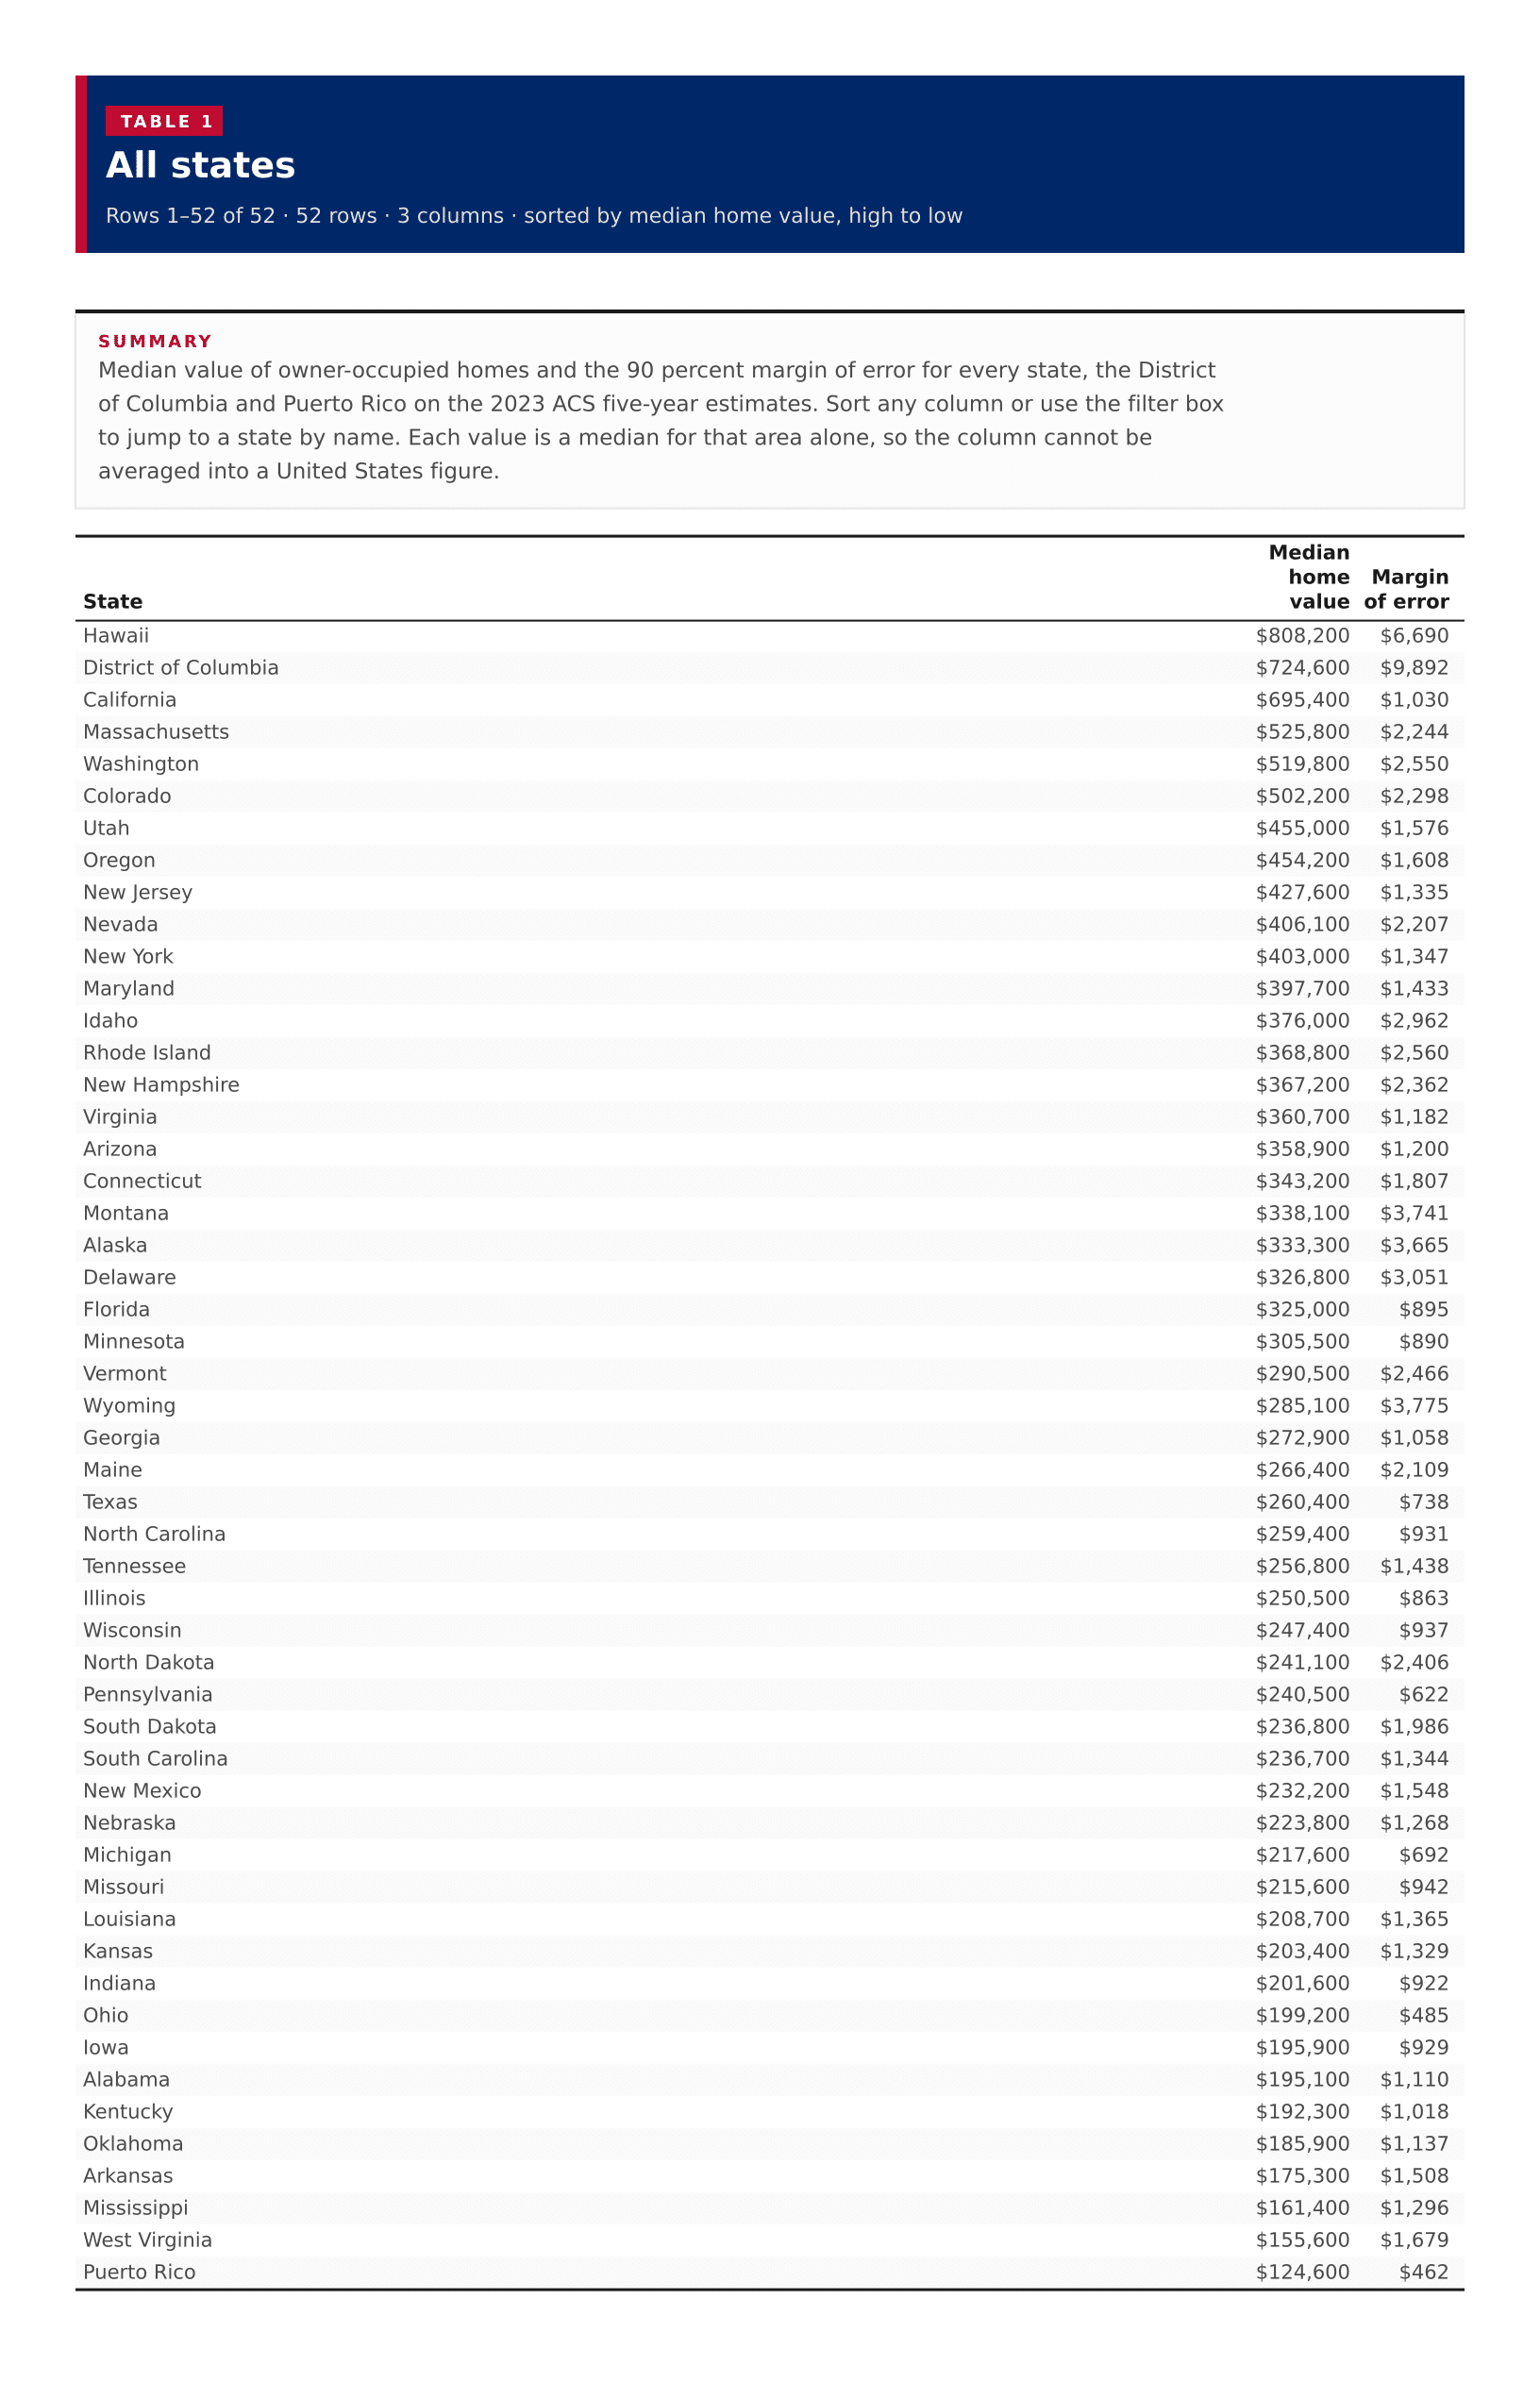
All states

52 rows · 3 columns · sorted by median home value, high to low

52 rows
View100%
DownloadPDFImageCSV
Summary

Median value of owner-occupied homes and the 90 percent margin of error for every state, the District of Columbia and Puerto Rico on the 2023 ACS five-year estimates. Sort any column or use the filter box to jump to a state by name. Each value is a median for that area alone, so the column cannot be averaged into a United States figure.

All states
??
Hawaii$808,200$6,690
District of Columbia$724,600$9,892
California$695,400$1,030
Massachusetts$525,800$2,244
Washington$519,800$2,550
Colorado$502,200$2,298
Utah$455,000$1,576
Oregon$454,200$1,608
New Jersey$427,600$1,335
Nevada$406,100$2,207
New York$403,000$1,347
Maryland$397,700$1,433
Idaho$376,000$2,962
Rhode Island$368,800$2,560
New Hampshire$367,200$2,362
Virginia$360,700$1,182
Arizona$358,900$1,200
Connecticut$343,200$1,807
Montana$338,100$3,741
Alaska$333,300$3,665
Delaware$326,800$3,051
Florida$325,000$895
Minnesota$305,500$890
Vermont$290,500$2,466
Wyoming$285,100$3,775
Georgia$272,900$1,058
Maine$266,400$2,109
Texas$260,400$738
North Carolina$259,400$931
Tennessee$256,800$1,438
Illinois$250,500$863
Wisconsin$247,400$937
North Dakota$241,100$2,406
Pennsylvania$240,500$622
South Dakota$236,800$1,986
South Carolina$236,700$1,344
New Mexico$232,200$1,548
Nebraska$223,800$1,268
Michigan$217,600$692
Missouri$215,600$942
Louisiana$208,700$1,365
Kansas$203,400$1,329
Indiana$201,600$922
Ohio$199,200$485
Iowa$195,900$929
Alabama$195,100$1,110
Kentucky$192,300$1,018
Oklahoma$185,900$1,137
Arkansas$175,300$1,508
Mississippi$161,400$1,296
West Virginia$155,600$1,679
Puerto Rico$124,600$462

Image files

Download all

Figure 1

Median home value, US states

Figure 1: Median home value, US states
DownloadPDFImageCSV

Figure 2

Median home value, all published states

Figure 2: Median home value, all published states
DownloadPDFImageCSV

About this data

  • Median home value is the midpoint for owner-occupied housing units in that area, in 2023 dollars. It is not an average sale price and cannot be averaged across states to produce a national figure.
  • The Census published 50 states, the District of Columbia and Puerto Rico. None of the medians were suppressed, and no margin of error used an ACS controlled-estimate sentinel.
  • Alaska and Hawaii appear in the ranking and table; on the map they are shown in the usual inset positions.
  • Puerto Rico is included in the ranking and table but is not shaded on the continental state map.