Housing units by US state

Summary

Housing units, US states

Housing units by state · all 52 states · hover or tap a state for every figure on this page

52 items
View100%
DownloadPDFImageCSV
StatesCalifornia
Housing units, US statesDarker amber is more housing units. Puerto Rico is listed in the ranking and table but is not on this map.Alabama · Housing units: 2,316,192 · Margin of error: 430Alaska · Housing units: 327,610 · Margin of error: 431Arizona · Housing units: 3,142,443 · Margin of error: 466Arkansas · Housing units: 1,382,664 · Margin of error: 336California · Housing units: 14,532,683 · Margin of error: 1,118Colorado · Housing units: 2,545,124 · Margin of error: 462Connecticut · Housing units: 1,536,049 · Margin of error: 285Delaware · Housing units: 457,958 · Margin of error: 241Florida · Housing units: 10,082,356 · Margin of error: 678Georgia · Housing units: 4,483,873 · Margin of error: 944Hawaii · Housing units: 564,905 · Margin of error: 196Idaho · Housing units: 776,683 · Margin of error: 221Illinois · Housing units: 5,443,501 · Margin of error: 767Indiana · Housing units: 2,953,344 · Margin of error: 390Iowa · Housing units: 1,427,175 · Margin of error: 397Kansas · Housing units: 1,285,221 · Margin of error: 690Kentucky · Housing units: 2,010,655 · Margin of error: 372Louisiana · Housing units: 2,094,002 · Margin of error: 454Maine · Housing units: 746,552 · Margin of error: 254Maryland · Housing units: 2,545,532 · Margin of error: 484Massachusetts · Housing units: 3,014,657 · Margin of error: 502Michigan · Housing units: 4,599,683 · Margin of error: 956Minnesota · Housing units: 2,519,538 · Margin of error: 958Mississippi · Housing units: 1,332,811 · Margin of error: 2,317Missouri · Housing units: 2,809,501 · Margin of error: 603Montana · Housing units: 522,939 · Margin of error: 206Nebraska · Housing units: 855,631 · Margin of error: 245Nevada · Housing units: 1,307,338 · Margin of error: 360New Hampshire · Housing units: 644,253 · Margin of error: 255New Jersey · Housing units: 3,775,842 · Margin of error: 525New Mexico · Housing units: 949,524 · Margin of error: 264New York · Housing units: 8,539,536 · Margin of error: 1,410North Carolina · Housing units: 4,815,195 · Margin of error: 554North Dakota · Housing units: 374,866 · Margin of error: 238Ohio · Housing units: 5,271,573 · Margin of error: 770Oklahoma · Housing units: 1,763,036 · Margin of error: 1,066Oregon · Housing units: 1,838,631 · Margin of error: 399Pennsylvania · Housing units: 5,779,663 · Margin of error: 1,198Rhode Island · Housing units: 484,615 · Margin of error: 142South Carolina · Housing units: 2,401,638 · Margin of error: 448South Dakota · Housing units: 402,364 · Margin of error: 200Tennessee · Housing units: 3,095,472 · Margin of error: 769Texas · Housing units: 11,890,808 · Margin of error: 698Utah · Housing units: 1,193,082 · Margin of error: 271Vermont · Housing units: 337,072 · Margin of error: 133Virginia · Housing units: 3,654,784 · Margin of error: 946Washington · Housing units: 3,262,667 · Margin of error: 447West Virginia · Housing units: 859,653 · Margin of error: 241Wisconsin · Housing units: 2,750,750 · Margin of error: 1,389Wyoming · Housing units: 275,131 · Margin of error: 170District of Columbia · Housing units: 356,101 · Margin of error: 179District of Columbia · Housing units: 356,101 · Margin of error: 179Housing units275,13114,532,683
Summary

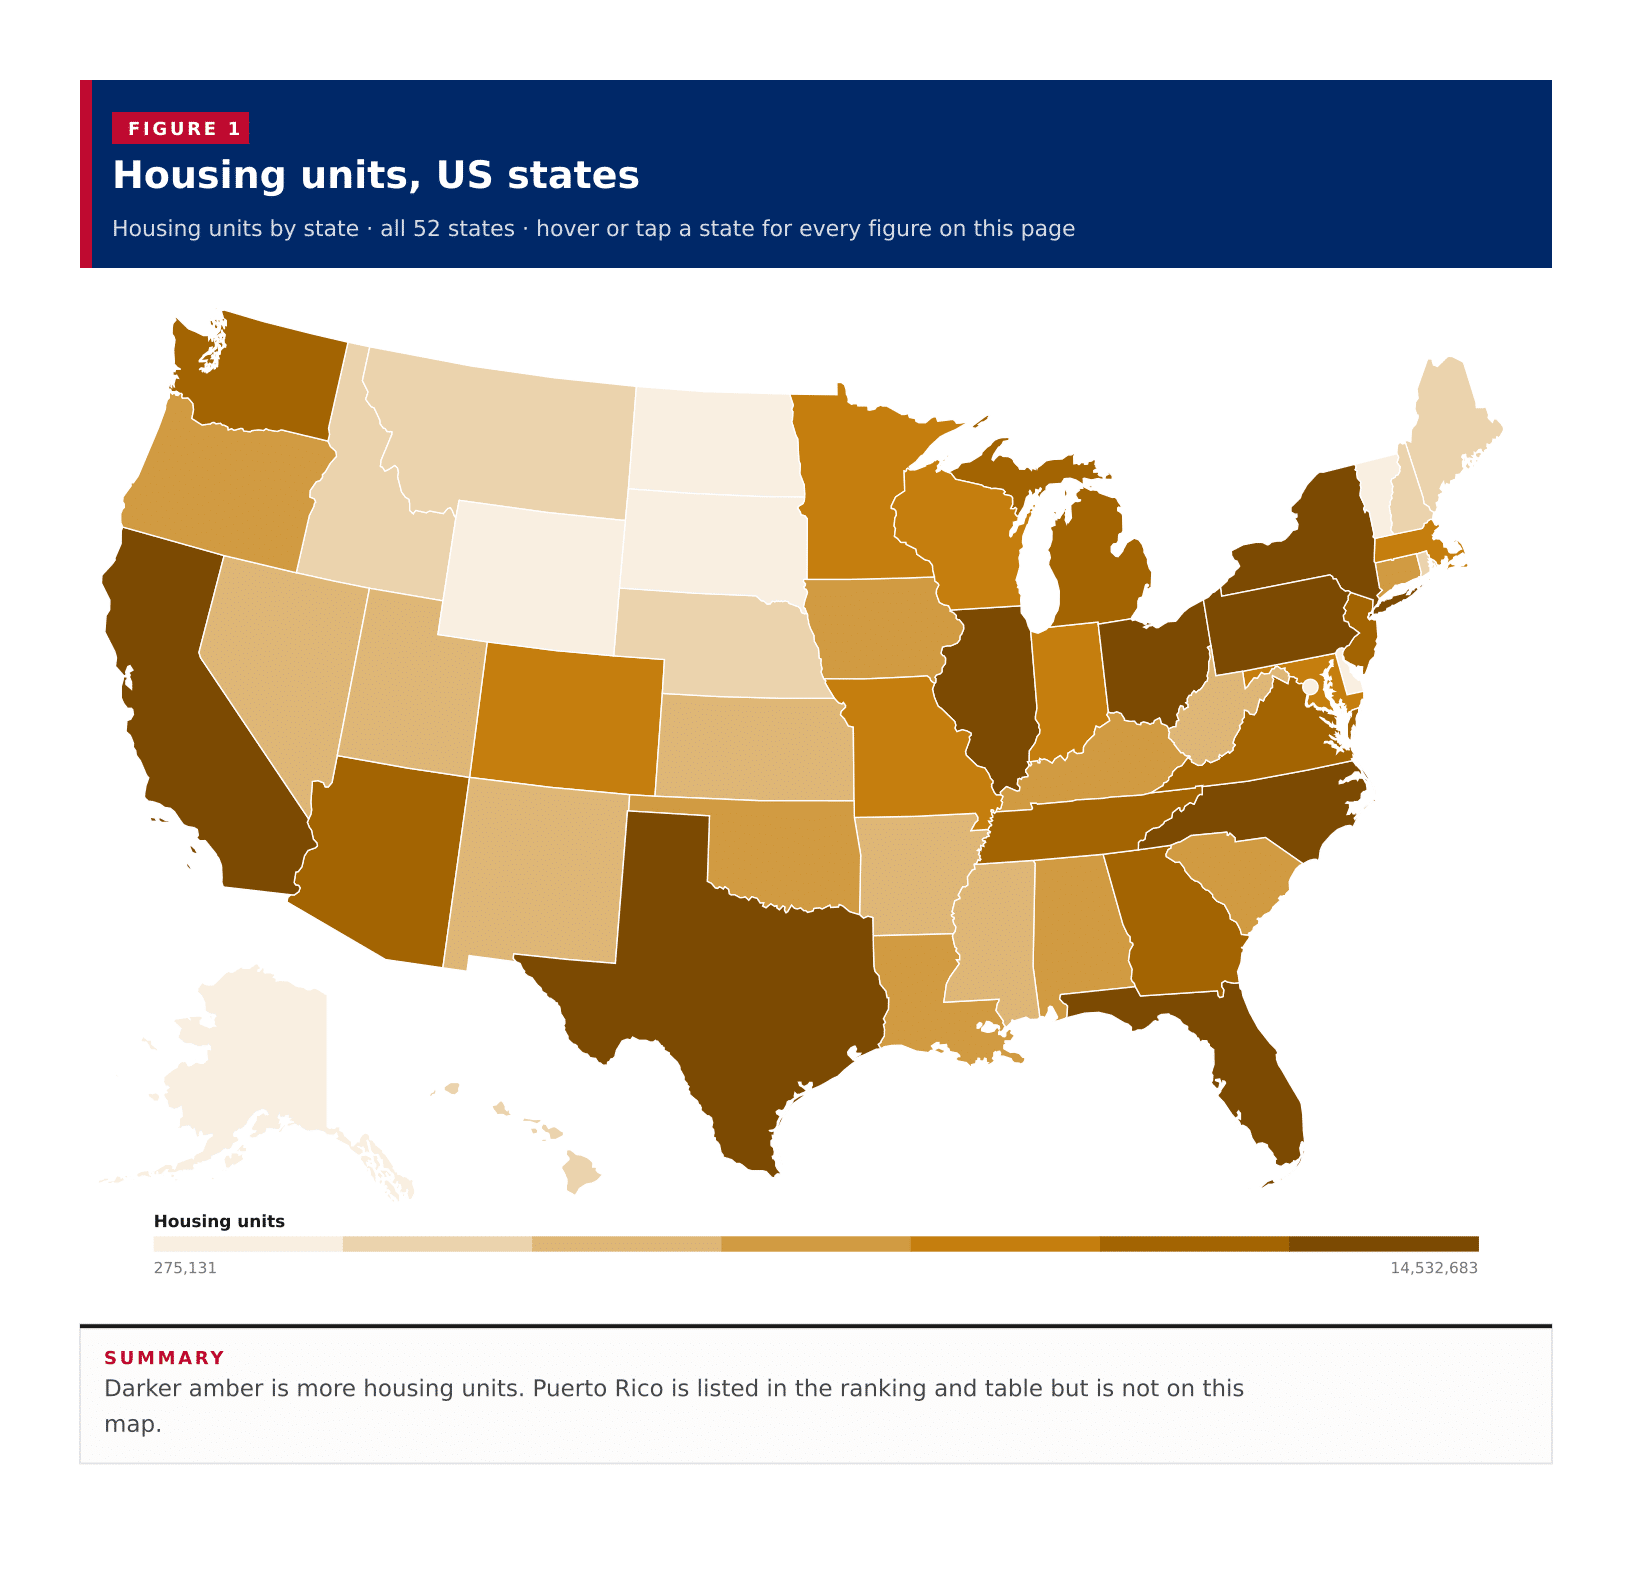
Darker amber is more housing units. Puerto Rico is listed in the ranking and table but is not on this map.

California has the most housing units of any published area on the 2023 ACS five-year estimates, at 14,532,683, ahead of Texas at 11,890,808 and Florida at 10,082,356. Wyoming has the fewest, at 275,131. The middle published area sits at about 1,924,643 housing units. Seven areas have at least 5 million units, and 36 clear 1 million. These are each area's own housing-unit count, not a national total built by adding the states together.

In short

14,532,683Californiamost housing units
275,131Wyomingfewest housing units
1,924,643typical published areathe middle area, not an average
7areas at or above 5 millionCalifornia, Texas, Florida, New York, Pennsylvania, Illinois and Ohio
11,890,808Texassecond-most housing units
Figure 1

Housing units, all published states

Housing units · all 52 · ranked high to low

52 items
View100%
DownloadPDFImageCSV
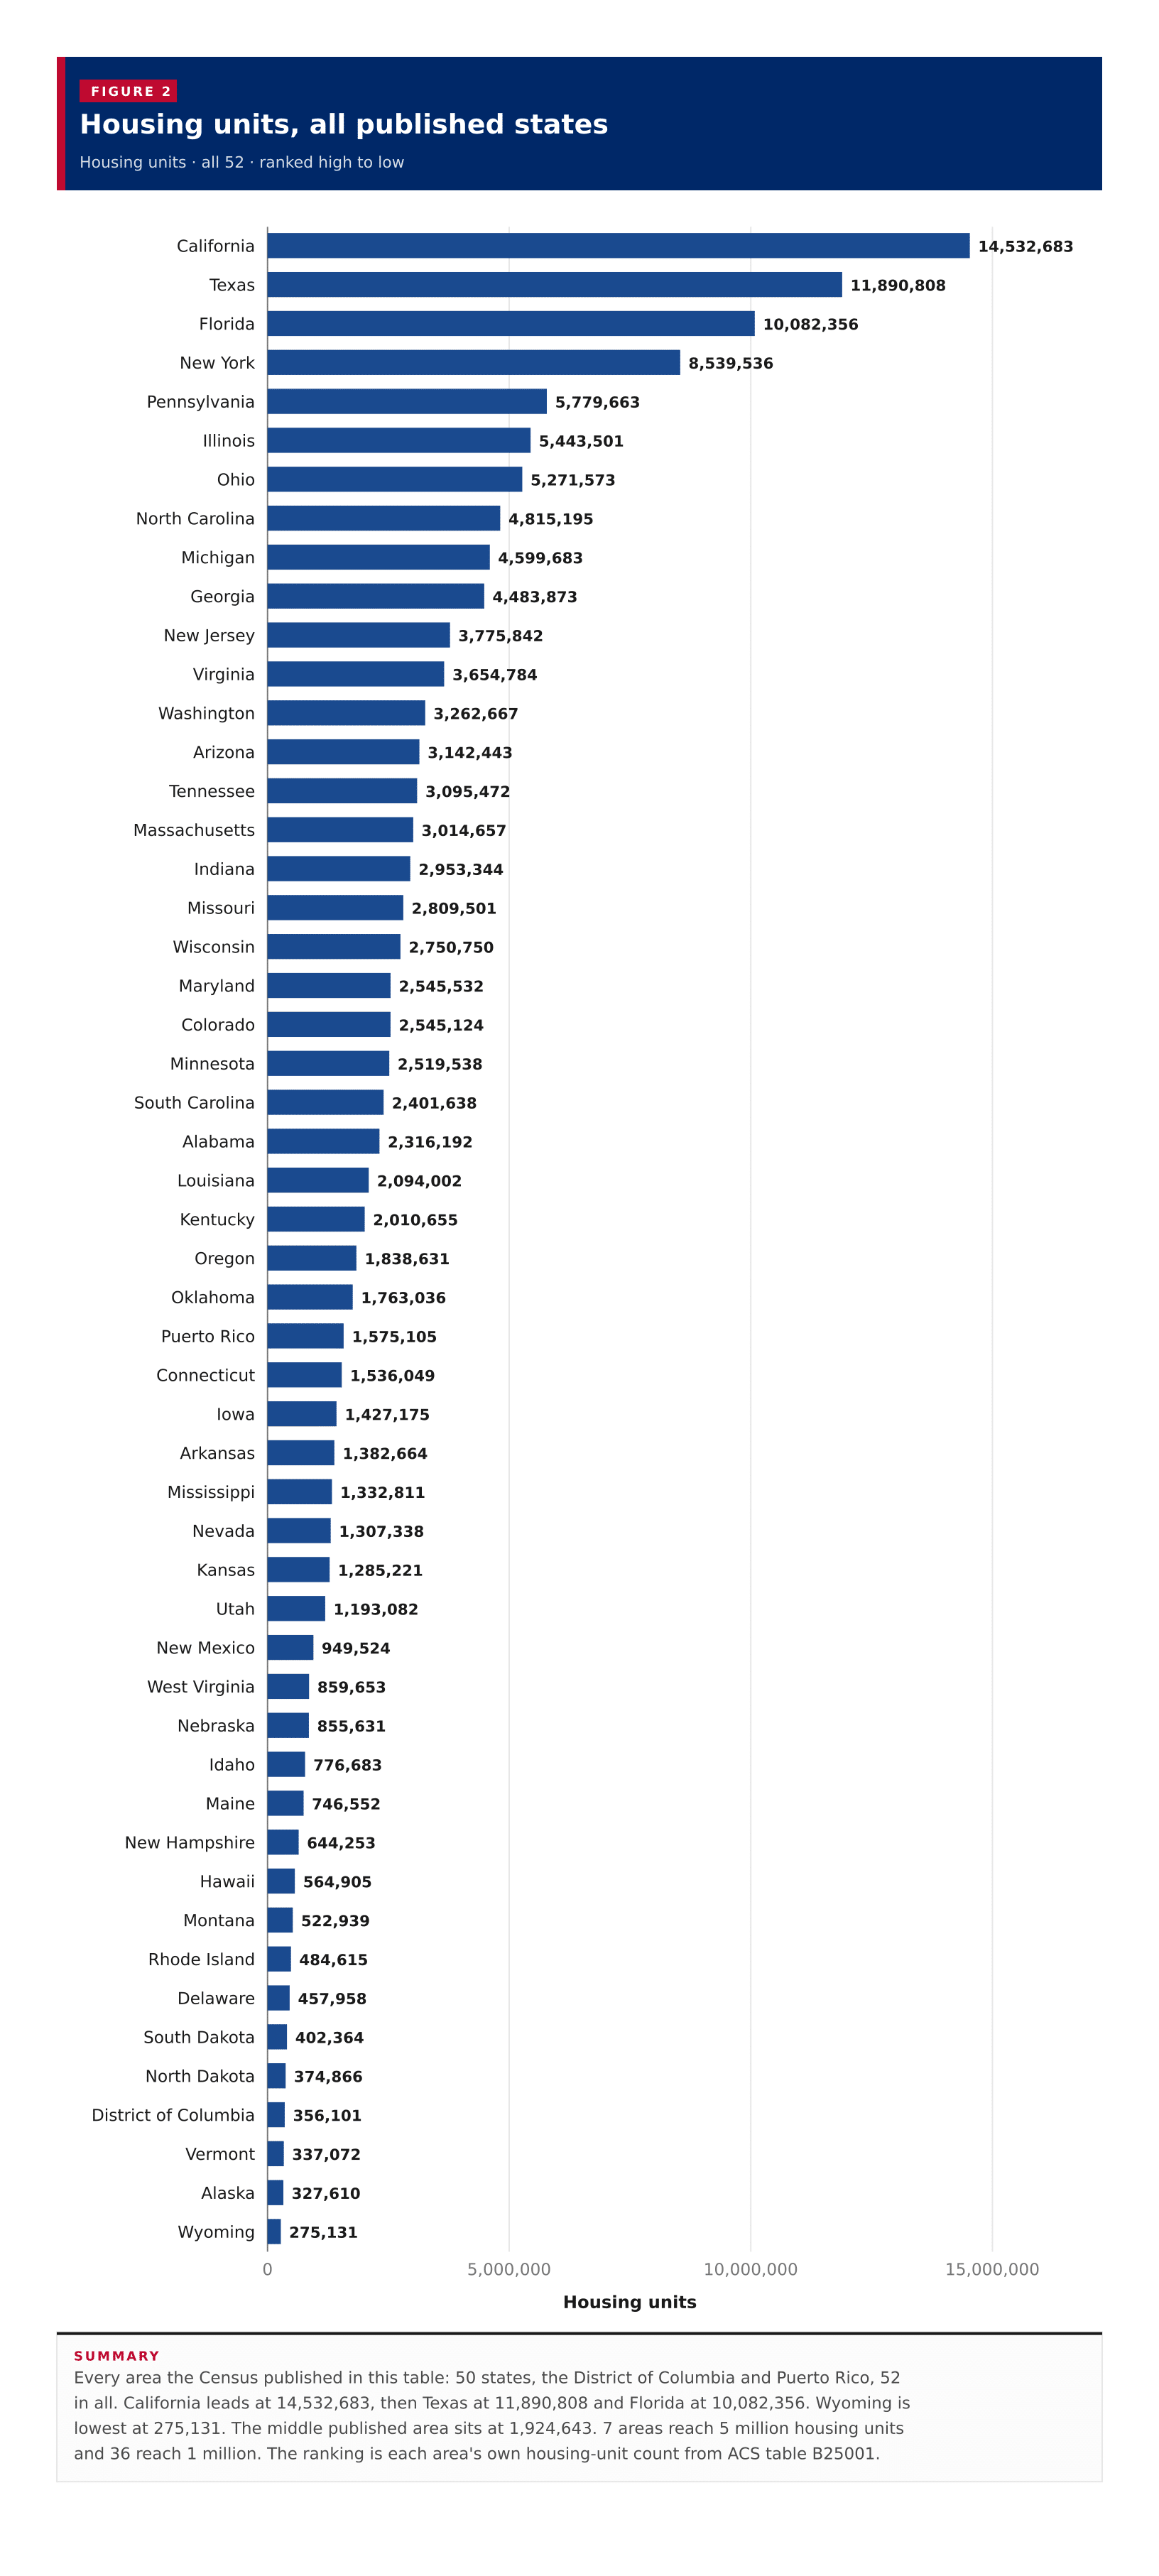
Housing units, all published statesEvery area the Census published in this table: 50 states, the District of Columbia and Puerto Rico, 52 in all. California leads at 14,532,683, then Texas at 11,890,808 and Florida at 10,082,356. Wyoming is lowest at 275,131. The middle published area sits at 1,924,643. 7 areas reach 5 million housing units and 36 reach 1 million. The ranking is each area's own housing-unit count from ACS table B25001.05,000,00010,000,00015,000,000Housing units14,532,683California11,890,808Texas10,082,356Florida8,539,536New York5,779,663Pennsylvania5,443,501Illinois5,271,573Ohio4,815,195North Carolina4,599,683Michigan4,483,873Georgia3,775,842New Jersey3,654,784Virginia3,262,667Washington3,142,443Arizona3,095,472Tennessee3,014,657Massachusetts2,953,344Indiana2,809,501Missouri2,750,750Wisconsin2,545,532Maryland2,545,124Colorado2,519,538Minnesota2,401,638South Carolina2,316,192Alabama2,094,002Louisiana2,010,655Kentucky1,838,631Oregon1,763,036Oklahoma1,575,105Puerto Rico1,536,049Connecticut1,427,175Iowa1,382,664Arkansas1,332,811Mississippi1,307,338Nevada1,285,221Kansas1,193,082Utah949,524New Mexico859,653West Virginia855,631Nebraska776,683Idaho746,552Maine644,253New Hampshire564,905Hawaii522,939Montana484,615Rhode Island457,958Delaware402,364South Dakota374,866North Dakota356,101District of Columbia337,072Vermont327,610Alaska275,131Wyoming
Summary

Every area the Census published in this table: 50 states, the District of Columbia and Puerto Rico, 52 in all. California leads at 14,532,683, then Texas at 11,890,808 and Florida at 10,082,356. Wyoming is lowest at 275,131. The middle published area sits at 1,924,643. 7 areas reach 5 million housing units and 36 reach 1 million. The ranking is each area's own housing-unit count from ACS table B25001.

Table 1

All states

52 rows · 3 columns · sorted by housing units, high to low

52 rows
View100%
DownloadPDFImageCSV
Summary

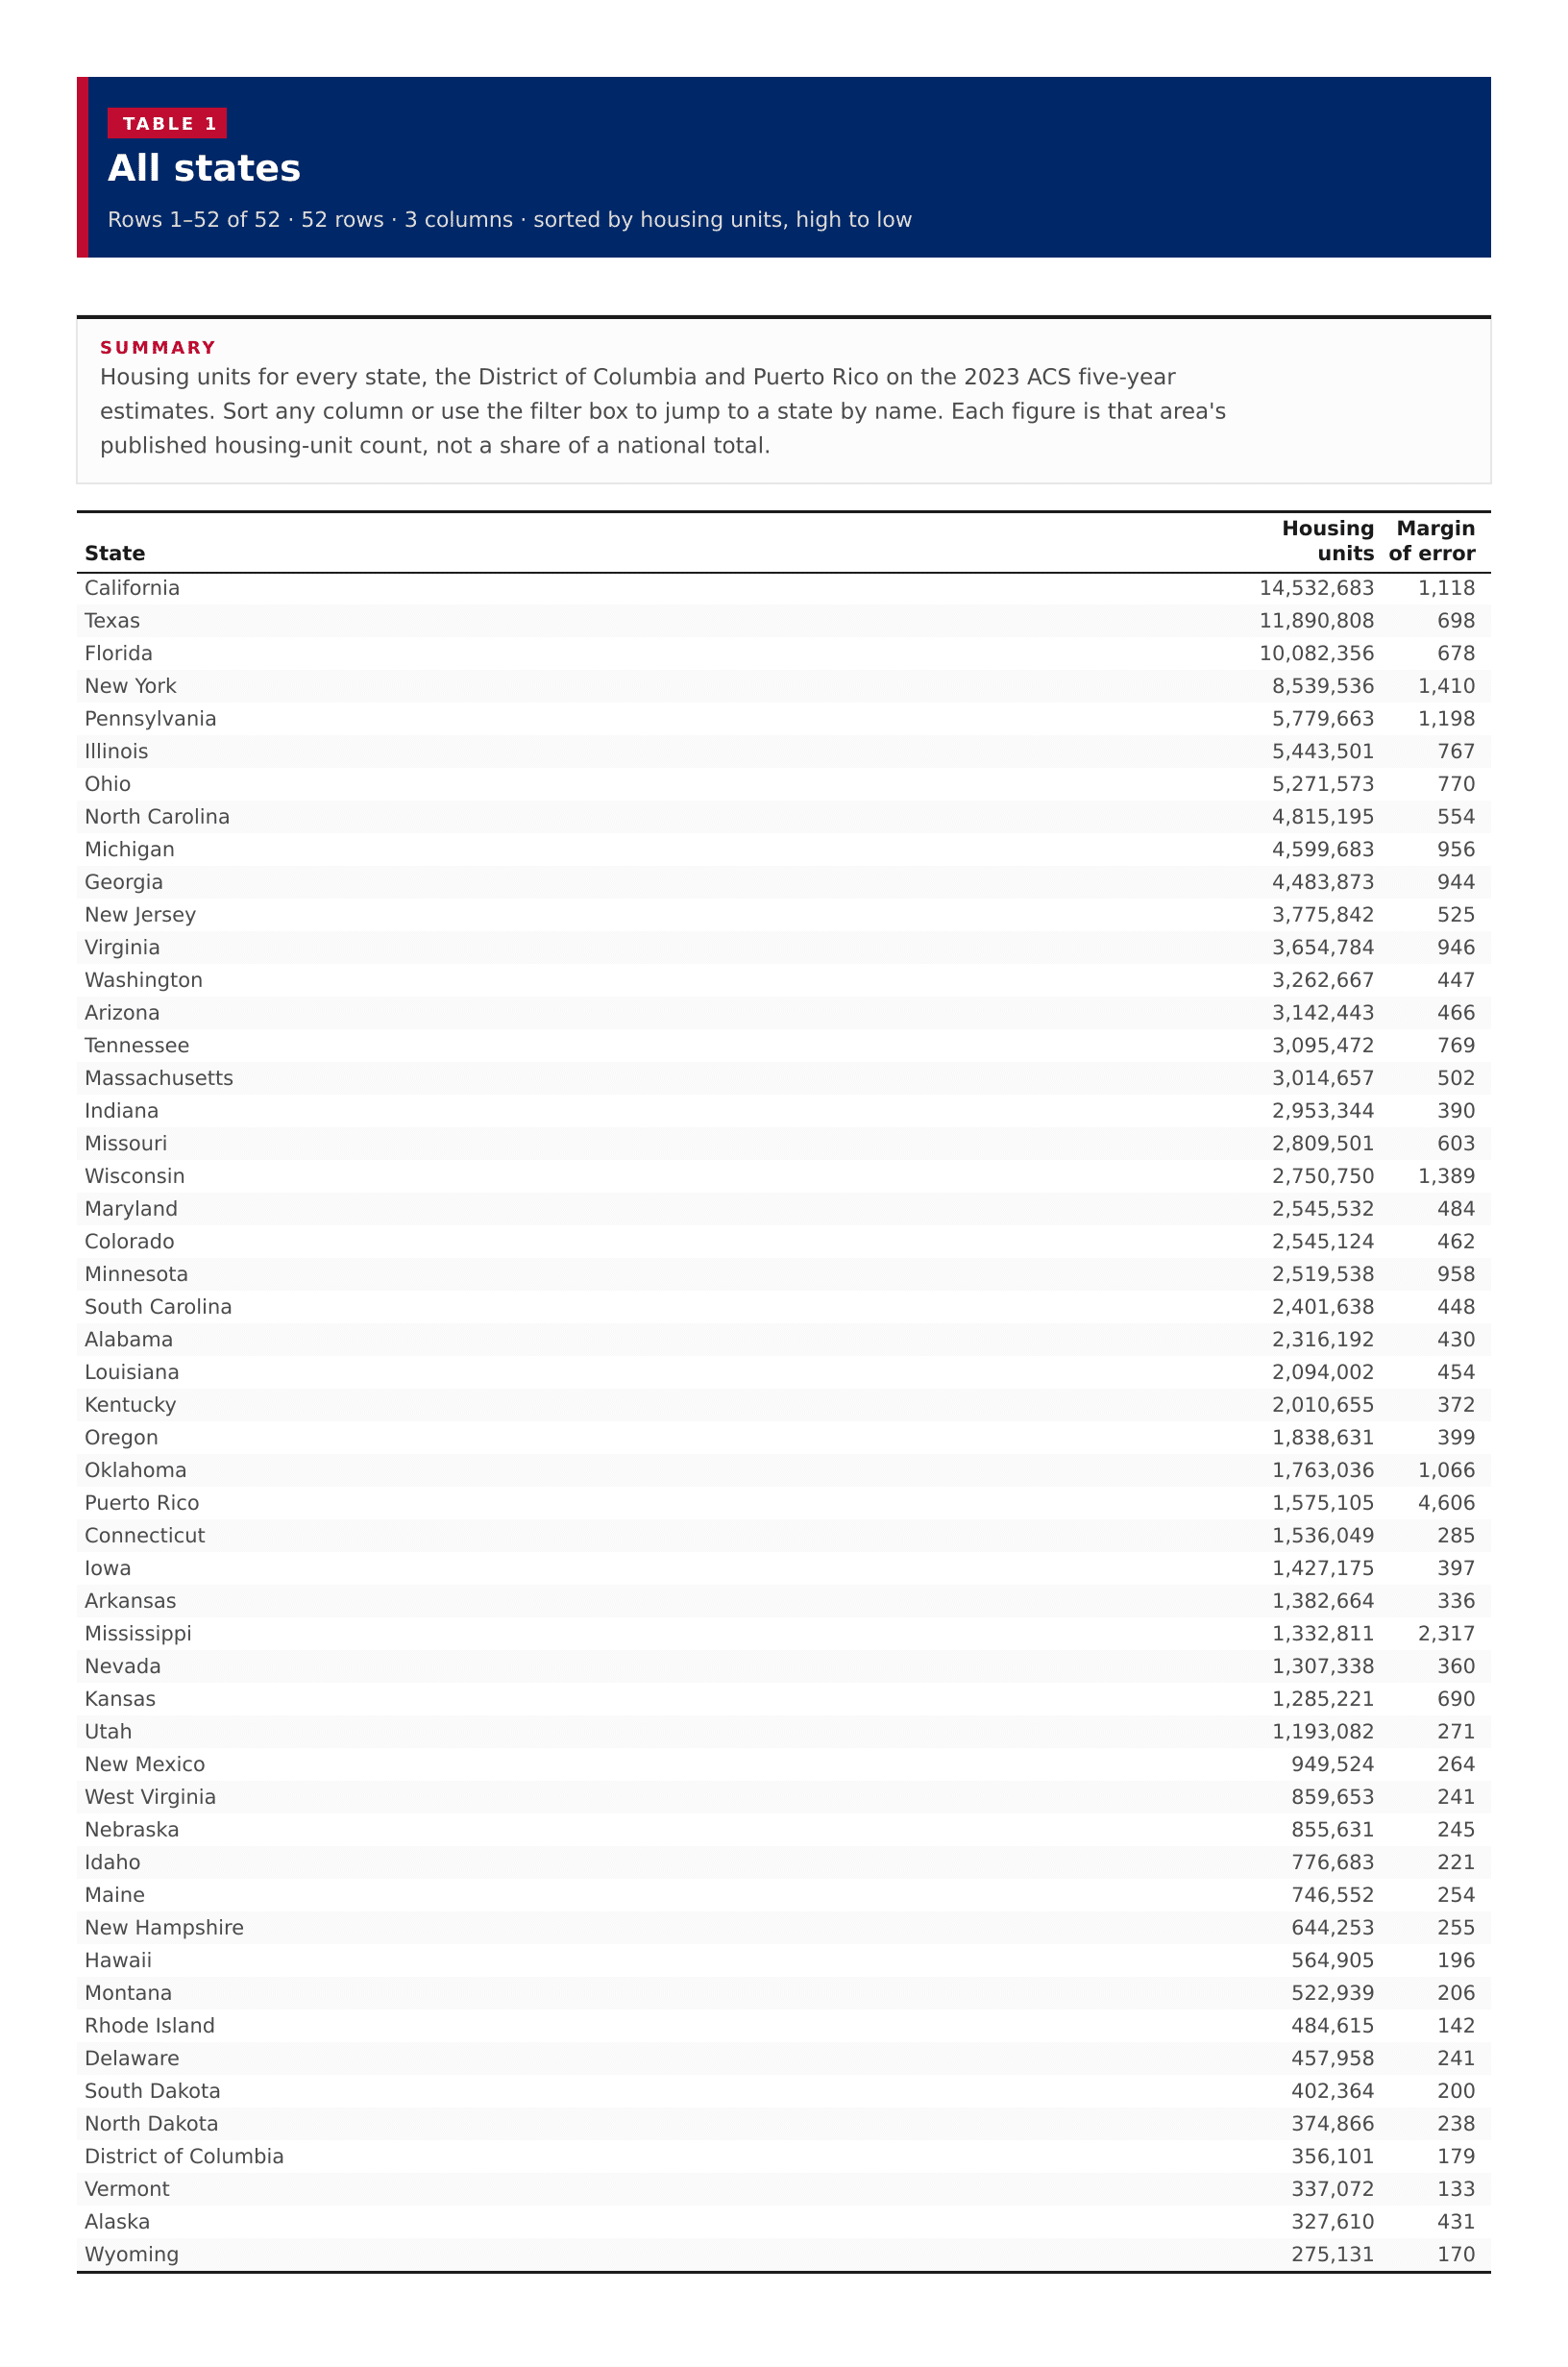
Housing units for every state, the District of Columbia and Puerto Rico on the 2023 ACS five-year estimates. Sort any column or use the filter box to jump to a state by name. Each figure is that area's published housing-unit count, not a share of a national total.

All states
??
California14,532,6831,118
Texas11,890,808698
Florida10,082,356678
New York8,539,5361,410
Pennsylvania5,779,6631,198
Illinois5,443,501767
Ohio5,271,573770
North Carolina4,815,195554
Michigan4,599,683956
Georgia4,483,873944
New Jersey3,775,842525
Virginia3,654,784946
Washington3,262,667447
Arizona3,142,443466
Tennessee3,095,472769
Massachusetts3,014,657502
Indiana2,953,344390
Missouri2,809,501603
Wisconsin2,750,7501,389
Maryland2,545,532484
Colorado2,545,124462
Minnesota2,519,538958
South Carolina2,401,638448
Alabama2,316,192430
Louisiana2,094,002454
Kentucky2,010,655372
Oregon1,838,631399
Oklahoma1,763,0361,066
Puerto Rico1,575,1054,606
Connecticut1,536,049285
Iowa1,427,175397
Arkansas1,382,664336
Mississippi1,332,8112,317
Nevada1,307,338360
Kansas1,285,221690
Utah1,193,082271
New Mexico949,524264
West Virginia859,653241
Nebraska855,631245
Idaho776,683221
Maine746,552254
New Hampshire644,253255
Hawaii564,905196
Montana522,939206
Rhode Island484,615142
Delaware457,958241
South Dakota402,364200
North Dakota374,866238
District of Columbia356,101179
Vermont337,072133
Alaska327,610431
Wyoming275,131170

Image files

Download all

Figure 2

Housing units, all published states

Figure 2: Housing units, all published states
DownloadPDFImageCSV

About this data

  • Housing units count all residential units in an area, occupied or vacant, from ACS table B25001.
  • Each figure is that state, the District of Columbia or Puerto Rico alone. Do not add the published areas together and treat the sum as a Census national total; the Census publishes these as area estimates.
  • The Census published 50 states, the District of Columbia and Puerto Rico. None of the housing-unit estimates were suppressed, and every row has a published margin of error.
  • Alaska and Hawaii appear in the ranking and table; on the map they sit in the usual insets. Puerto Rico is in the ranking and table but is not shaded on the state map.

References

U.S. Census Bureau, 2023 American Community Survey 5-Year Estimates · retrieved 2026-09-27