Housing age by US state

Summary

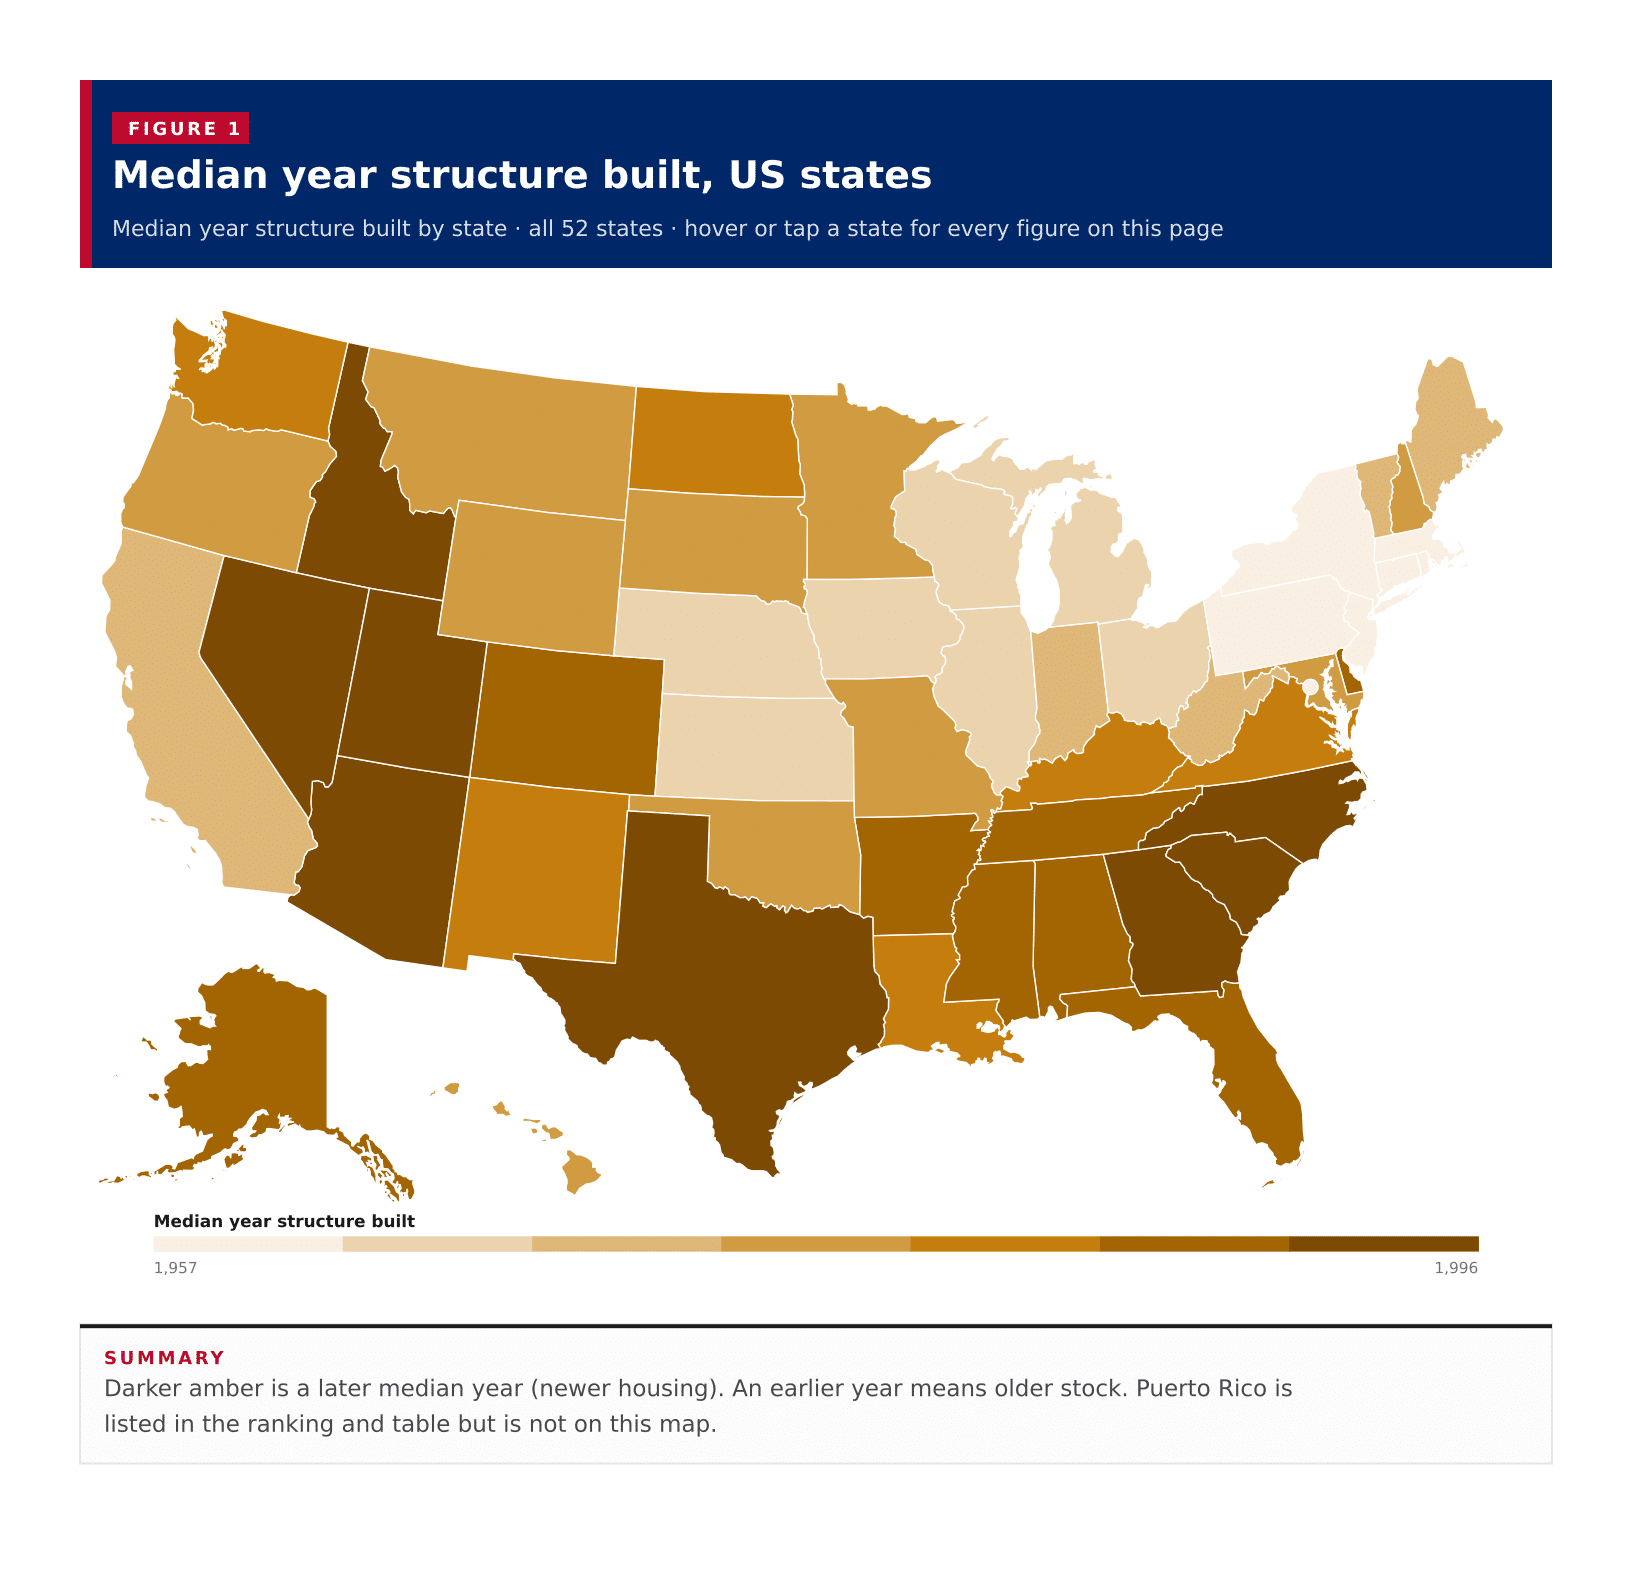
Median year structure built, US states

Median year structure built by state · all 52 states · hover or tap a state for every figure on this page

52 items
View100%
DownloadPDFImageCSV
StatesNevada
Median year structure built, US statesDarker amber is a later median year (newer housing). An earlier year means older stock. Puerto Rico is listed in the ranking and table but is not on this map.Alabama · Median year structure built: 1,985 · Margin of error: 1Alaska · Median year structure built: 1,985 · Margin of error: 1Arizona · Median year structure built: 1,992 · Margin of error: 1Arkansas · Median year structure built: 1,987 · Margin of error: 1California · Median year structure built: 1,976 · Margin of error: 1Colorado · Median year structure built: 1,987 · Margin of error: 1Connecticut · Median year structure built: 1,967 · Margin of error: 1Delaware · Median year structure built: 1,986 · Margin of error: 1Florida · Median year structure built: 1,988 · Margin of error: 1Georgia · Median year structure built: 1,991 · Margin of error: 1Hawaii · Median year structure built: 1,979 · Margin of error: 1Idaho · Median year structure built: 1,990 · Margin of error: 1Illinois · Median year structure built: 1,970 · Margin of error: 1Indiana · Median year structure built: 1,976 · Margin of error: 1Iowa · Median year structure built: 1,971 · Margin of error: 1Kansas · Median year structure built: 1,975 · Margin of error: 1Kentucky · Median year structure built: 1,982 · Margin of error: 1Louisiana · Median year structure built: 1,982 · Margin of error: 1Maine · Median year structure built: 1,976 · Margin of error: 1Maryland · Median year structure built: 1,979 · Margin of error: 1Massachusetts · Median year structure built: 1,963 · Margin of error: 1Michigan · Median year structure built: 1,972 · Margin of error: 1Minnesota · Median year structure built: 1,978 · Margin of error: 1Mississippi · Median year structure built: 1,986 · Margin of error: 2Missouri · Median year structure built: 1,978 · Margin of error: 1Montana · Median year structure built: 1,980 · Margin of error: 1Nebraska · Median year structure built: 1,975 · Margin of error: 1Nevada · Median year structure built: 1,996 · Margin of error: 1New Hampshire · Median year structure built: 1,978 · Margin of error: 2New Jersey · Median year structure built: 1,969 · Margin of error: 1New Mexico · Median year structure built: 1,984 · Margin of error: 1New York · Median year structure built: 1,958 · Margin of error: 1North Carolina · Median year structure built: 1,990 · Margin of error: 1North Dakota · Median year structure built: 1,981 · Margin of error: 1Ohio · Median year structure built: 1,970 · Margin of error: 1Oklahoma · Median year structure built: 1,980 · Margin of error: 1Oregon · Median year structure built: 1,980 · Margin of error: 1Pennsylvania · Median year structure built: 1,965 · Margin of error: 1Rhode Island · Median year structure built: 1,961 · Margin of error: 1South Carolina · Median year structure built: 1,991 · Margin of error: 1South Dakota · Median year structure built: 1,979 · Margin of error: 1Tennessee · Median year structure built: 1,986 · Margin of error: 1Texas · Median year structure built: 1,990 · Margin of error: 1Utah · Median year structure built: 1,991 · Margin of error: 1Vermont · Median year structure built: 1,976 · Margin of error: 1Virginia · Median year structure built: 1,984 · Margin of error: 1Washington · Median year structure built: 1,984 · Margin of error: 2West Virginia · Median year structure built: 1,976 · Margin of error: 1Wisconsin · Median year structure built: 1,975 · Margin of error: 1Wyoming · Median year structure built: 1,980 · Margin of error: 1District of Columbia · Median year structure built: 1,957 · Margin of error: 1District of Columbia · Median year structure built: 1,957 · Margin of error: 1Median year structure built1,9571,996
Summary

Darker amber is a later median year (newer housing). An earlier year means older stock. Puerto Rico is listed in the ranking and table but is not on this map.

A typical published area has housing with a median year built of 1980, the midpoint of the 50 states, the District of Columbia and Puerto Rico on the 2023 ACS five-year estimates. Nevada has the newest stock at 1996, while the District of Columbia has the oldest at 1957. Among the 50 states, New York is oldest at 1958. 8 areas have a median year of 1990 or later, and 7 sit before 1970. An earlier median year means older housing. These are medians for each area alone, not a United States median year built.

In short

1980typical published areamidpoint of the 52 area medians, not a US median
1996Nevadanewest median year structure built
1957District of Columbiaoldest figure the Census published
1958New Yorkoldest of the 50 states
8areas at or after 1990Nevada, Arizona, Georgia, South Carolina, Utah, Idaho, North Carolina and Texas
Figure 1

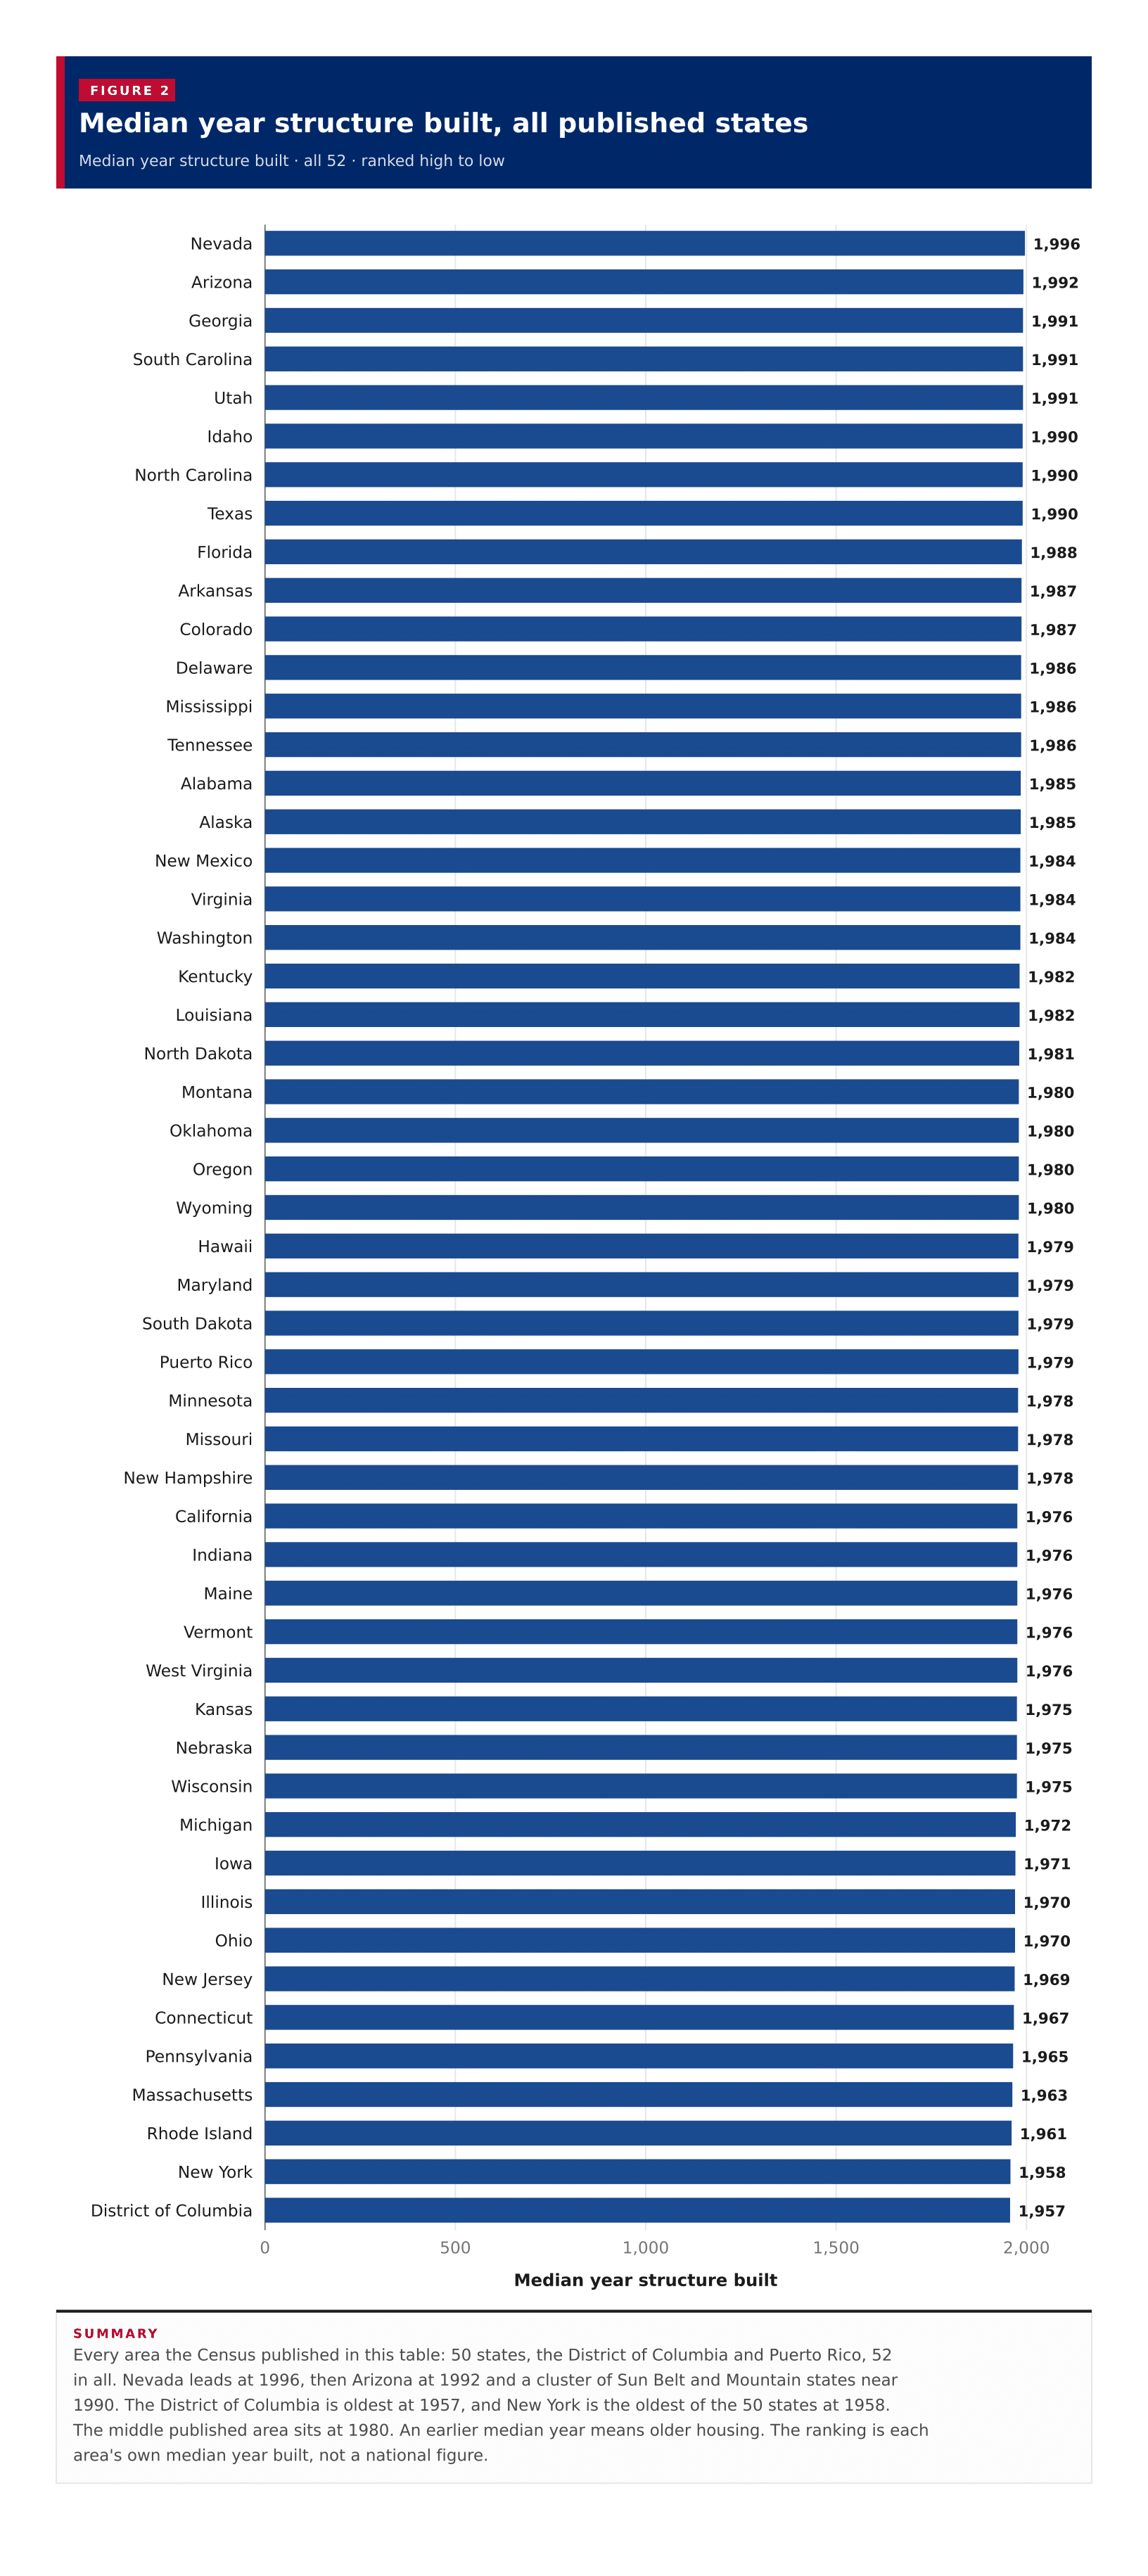
Median year structure built, all published states

Median year structure built · all 52 · ranked high to low

52 items
View100%
DownloadPDFImageCSV
Median year structure built, all published statesEvery area the Census published in this table: 50 states, the District of Columbia and Puerto Rico, 52 in all. Nevada leads at 1996, then Arizona at 1992 and a cluster of Sun Belt and Mountain states near 1990. The District of Columbia is oldest at 1957, and New York is the oldest of the 50 states at 1958. The middle published area sits at 1980. An earlier median year means older housing. The ranking is each area's own median year built, not a national figure.05001,0001,5002,000Median year structure built1,996Nevada1,992Arizona1,991Georgia1,991South Carolina1,991Utah1,990Idaho1,990North Carolina1,990Texas1,988Florida1,987Arkansas1,987Colorado1,986Delaware1,986Mississippi1,986Tennessee1,985Alabama1,985Alaska1,984New Mexico1,984Virginia1,984Washington1,982Kentucky1,982Louisiana1,981North Dakota1,980Montana1,980Oklahoma1,980Oregon1,980Wyoming1,979Hawaii1,979Maryland1,979South Dakota1,979Puerto Rico1,978Minnesota1,978Missouri1,978New Hampshire1,976California1,976Indiana1,976Maine1,976Vermont1,976West Virginia1,975Kansas1,975Nebraska1,975Wisconsin1,972Michigan1,971Iowa1,970Illinois1,970Ohio1,969New Jersey1,967Connecticut1,965Pennsylvania1,963Massachusetts1,961Rhode Island1,958New York1,957District of Columbia
Summary

Every area the Census published in this table: 50 states, the District of Columbia and Puerto Rico, 52 in all. Nevada leads at 1996, then Arizona at 1992 and a cluster of Sun Belt and Mountain states near 1990. The District of Columbia is oldest at 1957, and New York is the oldest of the 50 states at 1958. The middle published area sits at 1980. An earlier median year means older housing. The ranking is each area's own median year built, not a national figure.

Table 1

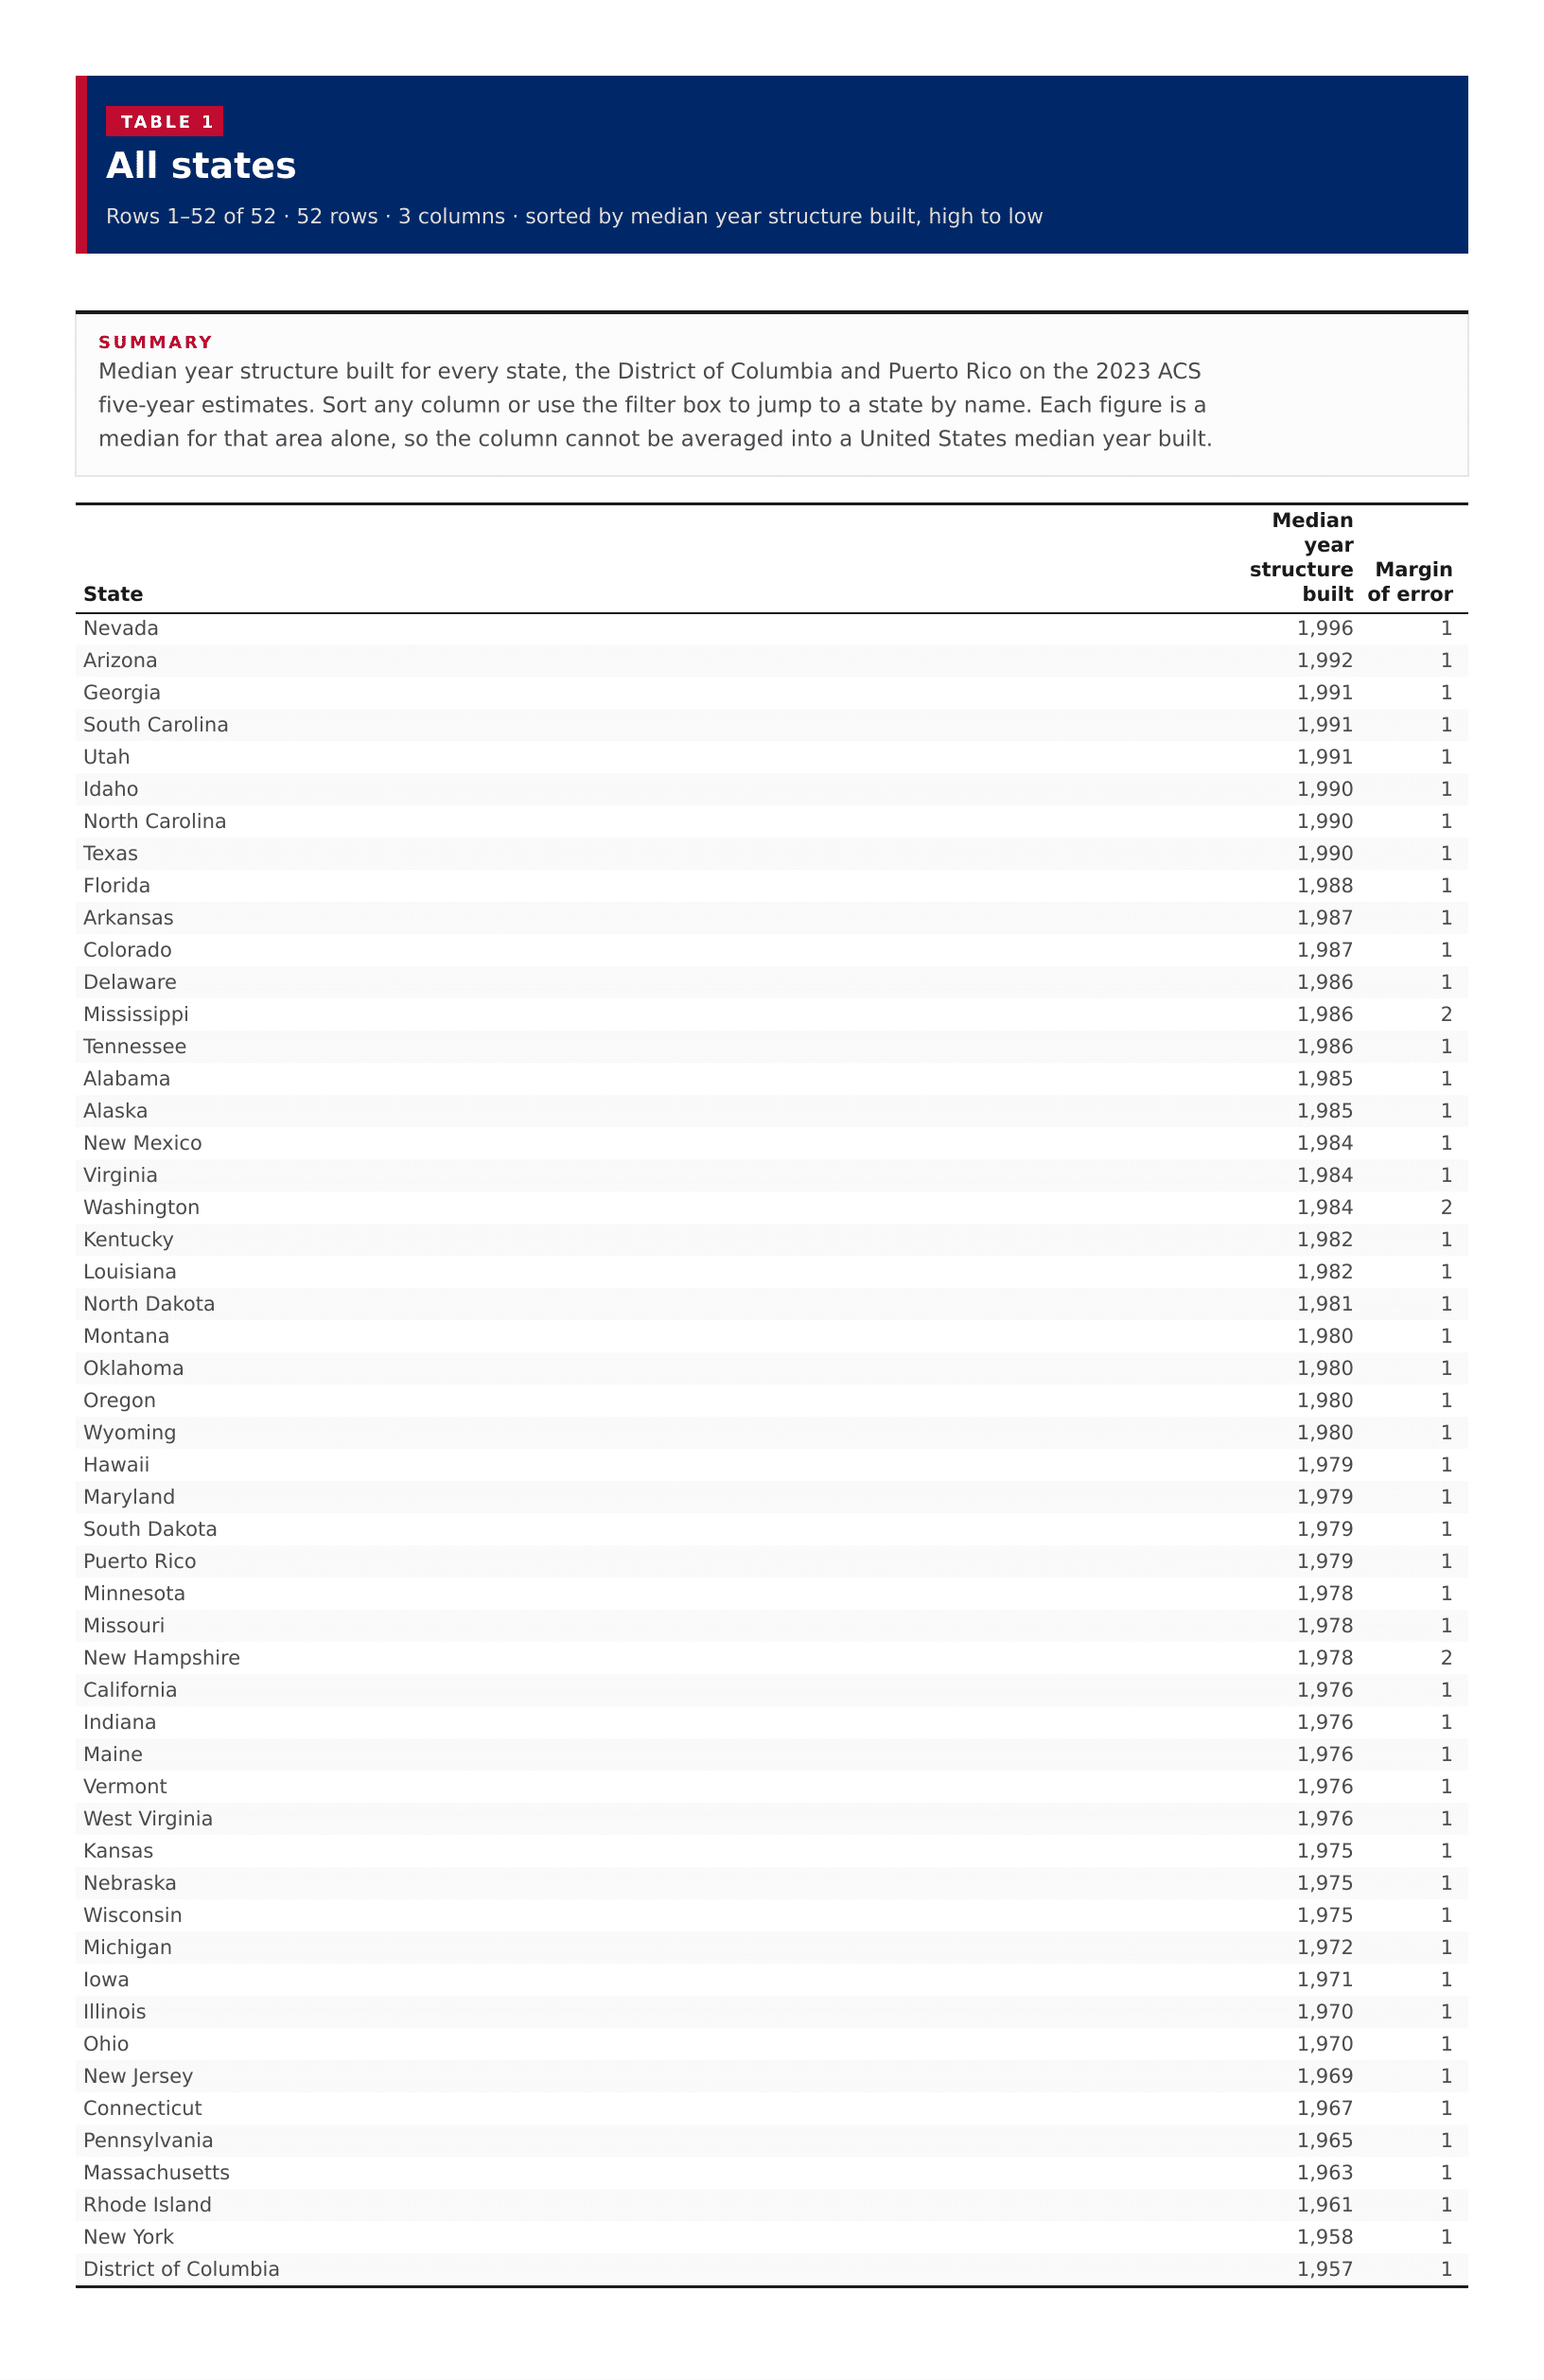
All states

52 rows · 3 columns · sorted by median year structure built, high to low

52 rows
View100%
DownloadPDFImageCSV
Summary

Median year structure built for every state, the District of Columbia and Puerto Rico on the 2023 ACS five-year estimates. Sort any column or use the filter box to jump to a state by name. Each figure is a median for that area alone, so the column cannot be averaged into a United States median year built.

All states
??
Nevada1,9961
Arizona1,9921
Georgia1,9911
South Carolina1,9911
Utah1,9911
Idaho1,9901
North Carolina1,9901
Texas1,9901
Florida1,9881
Arkansas1,9871
Colorado1,9871
Delaware1,9861
Mississippi1,9862
Tennessee1,9861
Alabama1,9851
Alaska1,9851
New Mexico1,9841
Virginia1,9841
Washington1,9842
Kentucky1,9821
Louisiana1,9821
North Dakota1,9811
Montana1,9801
Oklahoma1,9801
Oregon1,9801
Wyoming1,9801
Hawaii1,9791
Maryland1,9791
South Dakota1,9791
Puerto Rico1,9791
Minnesota1,9781
Missouri1,9781
New Hampshire1,9782
California1,9761
Indiana1,9761
Maine1,9761
Vermont1,9761
West Virginia1,9761
Kansas1,9751
Nebraska1,9751
Wisconsin1,9751
Michigan1,9721
Iowa1,9711
Illinois1,9701
Ohio1,9701
New Jersey1,9691
Connecticut1,9671
Pennsylvania1,9651
Massachusetts1,9631
Rhode Island1,9611
New York1,9581
District of Columbia1,9571

Image files

Download all

Figure 1

Median year structure built, US states

Figure 1: Median year structure built, US states
DownloadPDFImageCSV

Figure 2

Median year structure built, all published states

Figure 2: Median year structure built, all published states
DownloadPDFImageCSV

About this data

  • Median year structure built is the midpoint year for housing units in that area. Half of units were built in or before that year, and half after.
  • An earlier median year means older housing stock. A later year means newer stock.
  • A midpoint of state medians is not a United States median year built. These figures cannot be averaged to produce a national figure.
  • The Census published 50 states, the District of Columbia and Puerto Rico. None of the medians were suppressed, and no margin of error used an ACS annotation sentinel.
  • Alaska and Hawaii appear in the ranking and table. On the map they are shown in the usual inset positions.