Household size by US state

Summary

Average household size, US states

Average household size by state · all 52 states · hover or tap a state for every figure on this page

52 items
View100%
DownloadPDFImageCSV
StatesUtah
Average household size, US statesDarker amber is a larger average household size. Puerto Rico is listed in the ranking and table but is not on this map.Alabama · Average household size: 2.50 · Margin of error: 0.01 · Owner-occupied household size: 2.59 · Renter-occupied household size: 2.29 · Households: 1,969,105Alaska · Average household size: 2.63 · Margin of error: 0.01 · Owner-occupied household size: 2.74 · Renter-occupied household size: 2.40 · Households: 267,865Arizona · Average household size: 2.54 · Margin of error: 0.01 · Owner-occupied household size: 2.60 · Renter-occupied household size: 2.41 · Households: 2,796,790Arkansas · Average household size: 2.48 · Margin of error: 0.01 · Owner-occupied household size: 2.56 · Renter-occupied household size: 2.32 · Households: 1,189,160California · Average household size: 2.86 · Margin of error: 0.01 · Owner-occupied household size: 2.96 · Renter-occupied household size: 2.72 · Households: 13,434,847Colorado · Average household size: 2.45 · Margin of error: 0.01 · Owner-occupied household size: 2.57 · Renter-occupied household size: 2.19 · Households: 2,325,576Connecticut · Average household size: 2.47 · Margin of error: 0.01 · Owner-occupied household size: 2.62 · Renter-occupied household size: 2.16 · Households: 1,420,170Delaware · Average household size: 2.48 · Margin of error: 0.01 · Owner-occupied household size: 2.54 · Renter-occupied household size: 2.33 · Households: 396,209Florida · Average household size: 2.51 · Margin of error: 0.01 · Owner-occupied household size: 2.53 · Renter-occupied household size: 2.46 · Households: 8,550,911Georgia · Average household size: 2.64 · Margin of error: 0.01 · Owner-occupied household size: 2.73 · Renter-occupied household size: 2.46 · Households: 4,008,013Hawaii · Average household size: 2.88 · Margin of error: 0.01 · Owner-occupied household size: 2.99 · Renter-occupied household size: 2.69 · Households: 488,991Idaho · Average household size: 2.66 · Margin of error: 0.01 · Owner-occupied household size: 2.74 · Renter-occupied household size: 2.45 · Households: 693,821Illinois · Average household size: 2.48 · Margin of error: 0.01 · Owner-occupied household size: 2.63 · Renter-occupied household size: 2.17 · Households: 5,001,904Indiana · Average household size: 2.47 · Margin of error: 0.01 · Owner-occupied household size: 2.60 · Renter-occupied household size: 2.18 · Households: 2,681,537Iowa · Average household size: 2.38 · Margin of error: 0.01 · Owner-occupied household size: 2.50 · Renter-occupied household size: 2.05 · Households: 1,303,763Kansas · Average household size: 2.46 · Margin of error: 0.01 · Owner-occupied household size: 2.60 · Renter-occupied household size: 2.16 · Households: 1,160,715Kentucky · Average household size: 2.45 · Margin of error: 0.01 · Owner-occupied household size: 2.54 · Renter-occupied household size: 2.26 · Households: 1,791,991Louisiana · Average household size: 2.52 · Margin of error: 0.01 · Owner-occupied household size: 2.60 · Renter-occupied household size: 2.36 · Households: 1,783,168Maine · Average household size: 2.27 · Margin of error: 0.01 · Owner-occupied household size: 2.38 · Renter-occupied household size: 1.96 · Households: 589,085Maryland · Average household size: 2.58 · Margin of error: 0.01 · Owner-occupied household size: 2.70 · Renter-occupied household size: 2.34 · Households: 2,339,510Massachusetts · Average household size: 2.45 · Margin of error: 0.01 · Owner-occupied household size: 2.63 · Renter-occupied household size: 2.14 · Households: 2,762,070Michigan · Average household size: 2.43 · Margin of error: 0.01 · Owner-occupied household size: 2.55 · Renter-occupied household size: 2.13 · Households: 4,040,168Minnesota · Average household size: 2.44 · Margin of error: 0.01 · Owner-occupied household size: 2.60 · Renter-occupied household size: 2.04 · Households: 2,282,967Mississippi · Average household size: 2.52 · Margin of error: 0.01 · Owner-occupied household size: 2.58 · Renter-occupied household size: 2.40 · Households: 1,131,760Missouri · Average household size: 2.42 · Margin of error: 0.01 · Owner-occupied household size: 2.55 · Renter-occupied household size: 2.13 · Households: 2,484,834Montana · Average household size: 2.38 · Margin of error: 0.01 · Owner-occupied household size: 2.48 · Renter-occupied household size: 2.14 · Households: 452,683Nebraska · Average household size: 2.44 · Margin of error: 0.01 · Owner-occupied household size: 2.61 · Renter-occupied household size: 2.09 · Households: 786,885Nevada · Average household size: 2.62 · Margin of error: 0.01 · Owner-occupied household size: 2.69 · Renter-occupied household size: 2.53 · Households: 1,183,393New Hampshire · Average household size: 2.44 · Margin of error: 0.01 · Owner-occupied household size: 2.59 · Renter-occupied household size: 2.05 · Households: 551,186New Jersey · Average household size: 2.61 · Margin of error: 0.01 · Owner-occupied household size: 2.74 · Renter-occupied household size: 2.39 · Households: 3,478,355New Mexico · Average household size: 2.51 · Margin of error: 0.01 · Owner-occupied household size: 2.61 · Renter-occupied household size: 2.29 · Households: 825,021New York · Average household size: 2.51 · Margin of error: 0.01 · Owner-occupied household size: 2.69 · Renter-occupied household size: 2.31 · Households: 7,668,956North Carolina · Average household size: 2.46 · Margin of error: 0.01 · Owner-occupied household size: 2.55 · Renter-occupied household size: 2.29 · Households: 4,186,924North Dakota · Average household size: 2.31 · Margin of error: 0.01 · Owner-occupied household size: 2.53 · Renter-occupied household size: 1.94 · Households: 325,079Ohio · Average household size: 2.38 · Margin of error: 0.01 · Owner-occupied household size: 2.51 · Renter-occupied household size: 2.12 · Households: 4,829,571Oklahoma · Average household size: 2.51 · Margin of error: 0.01 · Owner-occupied household size: 2.60 · Renter-occupied household size: 2.35 · Households: 1,542,780Oregon · Average household size: 2.43 · Margin of error: 0.01 · Owner-occupied household size: 2.56 · Renter-occupied household size: 2.22 · Households: 1,701,548Pennsylvania · Average household size: 2.40 · Margin of error: 0.01 · Owner-occupied household size: 2.53 · Renter-occupied household size: 2.10 · Households: 5,235,339Rhode Island · Average household size: 2.40 · Margin of error: 0.01 · Owner-occupied household size: 2.58 · Renter-occupied household size: 2.10 · Households: 436,902South Carolina · Average household size: 2.45 · Margin of error: 0.01 · Owner-occupied household size: 2.51 · Renter-occupied household size: 2.31 · Households: 2,070,390South Dakota · Average household size: 2.42 · Margin of error: 0.01 · Owner-occupied household size: 2.56 · Renter-occupied household size: 2.11 · Households: 358,552Tennessee · Average household size: 2.47 · Margin of error: 0.01 · Owner-occupied household size: 2.55 · Renter-occupied household size: 2.31 · Households: 2,768,743Texas · Average household size: 2.70 · Margin of error: 0.01 · Owner-occupied household size: 2.87 · Renter-occupied household size: 2.42 · Households: 10,747,240Utah · Average household size: 2.99 · Margin of error: 0.01 · Owner-occupied household size: 3.17 · Renter-occupied household size: 2.58 · Households: 1,094,896Vermont · Average household size: 2.30 · Margin of error: 0.01 · Owner-occupied household size: 2.43 · Renter-occupied household size: 1.95 · Households: 269,466Virginia · Average household size: 2.53 · Margin of error: 0.01 · Owner-occupied household size: 2.64 · Renter-occupied household size: 2.32 · Households: 3,326,260Washington · Average household size: 2.51 · Margin of error: 0.01 · Owner-occupied household size: 2.65 · Renter-occupied household size: 2.27 · Households: 3,020,558West Virginia · Average household size: 2.40 · Margin of error: 0.01 · Owner-occupied household size: 2.48 · Renter-occupied household size: 2.18 · Households: 721,448Wisconsin · Average household size: 2.35 · Margin of error: 0.01 · Owner-occupied household size: 2.50 · Renter-occupied household size: 2.03 · Households: 2,446,028Wyoming · Average household size: 2.38 · Margin of error: 0.01 · Owner-occupied household size: 2.48 · Renter-occupied household size: 2.10 · Households: 238,176District of Columbia · Average household size: 1.99 · Margin of error: 0.01 · Owner-occupied household size: 2.21 · Renter-occupied household size: 1.84 · Households: 321,556District of Columbia · Average household size: 1.99 · Margin of error: 0.01 · Owner-occupied household size: 2.21 · Renter-occupied household size: 1.84 · Households: 321,556Average household size1.992.99
Summary

Darker amber is a larger average household size. Puerto Rico is listed in the ranking and table but is not on this map.

A typical published area has an average household size of 2.47 people, the midpoint of the 50 states, the District of Columbia and Puerto Rico on the 2023 ACS five-year estimates. Utah leads at 2.99, and Hawaii and California also sit above 2.80. Maine is the lowest of the 50 states at 2.27. The District of Columbia, which this table also returns, sits far lower at 1.99. Utah is 0.72 people above Maine and 1.00 above the District of Columbia. These are averages of people per occupied housing unit in each area, not a national figure of households.

In short

2.47typical published areathe middle area, not a national average
2.99Utahhighest average household size
2.27Mainelowest of the 50 states
1.99District of Columbialowest figure the Census published
3areas at or above 2.80Utah, Hawaii and California
Figure 1

Average household size, all published states

Average household size · all 52 · ranked high to low

52 items
View100%
DownloadPDFImageCSV
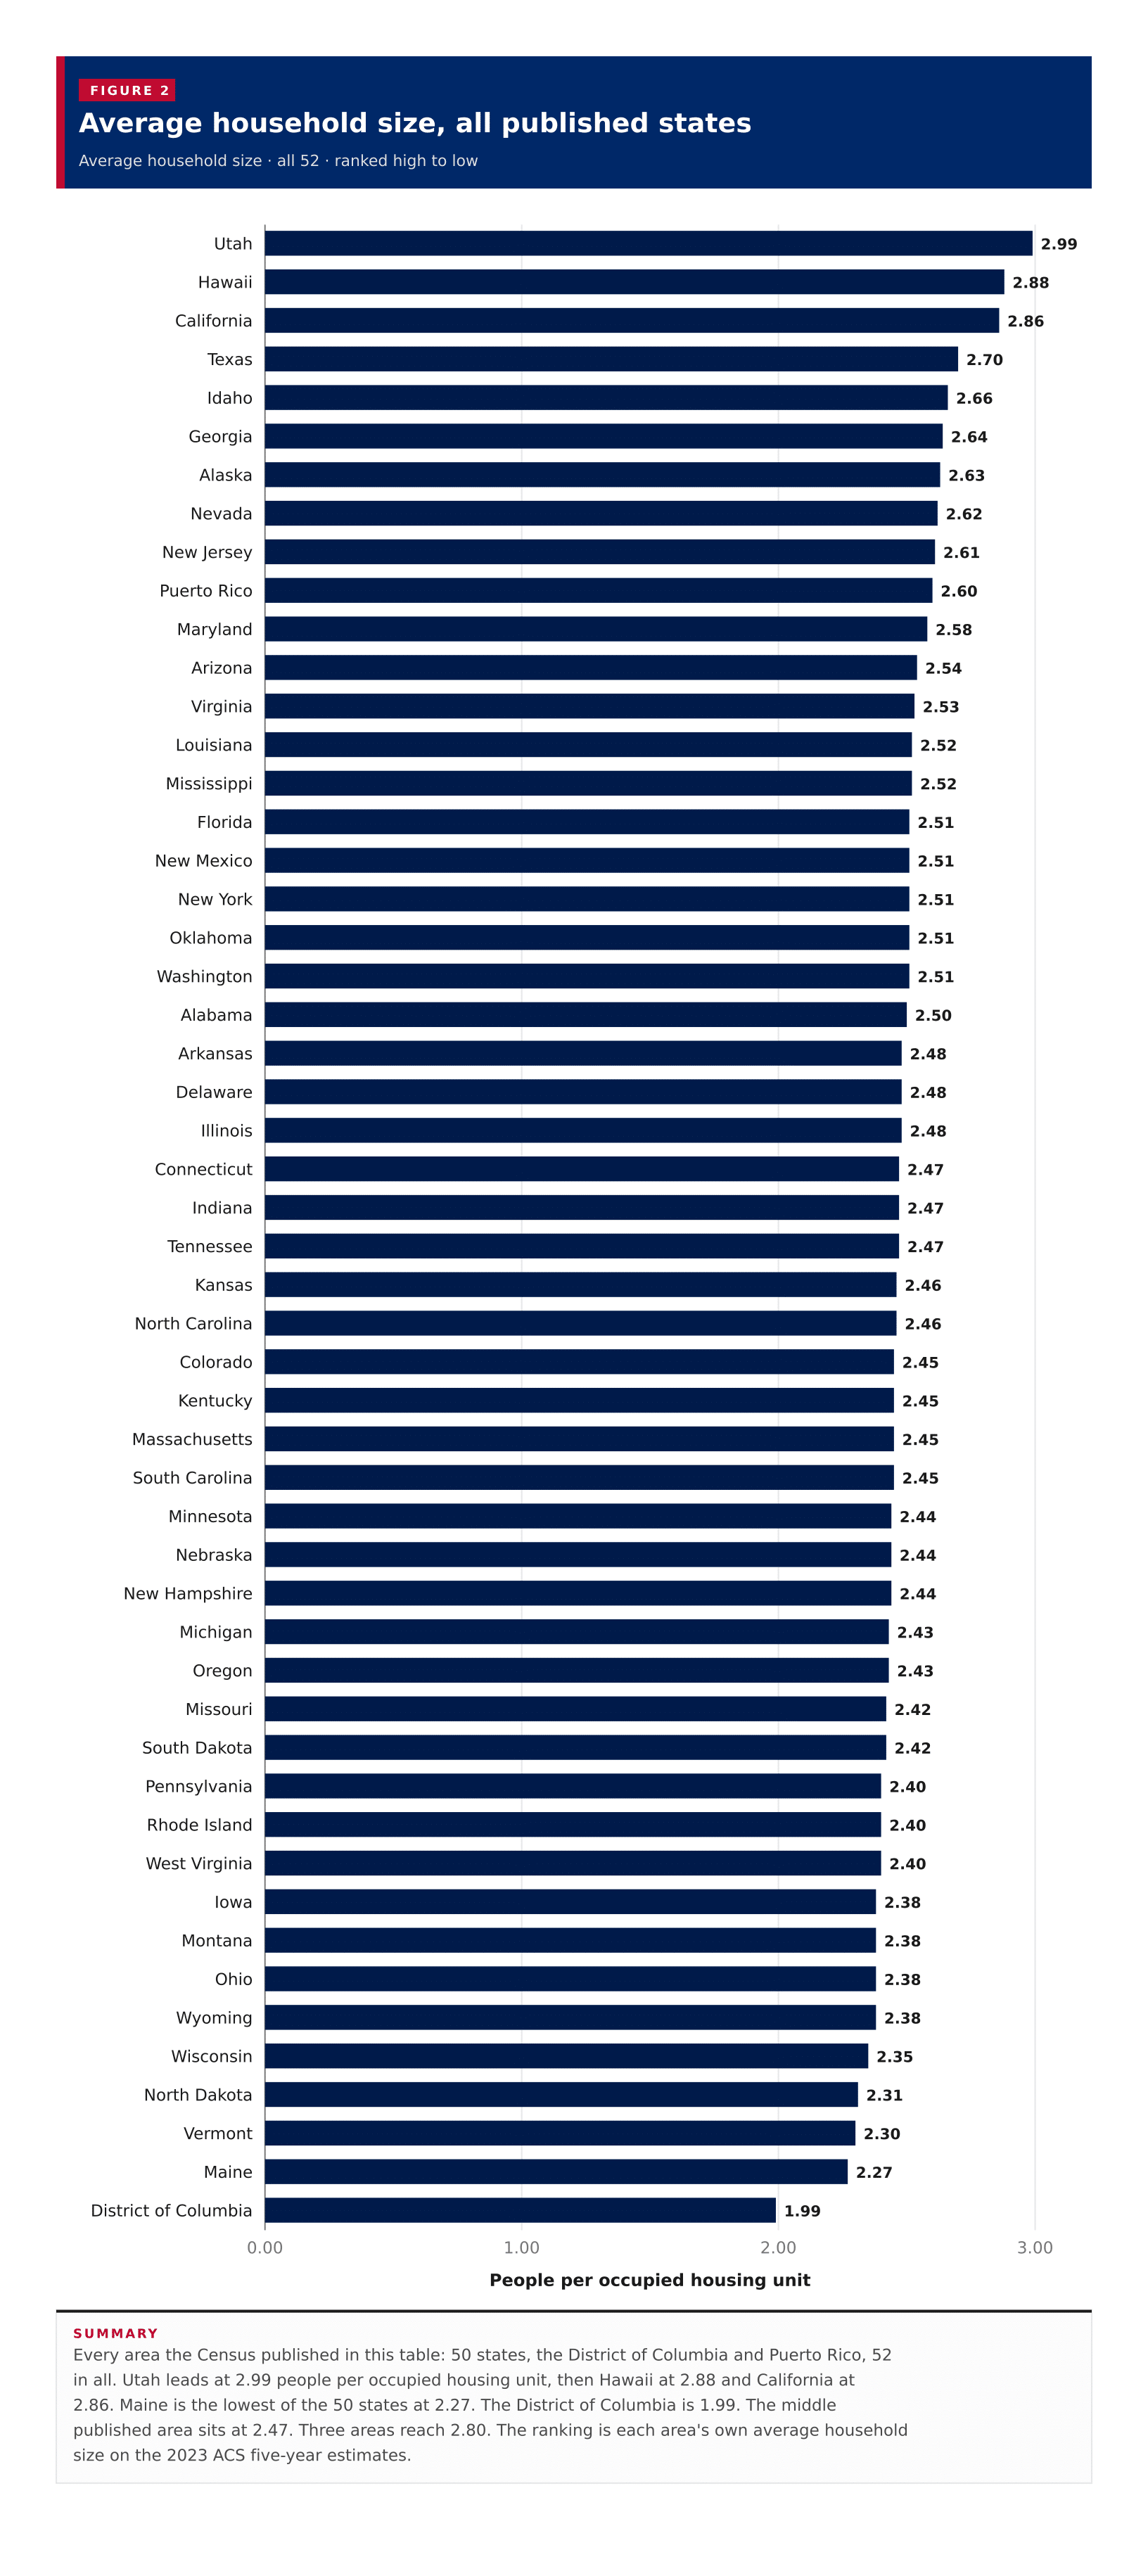
Average household size, all published statesEvery area the Census published in this table: 50 states, the District of Columbia and Puerto Rico, 52 in all. Utah leads at 2.99 people per occupied housing unit, then Hawaii at 2.88 and California at 2.86. Maine is the lowest of the 50 states at 2.27. The District of Columbia is 1.99. The middle published area sits at 2.47. Three areas reach 2.80. The ranking is each area's own average household size on the 2023 ACS five-year estimates.0.001.002.003.00People per occupied housing unit2.99Utah2.88Hawaii2.86California2.70Texas2.66Idaho2.64Georgia2.63Alaska2.62Nevada2.61New Jersey2.60Puerto Rico2.58Maryland2.54Arizona2.53Virginia2.52Louisiana2.52Mississippi2.51Florida2.51New Mexico2.51New York2.51Oklahoma2.51Washington2.50Alabama2.48Arkansas2.48Delaware2.48Illinois2.47Connecticut2.47Indiana2.47Tennessee2.46Kansas2.46North Carolina2.45Colorado2.45Kentucky2.45Massachusetts2.45South Carolina2.44Minnesota2.44Nebraska2.44New Hampshire2.43Michigan2.43Oregon2.42Missouri2.42South Dakota2.40Pennsylvania2.40Rhode Island2.40West Virginia2.38Iowa2.38Montana2.38Ohio2.38Wyoming2.35Wisconsin2.31North Dakota2.30Vermont2.27Maine1.99District of Columbia
Summary

Every area the Census published in this table: 50 states, the District of Columbia and Puerto Rico, 52 in all. Utah leads at 2.99 people per occupied housing unit, then Hawaii at 2.88 and California at 2.86. Maine is the lowest of the 50 states at 2.27. The District of Columbia is 1.99. The middle published area sits at 2.47. Three areas reach 2.80. The ranking is each area's own average household size on the 2023 ACS five-year estimates.

Figure 2

Owner-occupied household size, all published states

Owner-occupied household size · all 52 · ranked high to low

52 items
View100%
DownloadPDFImageCSV
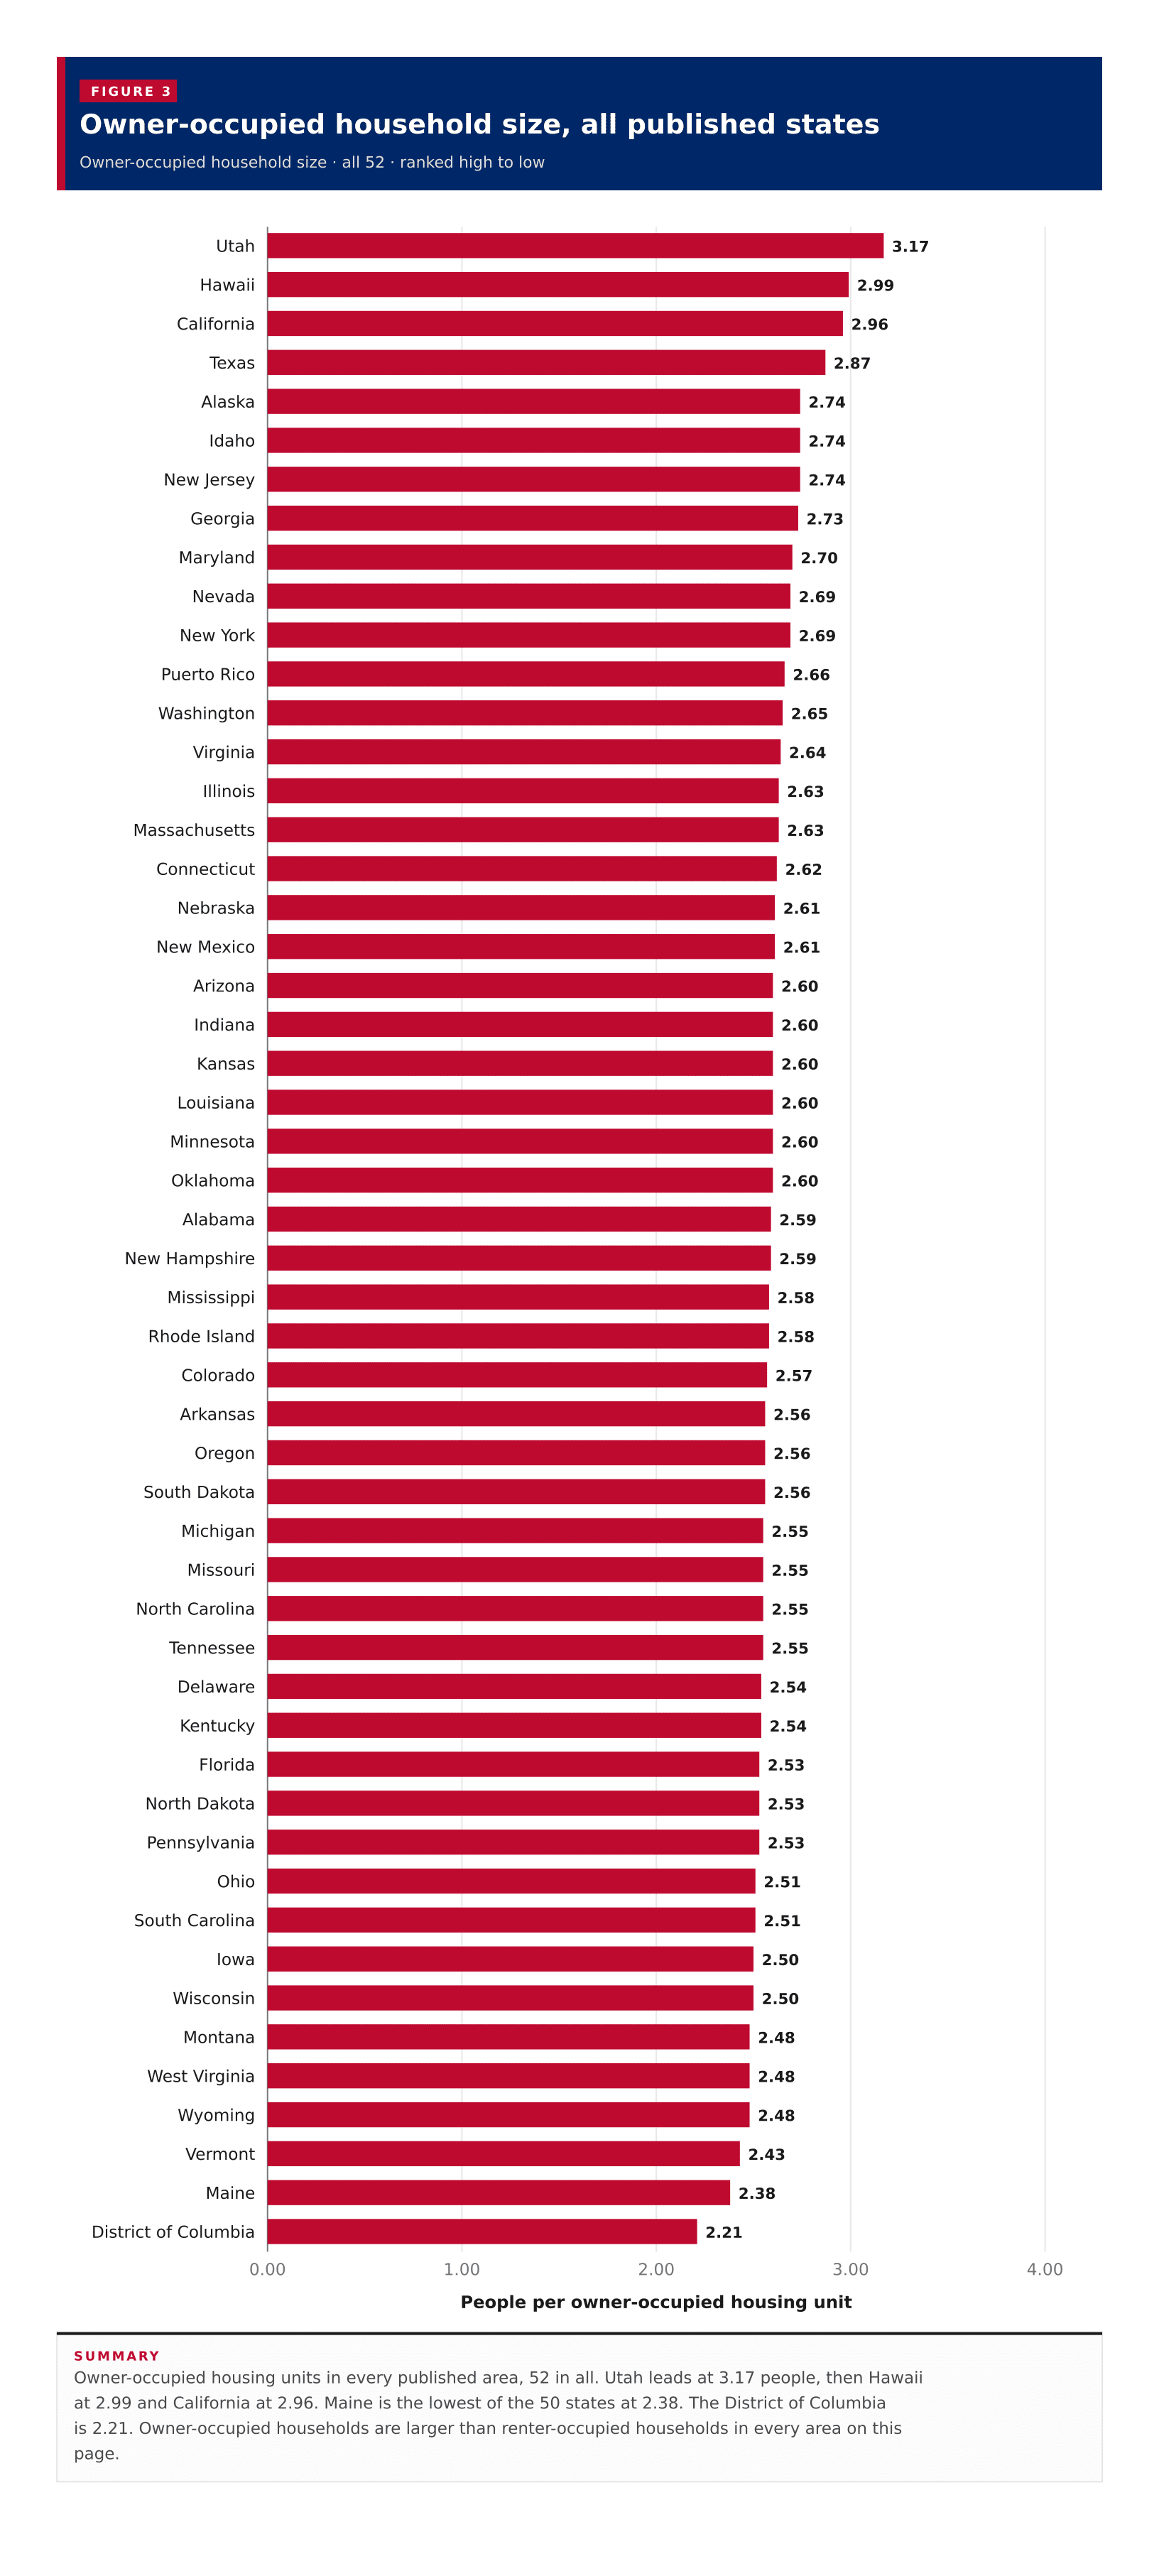
Owner-occupied household size, all published statesOwner-occupied housing units in every published area, 52 in all. Utah leads at 3.17 people, then Hawaii at 2.99 and California at 2.96. Maine is the lowest of the 50 states at 2.38. The District of Columbia is 2.21. Owner-occupied households are larger than renter-occupied households in every area on this page.0.001.002.003.004.00People per owner-occupied housing unit3.17Utah2.99Hawaii2.96California2.87Texas2.74Alaska2.74Idaho2.74New Jersey2.73Georgia2.70Maryland2.69Nevada2.69New York2.66Puerto Rico2.65Washington2.64Virginia2.63Illinois2.63Massachusetts2.62Connecticut2.61Nebraska2.61New Mexico2.60Arizona2.60Indiana2.60Kansas2.60Louisiana2.60Minnesota2.60Oklahoma2.59Alabama2.59New Hampshire2.58Mississippi2.58Rhode Island2.57Colorado2.56Arkansas2.56Oregon2.56South Dakota2.55Michigan2.55Missouri2.55North Carolina2.55Tennessee2.54Delaware2.54Kentucky2.53Florida2.53North Dakota2.53Pennsylvania2.51Ohio2.51South Carolina2.50Iowa2.50Wisconsin2.48Montana2.48West Virginia2.48Wyoming2.43Vermont2.38Maine2.21District of Columbia
Summary

Owner-occupied housing units in every published area, 52 in all. Utah leads at 3.17 people, then Hawaii at 2.99 and California at 2.96. Maine is the lowest of the 50 states at 2.38. The District of Columbia is 2.21. Owner-occupied households are larger than renter-occupied households in every area on this page.

Figure 3

Owner size against renter size

Renter-occupied household size against owner-occupied household size · one point per row, 52 of 52 plotted

52 items
View100%
DownloadPDFImageCSV
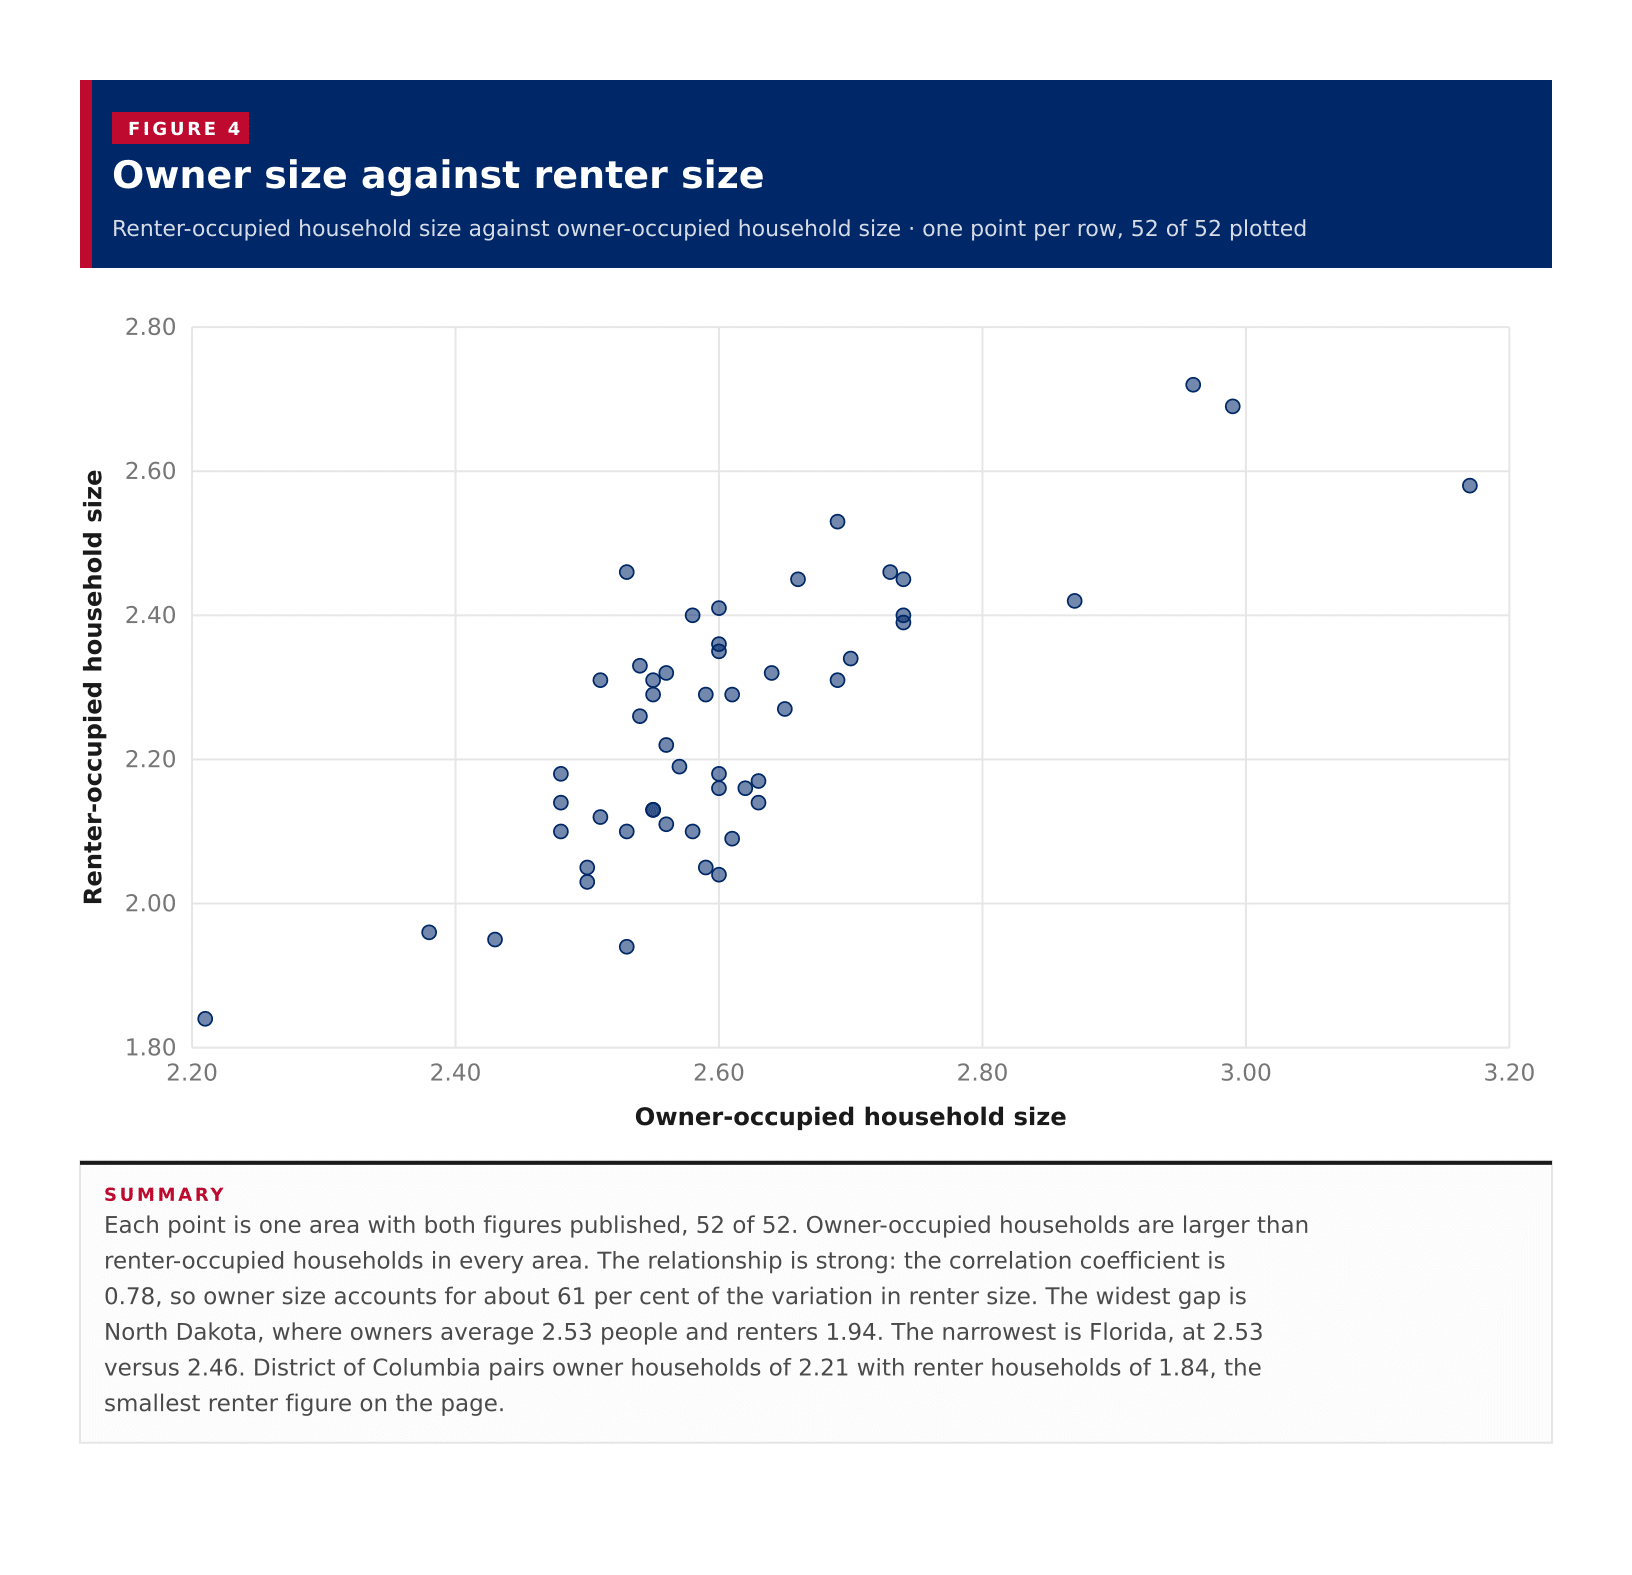
Owner size against renter sizeEach point is one area with both figures published, 52 of 52. Owner-occupied households are larger than renter-occupied households in every area. The relationship is strong: the correlation coefficient is 0.78, so owner size accounts for about 61 per cent of the variation in renter size. The widest gap is North Dakota, where owners average 2.53 people and renters 1.94. The narrowest is Florida, at 2.53 versus 2.46. District of Columbia pairs owner households of 2.21 with renter households of 1.84, the smallest renter figure on the page.1.802.002.202.402.602.802.202.402.602.803.003.20Renter-occupied household sizeOwner-occupied household size
Summary

Each point is one area with both figures published, 52 of 52. Owner-occupied households are larger than renter-occupied households in every area. The relationship is strong: the correlation coefficient is 0.78, so owner size accounts for about 61 per cent of the variation in renter size. The widest gap is North Dakota, where owners average 2.53 people and renters 1.94. The narrowest is Florida, at 2.53 versus 2.46. District of Columbia pairs owner households of 2.21 with renter households of 1.84, the smallest renter figure on the page.

Table 1

All states

52 rows · 6 columns · sorted by average household size, high to low

52 rows
View100%
DownloadPDFImageCSV
Summary

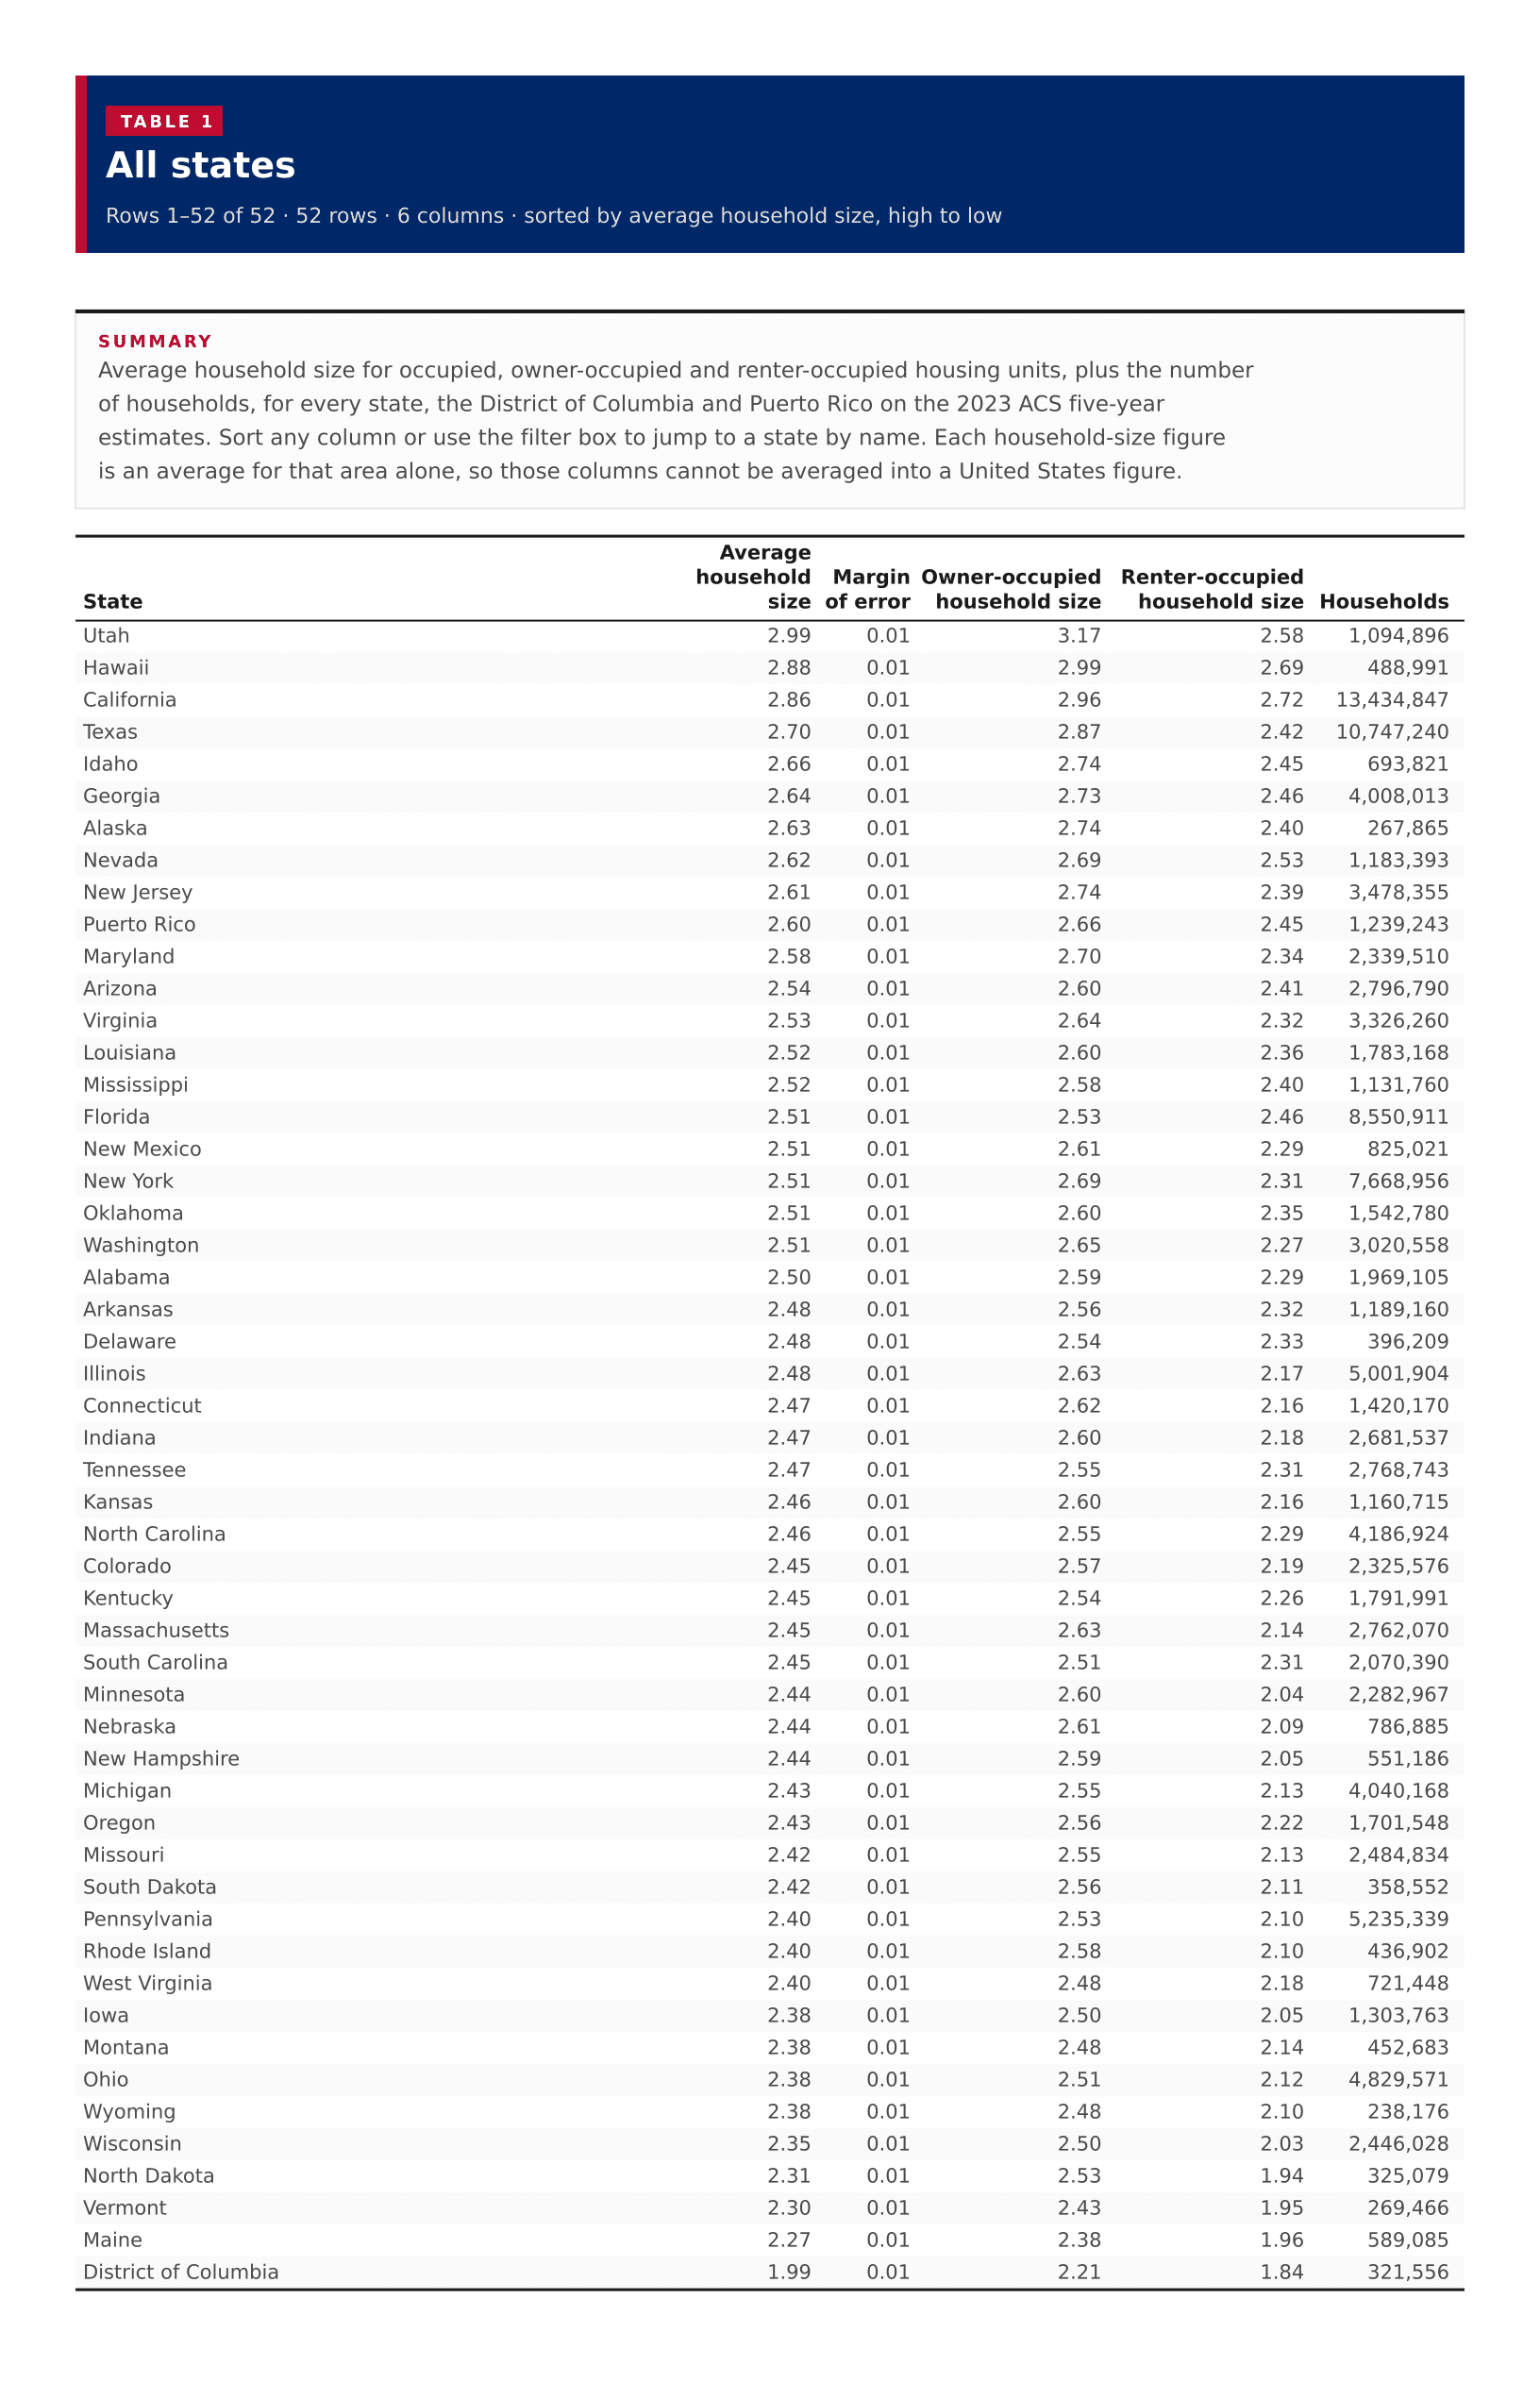
Average household size for occupied, owner-occupied and renter-occupied housing units, plus the number of households, for every state, the District of Columbia and Puerto Rico on the 2023 ACS five-year estimates. Sort any column or use the filter box to jump to a state by name. Each household-size figure is an average for that area alone, so those columns cannot be averaged into a United States figure.

All states
?????
Utah2.990.013.172.581,094,896
Hawaii2.880.012.992.69488,991
California2.860.012.962.7213,434,847
Texas2.700.012.872.4210,747,240
Idaho2.660.012.742.45693,821
Georgia2.640.012.732.464,008,013
Alaska2.630.012.742.40267,865
Nevada2.620.012.692.531,183,393
New Jersey2.610.012.742.393,478,355
Puerto Rico2.600.012.662.451,239,243
Maryland2.580.012.702.342,339,510
Arizona2.540.012.602.412,796,790
Virginia2.530.012.642.323,326,260
Louisiana2.520.012.602.361,783,168
Mississippi2.520.012.582.401,131,760
Florida2.510.012.532.468,550,911
New Mexico2.510.012.612.29825,021
New York2.510.012.692.317,668,956
Oklahoma2.510.012.602.351,542,780
Washington2.510.012.652.273,020,558
Alabama2.500.012.592.291,969,105
Arkansas2.480.012.562.321,189,160
Delaware2.480.012.542.33396,209
Illinois2.480.012.632.175,001,904
Connecticut2.470.012.622.161,420,170
Indiana2.470.012.602.182,681,537
Tennessee2.470.012.552.312,768,743
Kansas2.460.012.602.161,160,715
North Carolina2.460.012.552.294,186,924
Colorado2.450.012.572.192,325,576
Kentucky2.450.012.542.261,791,991
Massachusetts2.450.012.632.142,762,070
South Carolina2.450.012.512.312,070,390
Minnesota2.440.012.602.042,282,967
Nebraska2.440.012.612.09786,885
New Hampshire2.440.012.592.05551,186
Michigan2.430.012.552.134,040,168
Oregon2.430.012.562.221,701,548
Missouri2.420.012.552.132,484,834
South Dakota2.420.012.562.11358,552
Pennsylvania2.400.012.532.105,235,339
Rhode Island2.400.012.582.10436,902
West Virginia2.400.012.482.18721,448
Iowa2.380.012.502.051,303,763
Montana2.380.012.482.14452,683
Ohio2.380.012.512.124,829,571
Wyoming2.380.012.482.10238,176
Wisconsin2.350.012.502.032,446,028
North Dakota2.310.012.531.94325,079
Vermont2.300.012.431.95269,466
Maine2.270.012.381.96589,085
District of Columbia1.990.012.211.84321,556

Image files

Download all

Figure 1

Average household size, US states
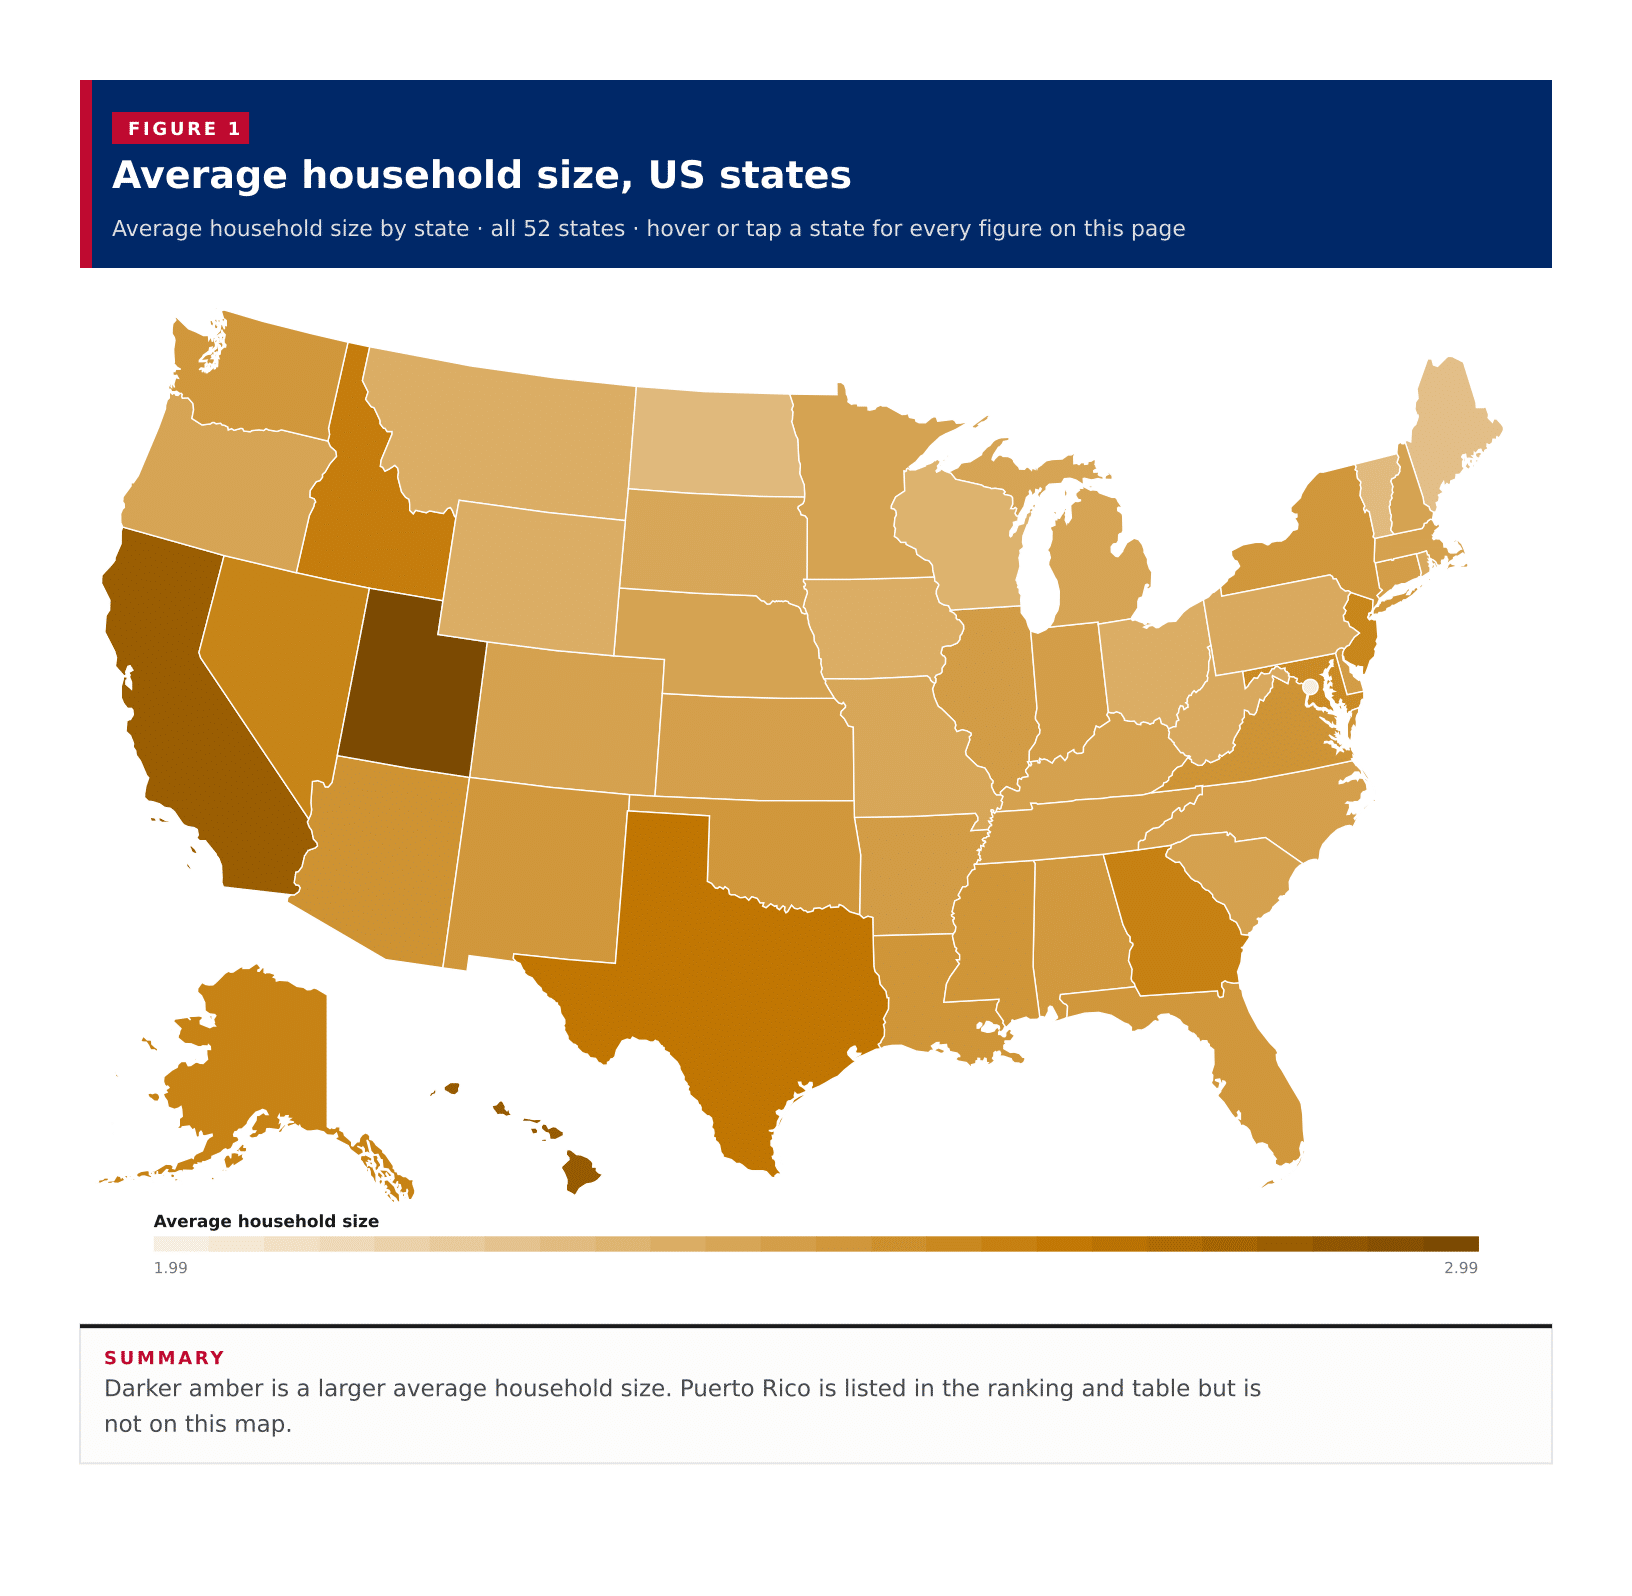
Figure 1: Average household size, US states
DownloadPDFImageCSV

Figure 2

Average household size, all published states

Figure 2: Average household size, all published states
DownloadPDFImageCSV

Figure 3

Owner-occupied household size, all published states

Figure 3: Owner-occupied household size, all published states
DownloadPDFImageCSV

Figure 4

Owner size against renter size

Figure 4: Owner size against renter size
DownloadPDFImageCSV

About this data

  • Average household size is the number of people per occupied housing unit, including people who live alone. It is not the same as average family size, which excludes one-person households.
  • A state average describes occupied housing units in that state. These 52 figures cannot be averaged to produce a national figure.
  • The ACS published a United States average of 2.54 people per occupied housing unit on the same 2023 five-year estimates. That is a national figure, not the midpoint of the state list (2.47).
  • The Census published 50 states, the District of Columbia and Puerto Rico. None of the household-size estimates were suppressed.
  • Owner-occupied and renter-occupied averages come from the same table (B25010). Owner-occupied units have more people than renter-occupied units in every published area here.
  • Alaska and Hawaii appear in the ranking and table. On the map they are drawn in the usual insets.
  • Puerto Rico is listed in the ranking and table. It is not shaded on the continental state map.
  • Margins of error are the Census Bureau's 90 percent margins. None of these state-level household-size estimates used the ACS controlled-estimate sentinel, so every published margin is a real sampling error.
  • Occupied housing units are households. Group quarters such as college dormitories, nursing homes and prisons are not in this average.