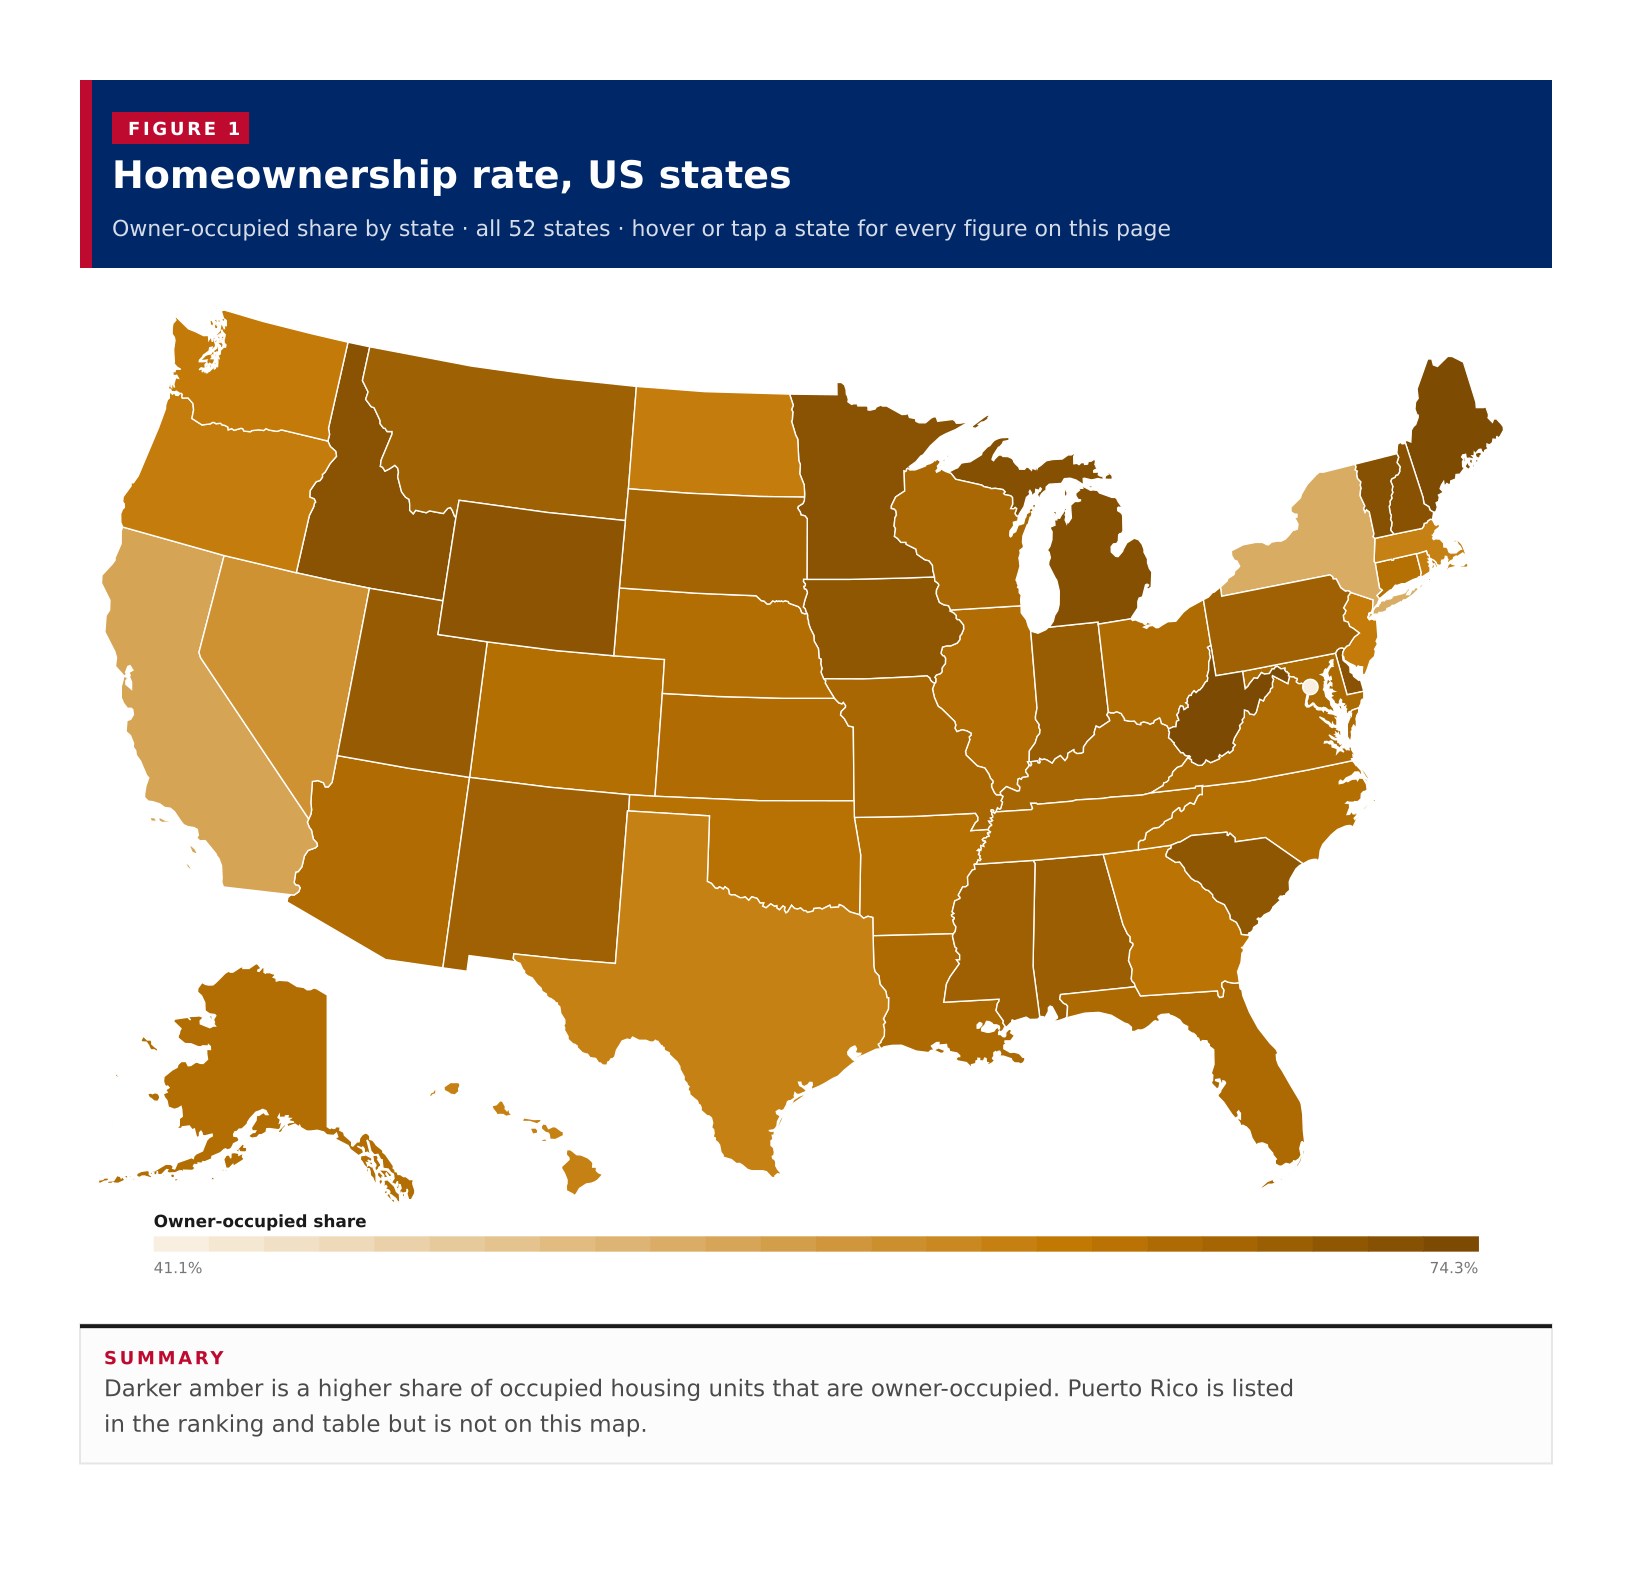
Figure 1
Homeownership rate, US states

Owner-occupied share by state · all 52 states · hover or tap a state for every figure on this page
Among the 50 states, the District of Columbia and Puerto Rico, a typical published area has 67.2% of occupied housing units owner-occupied, the midpoint of these 52 rates on the 2023 ACS five-year estimates. West Virginia is highest at 74.3%, then Maine at 74.0% and Michigan at 72.9%. District of Columbia is lowest at 41.1%. 51 of the 52 published areas have an owner-occupied majority. That state midpoint is not a United States homeownership rate: if every occupied unit in these areas is pooled, the owner-occupied share is 65.1%, because larger states weigh more.
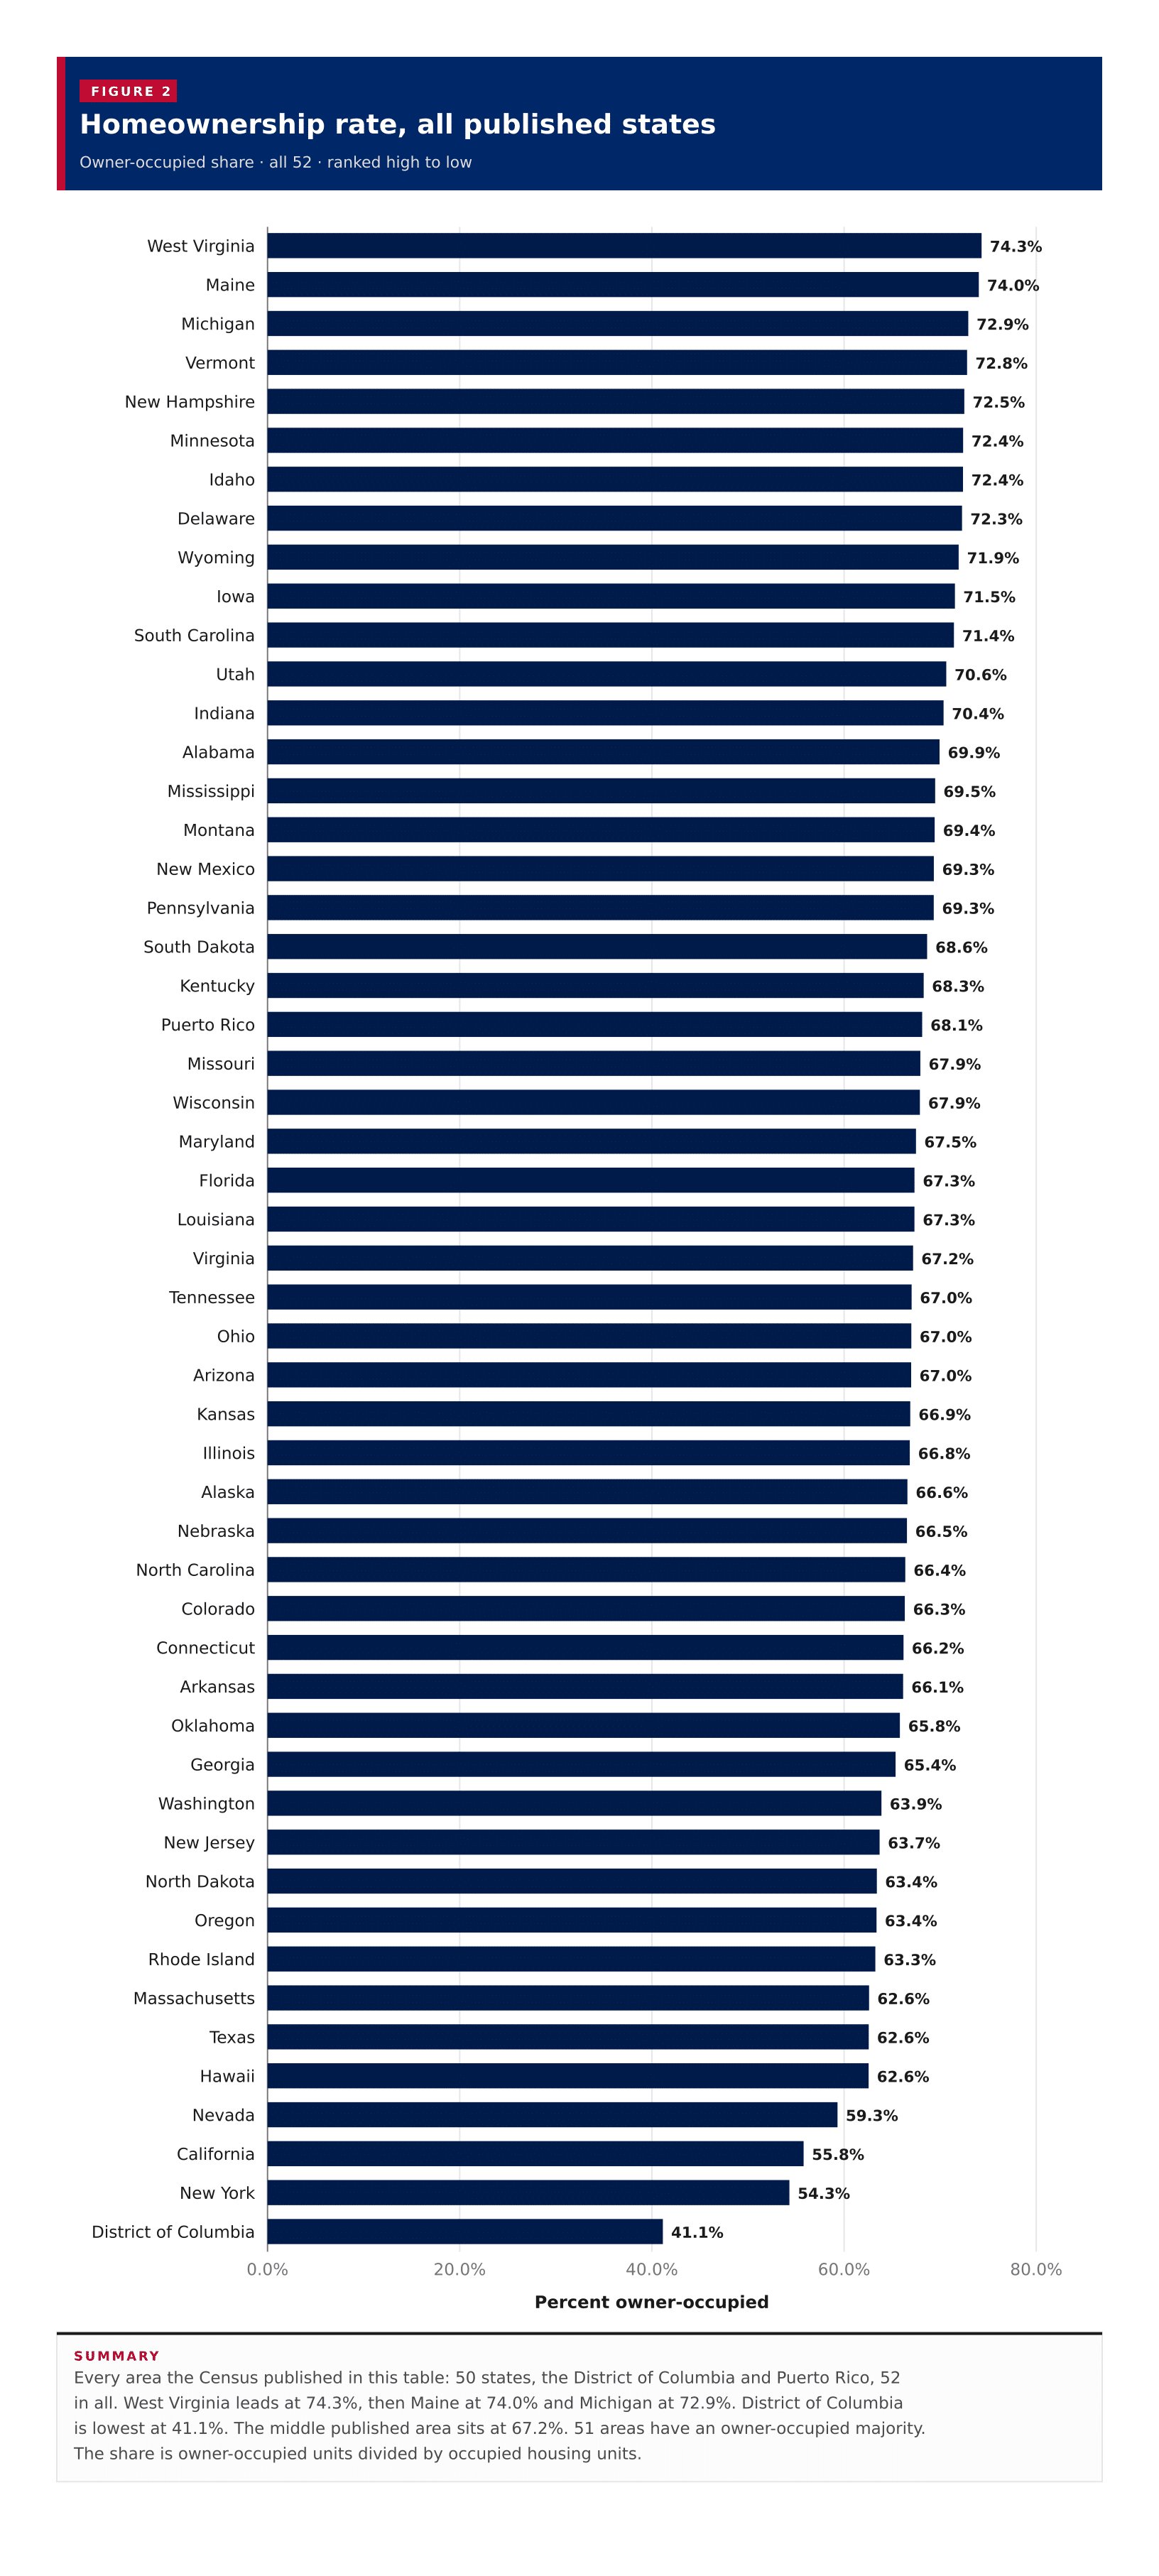
Owner-occupied share · all 52 · ranked high to low
Every area the Census published in this table: 50 states, the District of Columbia and Puerto Rico, 52 in all. West Virginia leads at 74.3%, then Maine at 74.0% and Michigan at 72.9%. District of Columbia is lowest at 41.1%. The middle published area sits at 67.2%. 51 areas have an owner-occupied majority. The share is owner-occupied units divided by occupied housing units.
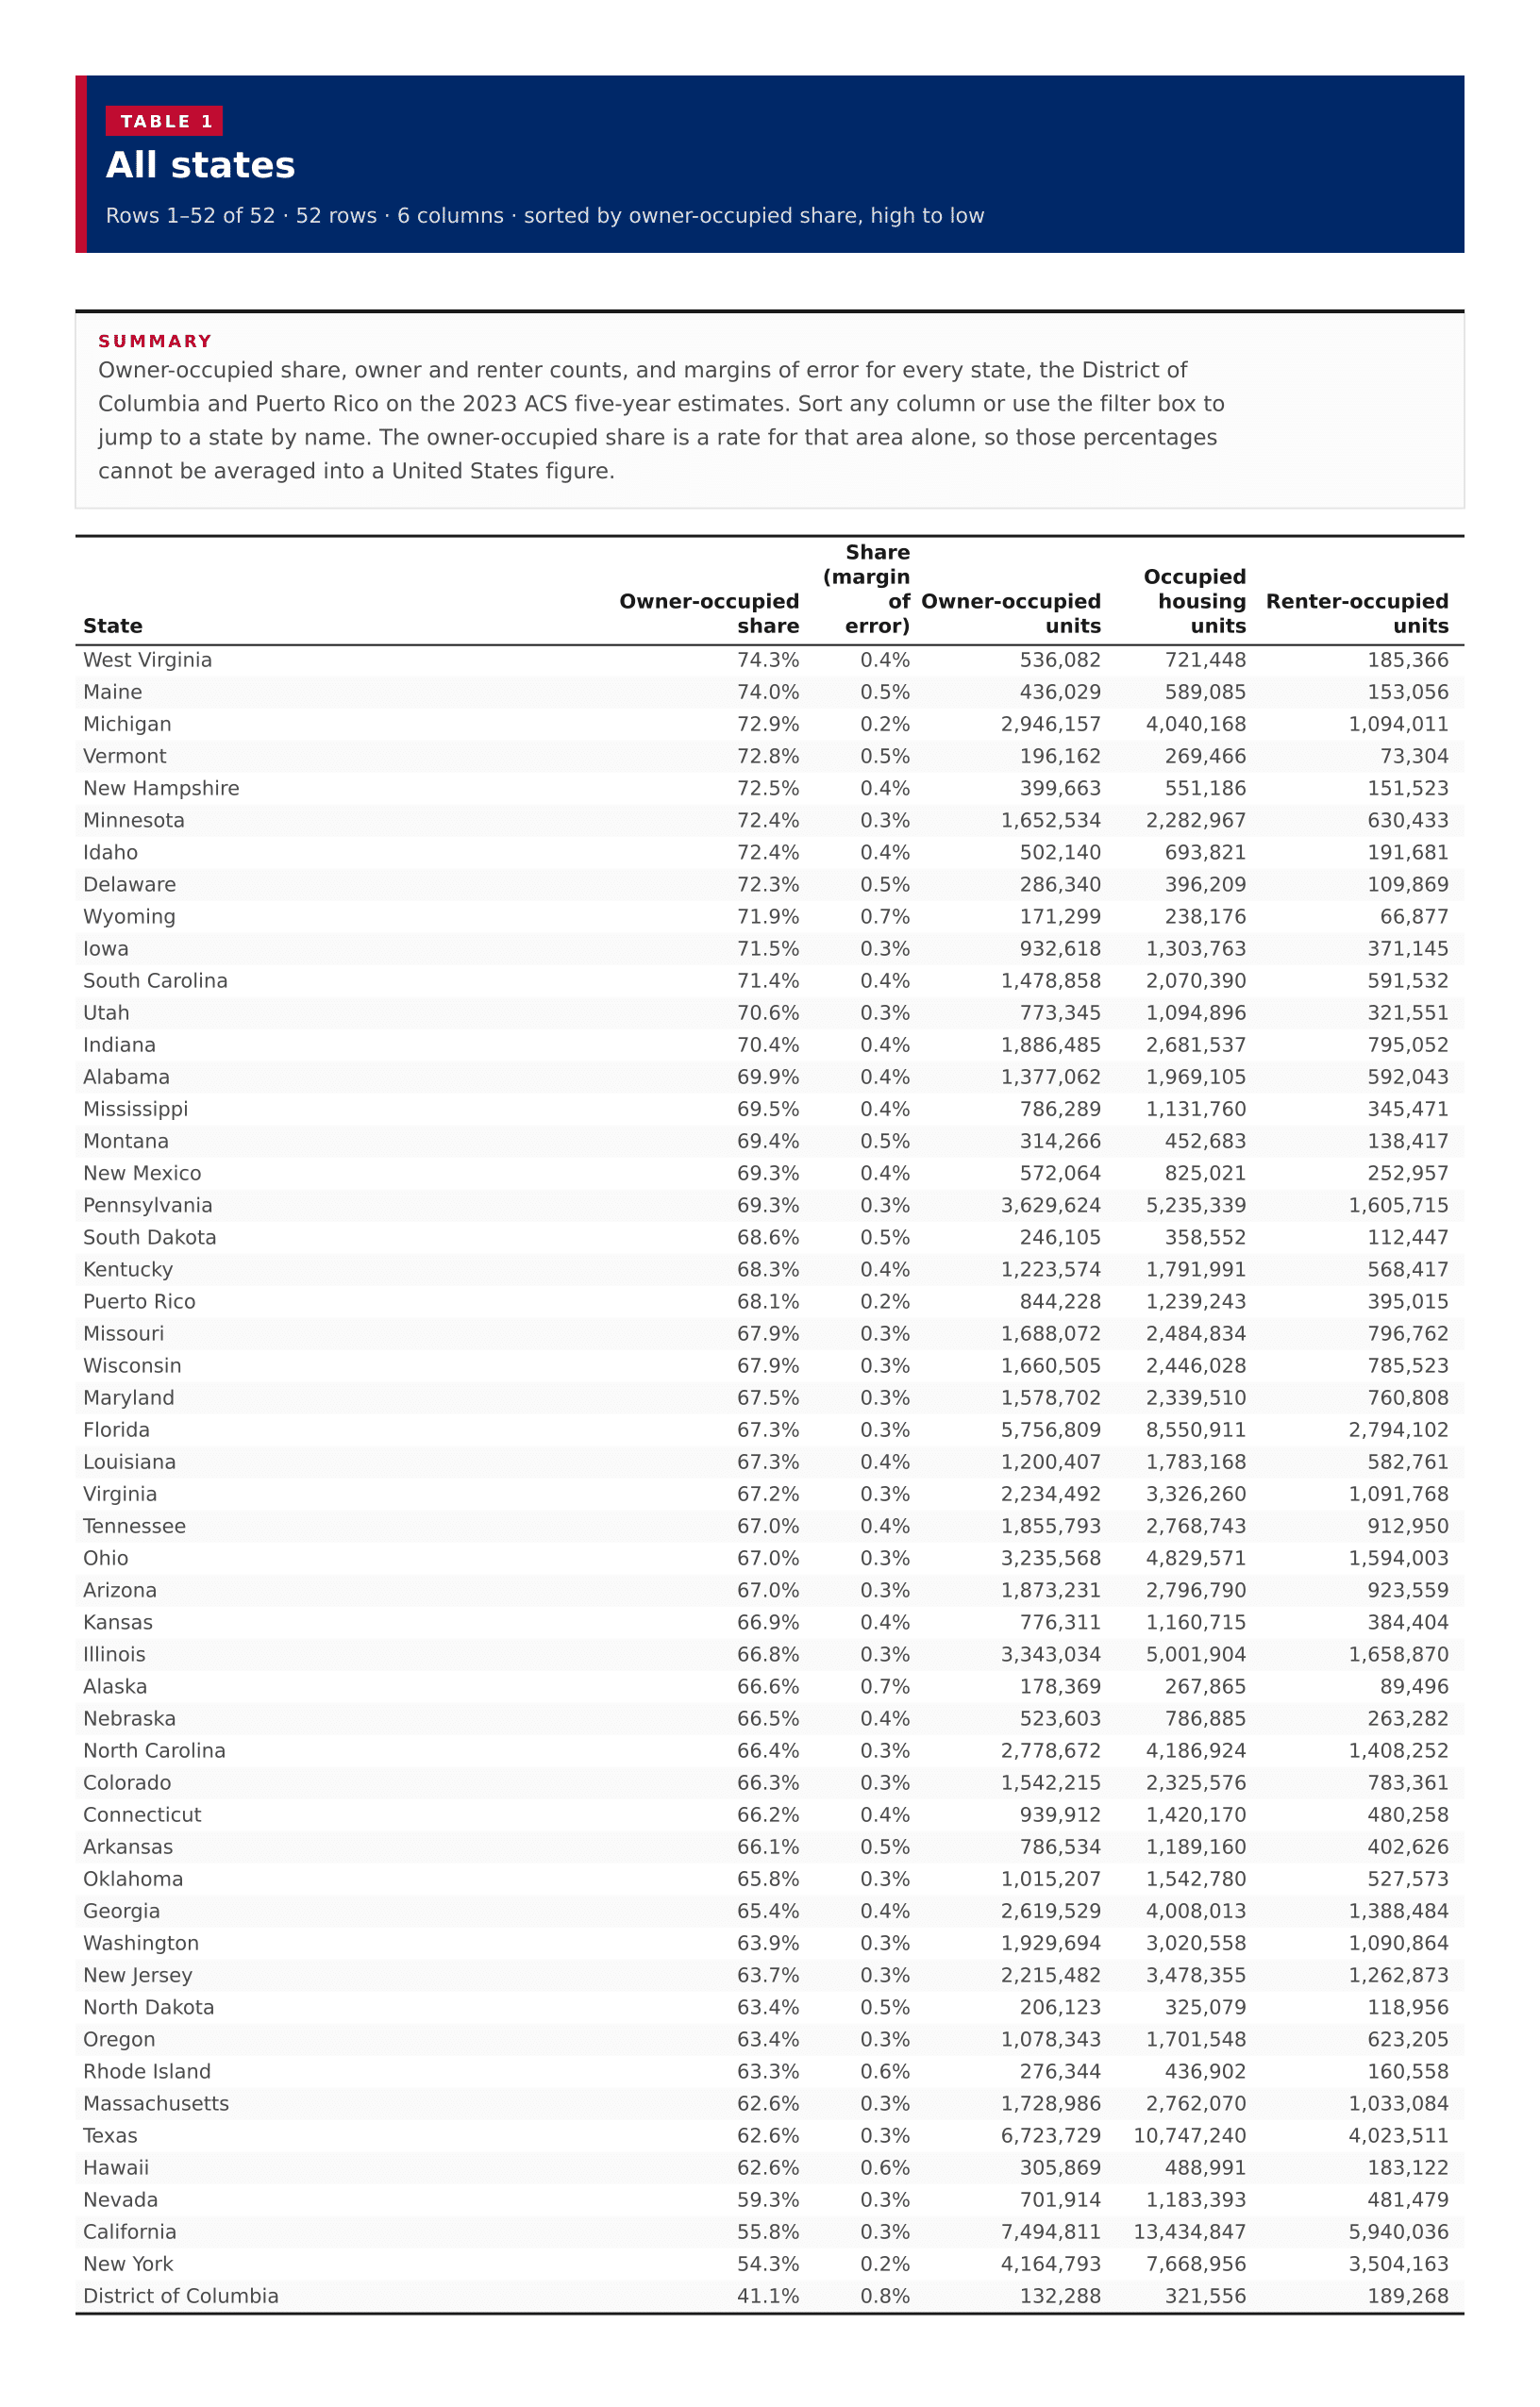
52 rows · 6 columns · sorted by owner-occupied share, high to low
Owner-occupied share, owner and renter counts, and margins of error for every state, the District of Columbia and Puerto Rico on the 2023 ACS five-year estimates. Sort any column or use the filter box to jump to a state by name. The owner-occupied share is a rate for that area alone, so those percentages cannot be averaged into a United States figure.
| ? | ? | ? | ? | ? | |
|---|---|---|---|---|---|
| West Virginia | 74.3% | 0.4% | 536,082 | 721,448 | 185,366 |
| Maine | 74.0% | 0.5% | 436,029 | 589,085 | 153,056 |
| Michigan | 72.9% | 0.2% | 2,946,157 | 4,040,168 | 1,094,011 |
| Vermont | 72.8% | 0.5% | 196,162 | 269,466 | 73,304 |
| New Hampshire | 72.5% | 0.4% | 399,663 | 551,186 | 151,523 |
| Minnesota | 72.4% | 0.3% | 1,652,534 | 2,282,967 | 630,433 |
| Idaho | 72.4% | 0.4% | 502,140 | 693,821 | 191,681 |
| Delaware | 72.3% | 0.5% | 286,340 | 396,209 | 109,869 |
| Wyoming | 71.9% | 0.7% | 171,299 | 238,176 | 66,877 |
| Iowa | 71.5% | 0.3% | 932,618 | 1,303,763 | 371,145 |
| South Carolina | 71.4% | 0.4% | 1,478,858 | 2,070,390 | 591,532 |
| Utah | 70.6% | 0.3% | 773,345 | 1,094,896 | 321,551 |
| Indiana | 70.4% | 0.4% | 1,886,485 | 2,681,537 | 795,052 |
| Alabama | 69.9% | 0.4% | 1,377,062 | 1,969,105 | 592,043 |
| Mississippi | 69.5% | 0.4% | 786,289 | 1,131,760 | 345,471 |
| Montana | 69.4% | 0.5% | 314,266 | 452,683 | 138,417 |
| New Mexico | 69.3% | 0.4% | 572,064 | 825,021 | 252,957 |
| Pennsylvania | 69.3% | 0.3% | 3,629,624 | 5,235,339 | 1,605,715 |
| South Dakota | 68.6% | 0.5% | 246,105 | 358,552 | 112,447 |
| Kentucky | 68.3% | 0.4% | 1,223,574 | 1,791,991 | 568,417 |
| Puerto Rico | 68.1% | 0.2% | 844,228 | 1,239,243 | 395,015 |
| Missouri | 67.9% | 0.3% | 1,688,072 | 2,484,834 | 796,762 |
| Wisconsin | 67.9% | 0.3% | 1,660,505 | 2,446,028 | 785,523 |
| Maryland | 67.5% | 0.3% | 1,578,702 | 2,339,510 | 760,808 |
| Florida | 67.3% | 0.3% | 5,756,809 | 8,550,911 | 2,794,102 |
| Louisiana | 67.3% | 0.4% | 1,200,407 | 1,783,168 | 582,761 |
| Virginia | 67.2% | 0.3% | 2,234,492 | 3,326,260 | 1,091,768 |
| Tennessee | 67.0% | 0.4% | 1,855,793 | 2,768,743 | 912,950 |
| Ohio | 67.0% | 0.3% | 3,235,568 | 4,829,571 | 1,594,003 |
| Arizona | 67.0% | 0.3% | 1,873,231 | 2,796,790 | 923,559 |
| Kansas | 66.9% | 0.4% | 776,311 | 1,160,715 | 384,404 |
| Illinois | 66.8% | 0.3% | 3,343,034 | 5,001,904 | 1,658,870 |
| Alaska | 66.6% | 0.7% | 178,369 | 267,865 | 89,496 |
| Nebraska | 66.5% | 0.4% | 523,603 | 786,885 | 263,282 |
| North Carolina | 66.4% | 0.3% | 2,778,672 | 4,186,924 | 1,408,252 |
| Colorado | 66.3% | 0.3% | 1,542,215 | 2,325,576 | 783,361 |
| Connecticut | 66.2% | 0.4% | 939,912 | 1,420,170 | 480,258 |
| Arkansas | 66.1% | 0.5% | 786,534 | 1,189,160 | 402,626 |
| Oklahoma | 65.8% | 0.3% | 1,015,207 | 1,542,780 | 527,573 |
| Georgia | 65.4% | 0.4% | 2,619,529 | 4,008,013 | 1,388,484 |
| Washington | 63.9% | 0.3% | 1,929,694 | 3,020,558 | 1,090,864 |
| New Jersey | 63.7% | 0.3% | 2,215,482 | 3,478,355 | 1,262,873 |
| North Dakota | 63.4% | 0.5% | 206,123 | 325,079 | 118,956 |
| Oregon | 63.4% | 0.3% | 1,078,343 | 1,701,548 | 623,205 |
| Rhode Island | 63.3% | 0.6% | 276,344 | 436,902 | 160,558 |
| Massachusetts | 62.6% | 0.3% | 1,728,986 | 2,762,070 | 1,033,084 |
| Texas | 62.6% | 0.3% | 6,723,729 | 10,747,240 | 4,023,511 |
| Hawaii | 62.6% | 0.6% | 305,869 | 488,991 | 183,122 |
| Nevada | 59.3% | 0.3% | 701,914 | 1,183,393 | 481,479 |
| California | 55.8% | 0.3% | 7,494,811 | 13,434,847 | 5,940,036 |
| New York | 54.3% | 0.2% | 4,164,793 | 7,668,956 | 3,504,163 |
| District of Columbia | 41.1% | 0.8% | 132,288 | 321,556 | 189,268 |