Figure 1
Households with a vehicle, US states
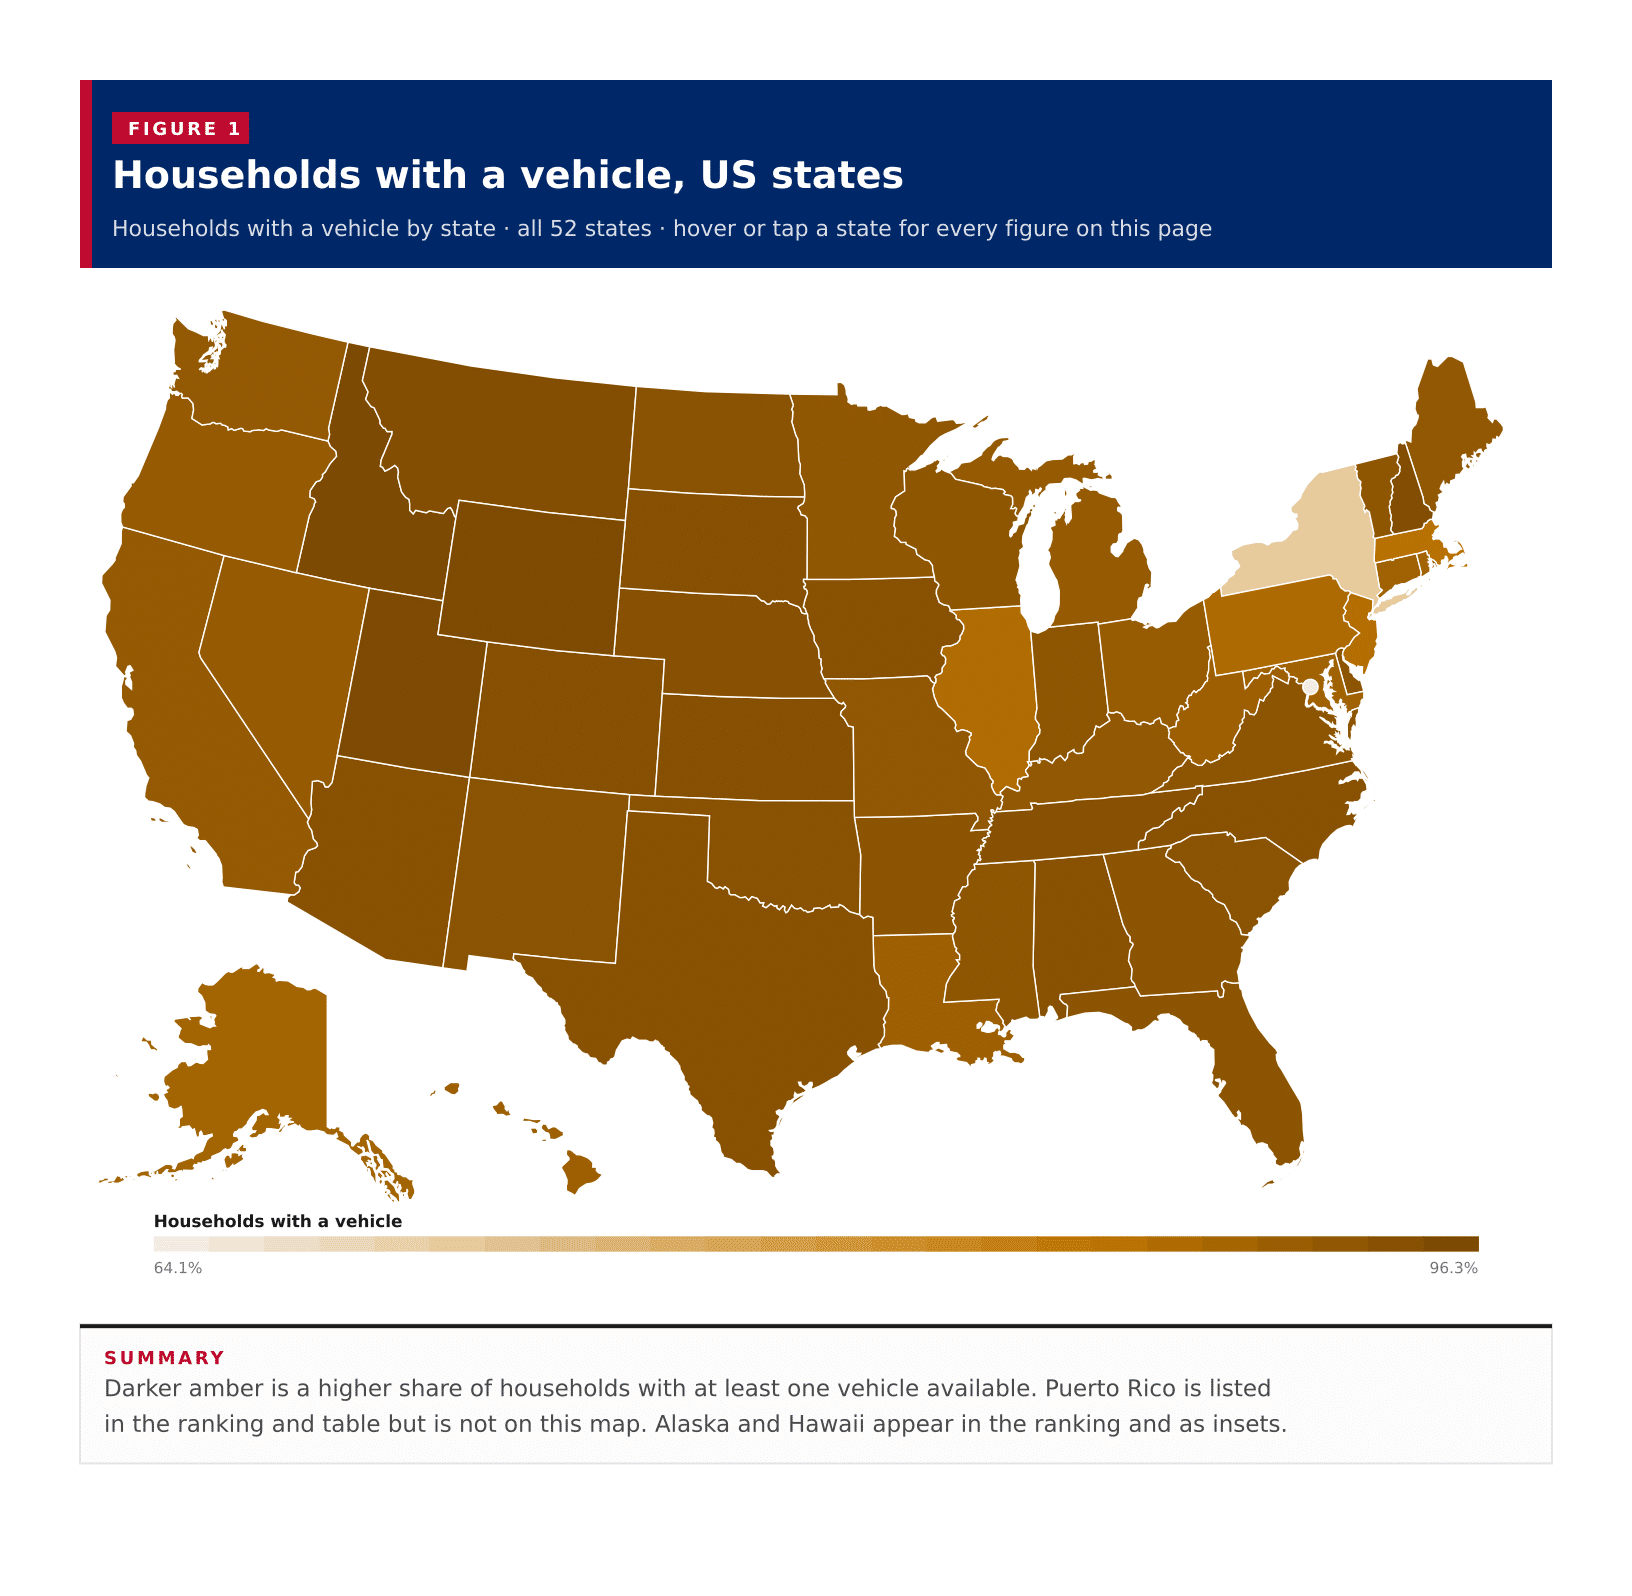
Households with a vehicle by state · all 52 states · hover or tap a state for every figure on this page
A typical published area has 93.8% of households with at least one vehicle, the midpoint of the 50 states, the District of Columbia and Puerto Rico on the 2023 ACS five-year estimates. Idaho leads at 96.3%, with Utah, Wyoming, New Hampshire and Montana also at or above 95 percent. New York is the lowest of the 50 states at 71.0%, and the District of Columbia sits lower still at 64.1%, where more than one in three households has no vehicle available. These are household shares for each area, not a national average of state rates.
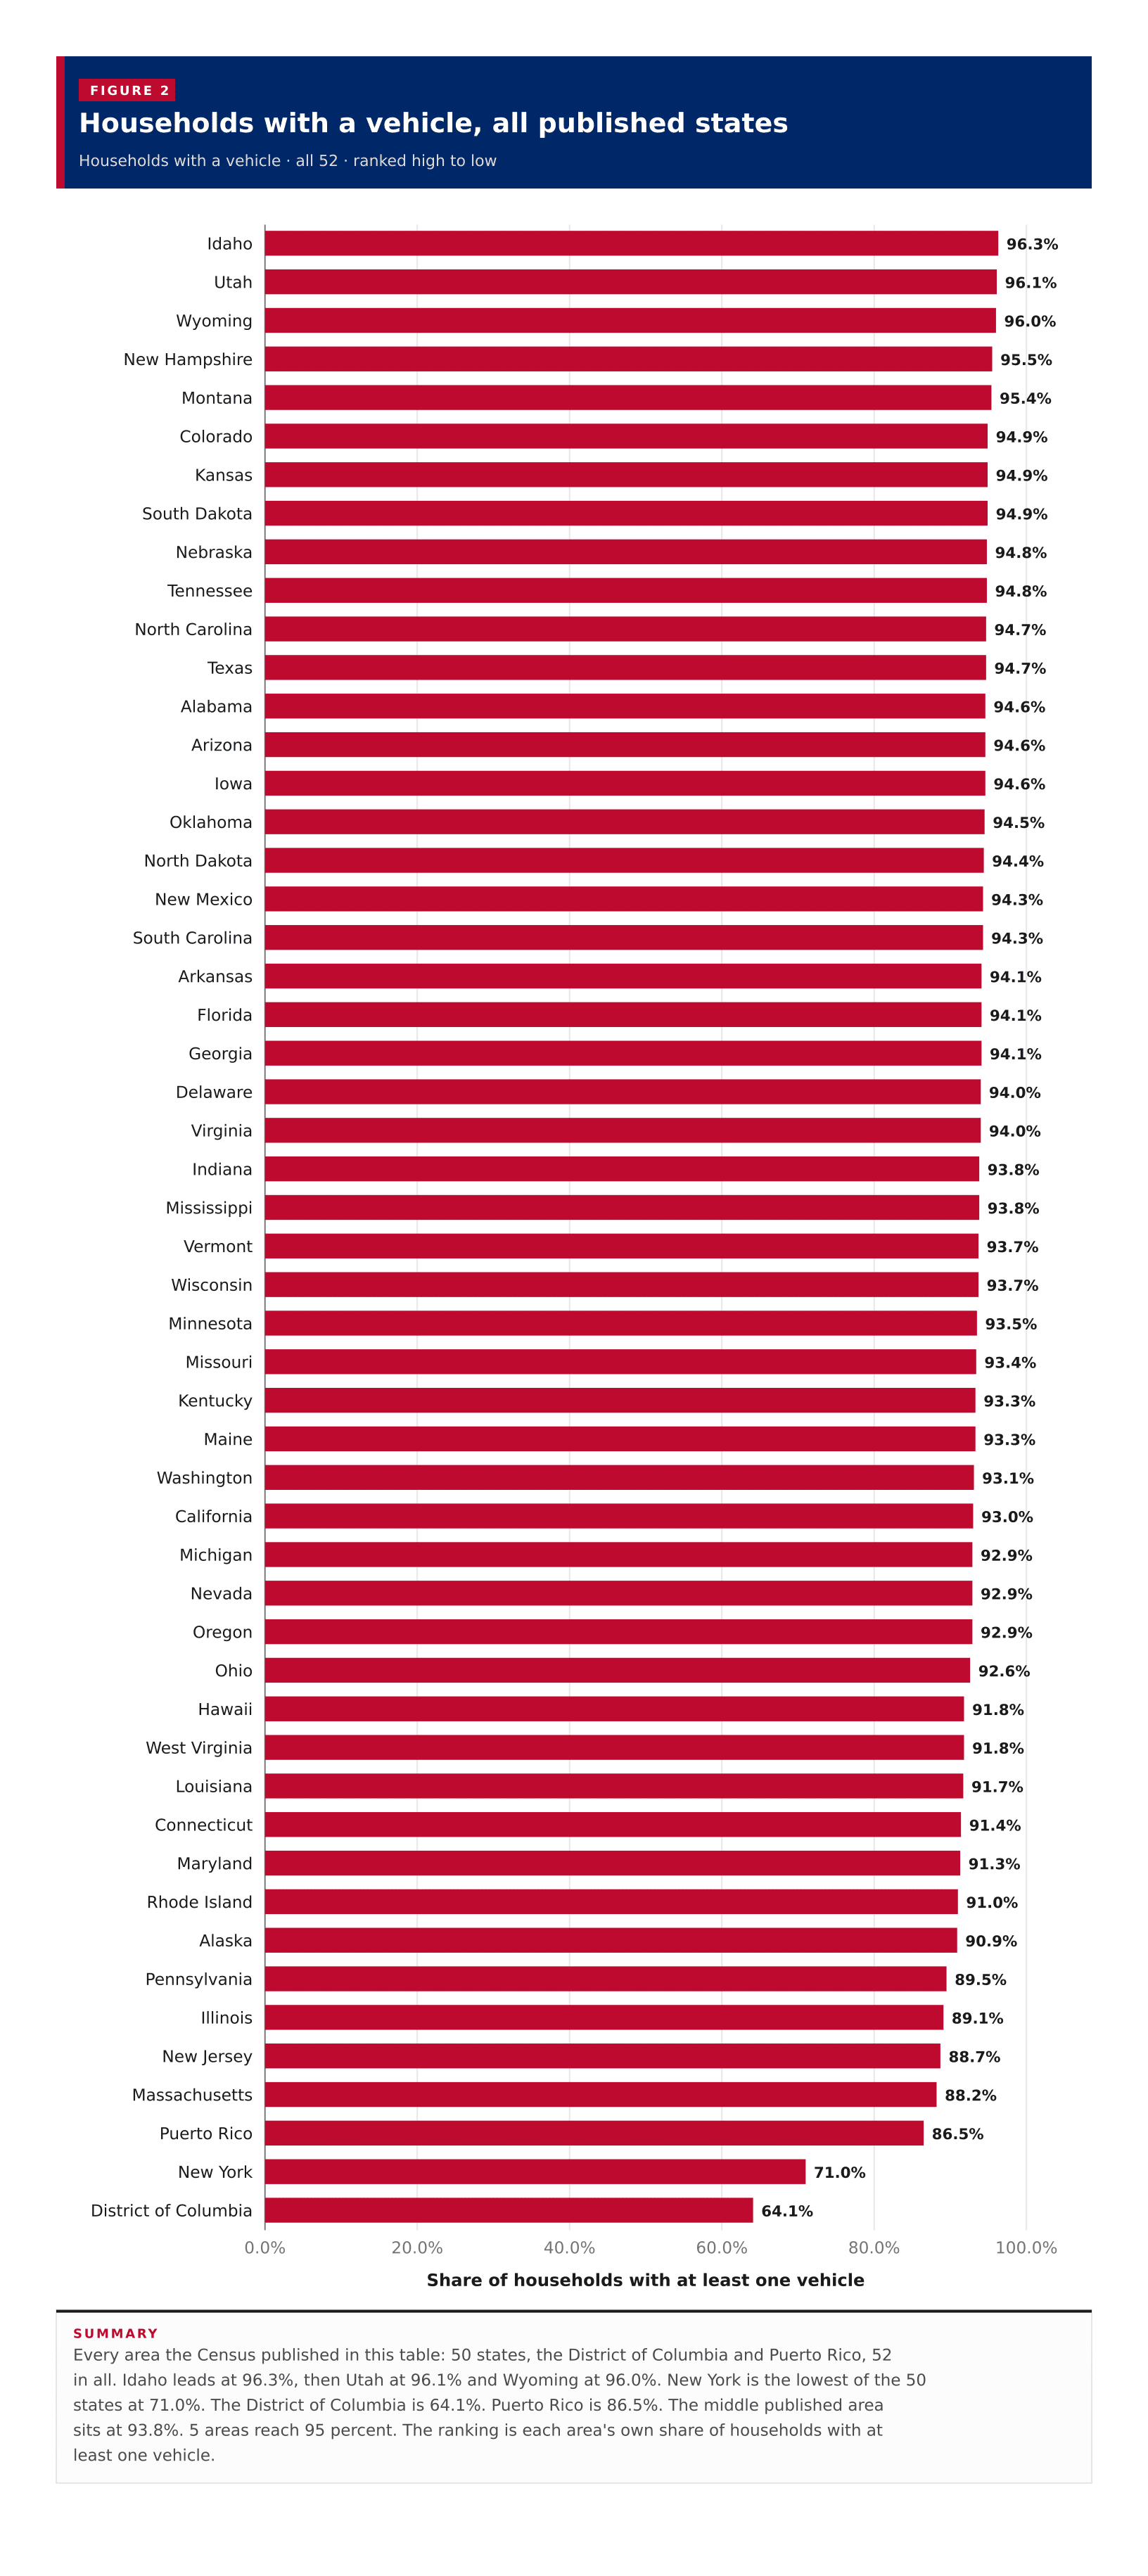
Households with a vehicle · all 52 · ranked high to low
Every area the Census published in this table: 50 states, the District of Columbia and Puerto Rico, 52 in all. Idaho leads at 96.3%, then Utah at 96.1% and Wyoming at 96.0%. New York is the lowest of the 50 states at 71.0%. The District of Columbia is 64.1%. Puerto Rico is 86.5%. The middle published area sits at 93.8%. 5 areas reach 95 percent. The ranking is each area's own share of households with at least one vehicle.
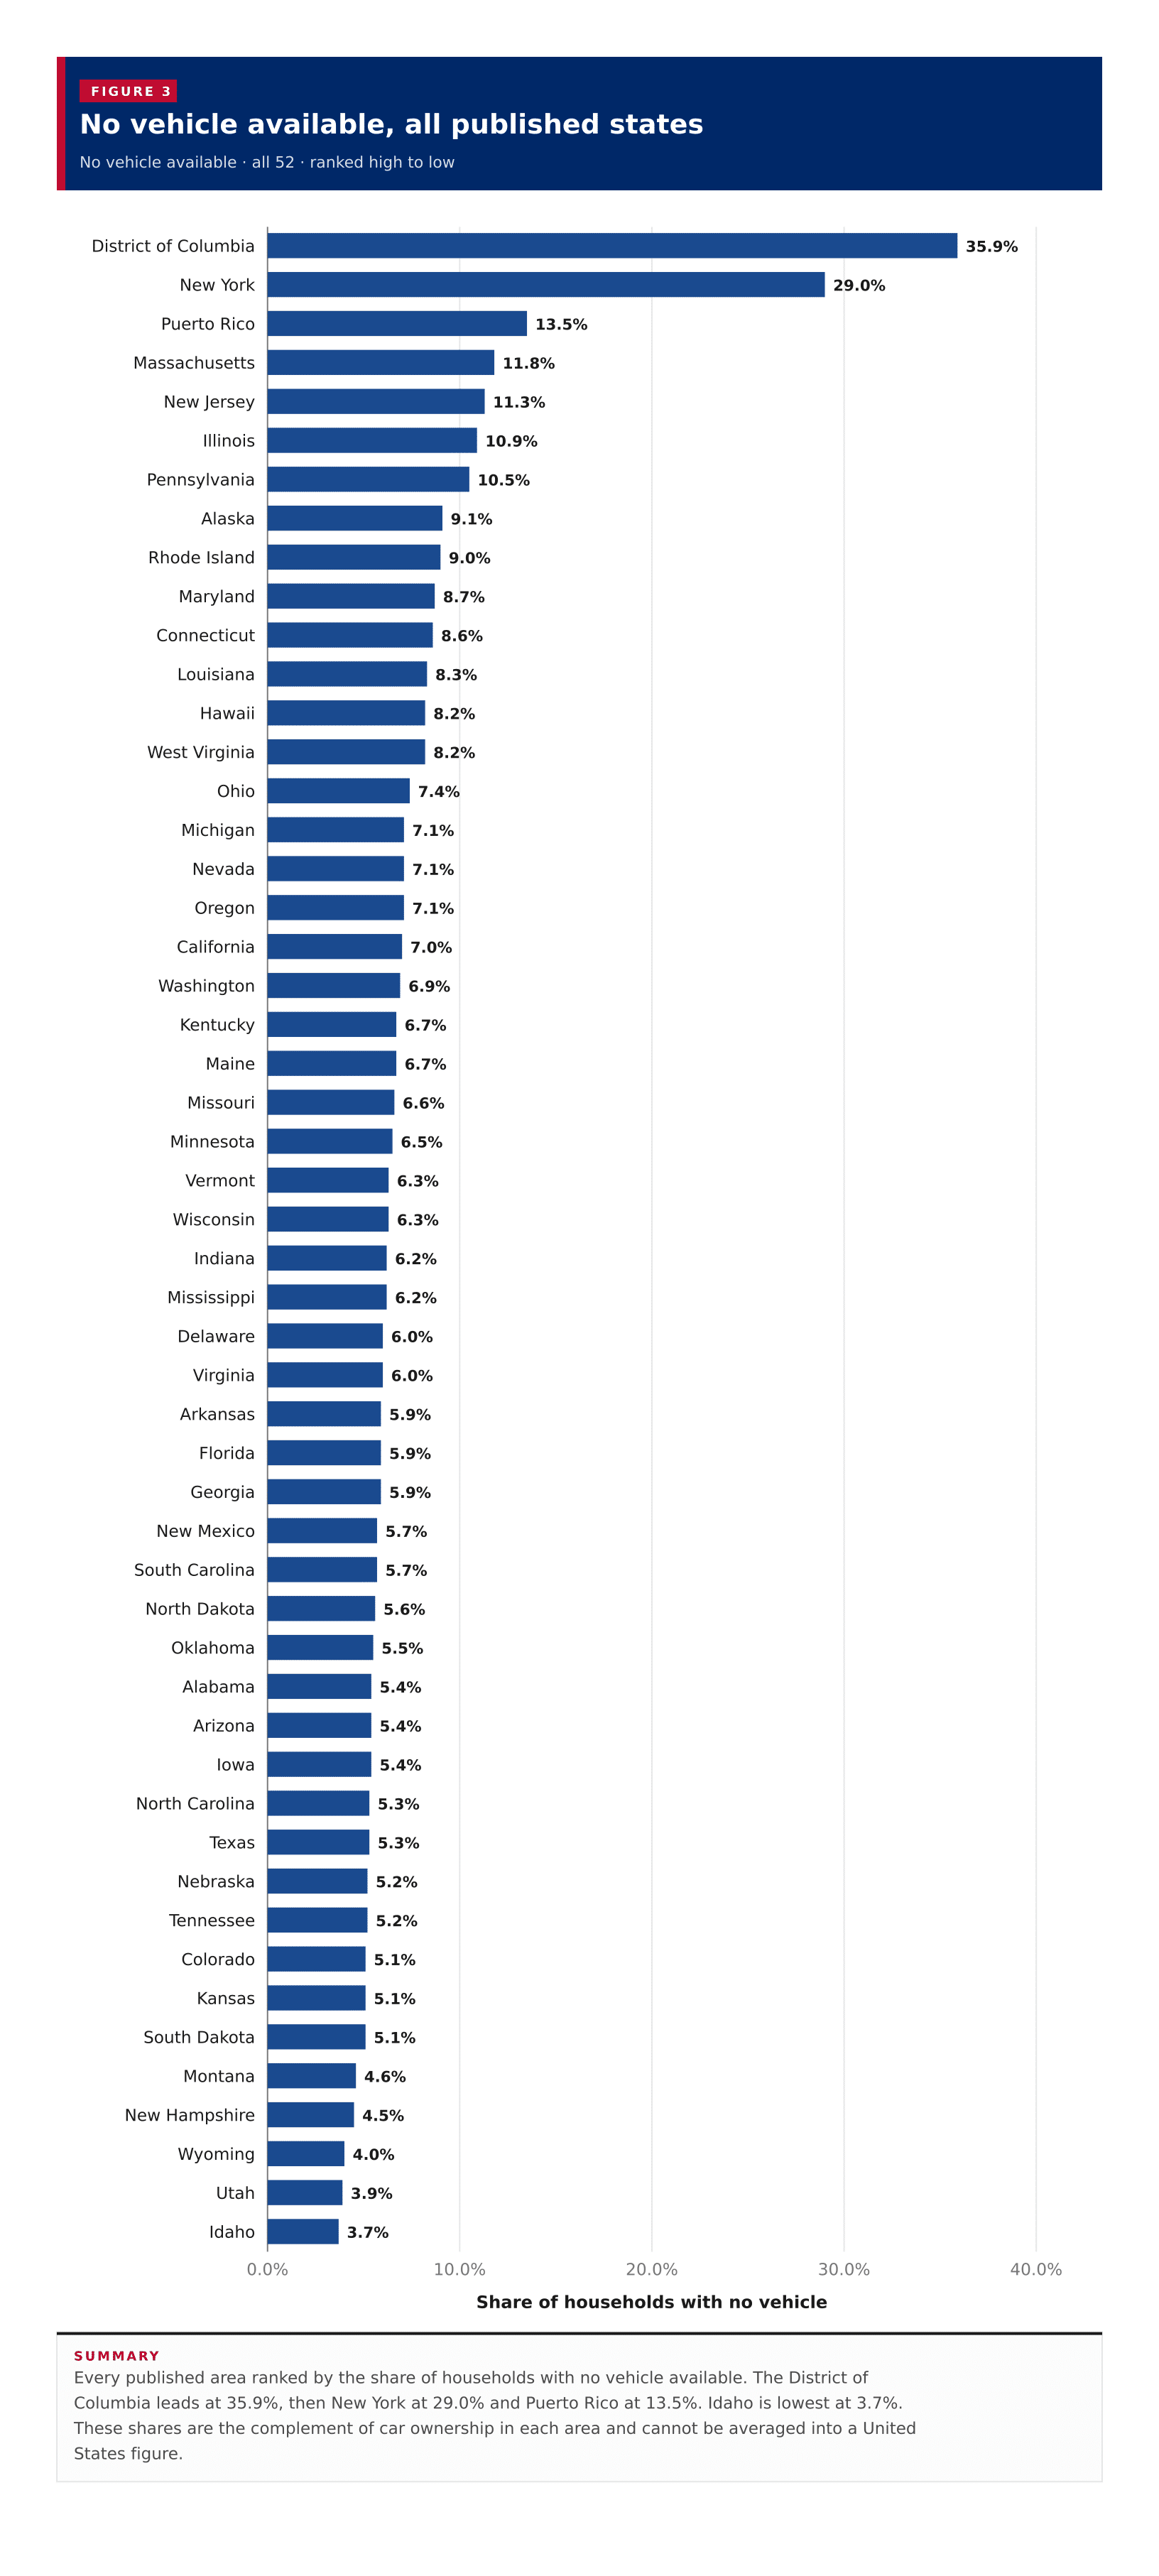
No vehicle available · all 52 · ranked high to low
Every published area ranked by the share of households with no vehicle available. The District of Columbia leads at 35.9%, then New York at 29.0% and Puerto Rico at 13.5%. Idaho is lowest at 3.7%. These shares are the complement of car ownership in each area and cannot be averaged into a United States figure.
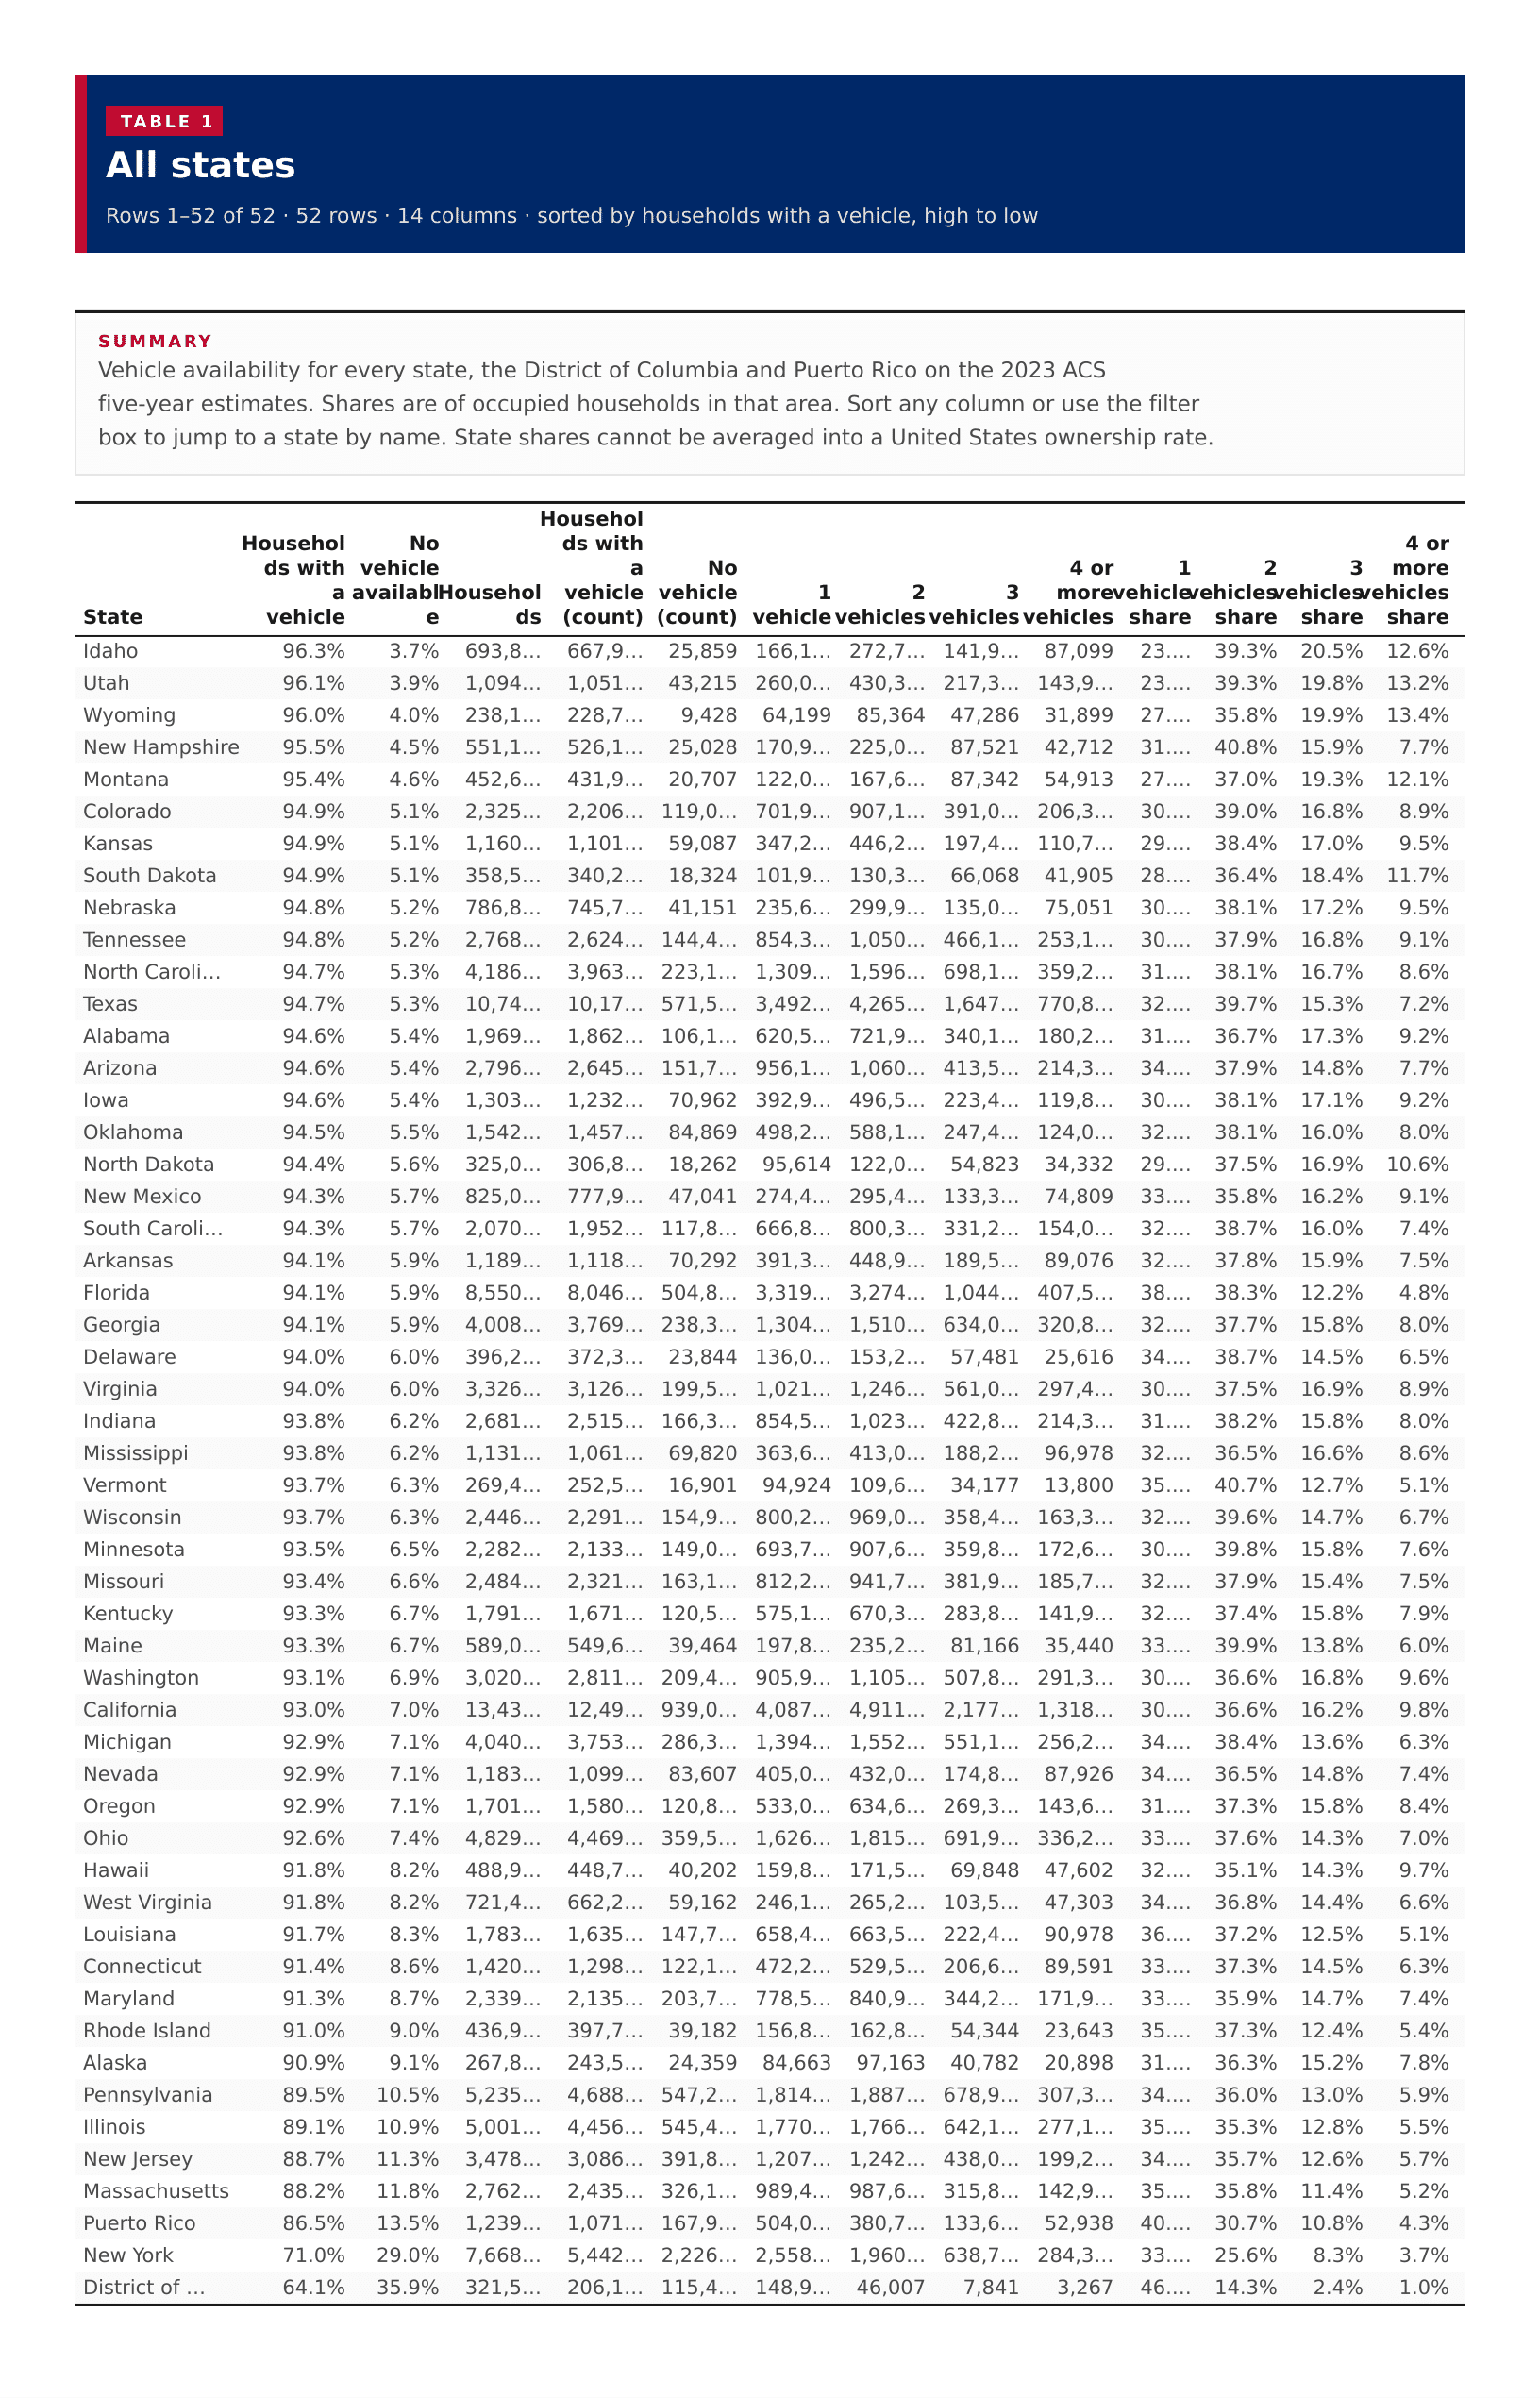
52 rows · 14 columns · sorted by households with a vehicle, high to low
Vehicle availability for every state, the District of Columbia and Puerto Rico on the 2023 ACS five-year estimates. Shares are of occupied households in that area. Sort any column or use the filter box to jump to a state by name. State shares cannot be averaged into a United States ownership rate.
| ? | ? | ? | ? | ? | ? | ? | ? | ? | |||||
|---|---|---|---|---|---|---|---|---|---|---|---|---|---|
| Idaho | 96.3% | 3.7% | 693,821 | 667,962 | 25,859 | 166,158 | 272,711 | 141,994 | 87,099 | 23.9% | 39.3% | 20.5% | 12.6% |
| Utah | 96.1% | 3.9% | 1,094,896 | 1,051,681 | 43,215 | 260,023 | 430,334 | 217,330 | 143,994 | 23.7% | 39.3% | 19.8% | 13.2% |
| Wyoming | 96.0% | 4.0% | 238,176 | 228,748 | 9,428 | 64,199 | 85,364 | 47,286 | 31,899 | 27.0% | 35.8% | 19.9% | 13.4% |
| New Hampshire | 95.5% | 4.5% | 551,186 | 526,158 | 25,028 | 170,913 | 225,012 | 87,521 | 42,712 | 31.0% | 40.8% | 15.9% | 7.7% |
| Montana | 95.4% | 4.6% | 452,683 | 431,976 | 20,707 | 122,057 | 167,664 | 87,342 | 54,913 | 27.0% | 37.0% | 19.3% | 12.1% |
| Colorado | 94.9% | 5.1% | 2,325,576 | 2,206,549 | 119,027 | 701,994 | 907,159 | 391,094 | 206,302 | 30.2% | 39.0% | 16.8% | 8.9% |
| Kansas | 94.9% | 5.1% | 1,160,715 | 1,101,628 | 59,087 | 347,235 | 446,215 | 197,431 | 110,747 | 29.9% | 38.4% | 17.0% | 9.5% |
| South Dakota | 94.9% | 5.1% | 358,552 | 340,228 | 18,324 | 101,919 | 130,336 | 66,068 | 41,905 | 28.4% | 36.4% | 18.4% | 11.7% |
| Nebraska | 94.8% | 5.2% | 786,885 | 745,734 | 41,151 | 235,676 | 299,908 | 135,099 | 75,051 | 30.0% | 38.1% | 17.2% | 9.5% |
| Tennessee | 94.8% | 5.2% | 2,768,743 | 2,624,334 | 144,409 | 854,398 | 1,050,626 | 466,164 | 253,146 | 30.9% | 37.9% | 16.8% | 9.1% |
| North Carolina | 94.7% | 5.3% | 4,186,924 | 3,963,798 | 223,126 | 1,309,872 | 1,596,527 | 698,187 | 359,212 | 31.3% | 38.1% | 16.7% | 8.6% |
| Texas | 94.7% | 5.3% | 10,747,240 | 10,175,662 | 571,578 | 3,492,470 | 4,265,271 | 1,647,091 | 770,830 | 32.5% | 39.7% | 15.3% | 7.2% |
| Alabama | 94.6% | 5.4% | 1,969,105 | 1,862,950 | 106,155 | 620,520 | 721,995 | 340,161 | 180,274 | 31.5% | 36.7% | 17.3% | 9.2% |
| Arizona | 94.6% | 5.4% | 2,796,790 | 2,645,014 | 151,776 | 956,162 | 1,060,967 | 413,518 | 214,367 | 34.2% | 37.9% | 14.8% | 7.7% |
| Iowa | 94.6% | 5.4% | 1,303,763 | 1,232,801 | 70,962 | 392,916 | 496,541 | 223,476 | 119,868 | 30.1% | 38.1% | 17.1% | 9.2% |
| Oklahoma | 94.5% | 5.5% | 1,542,780 | 1,457,911 | 84,869 | 498,299 | 588,167 | 247,434 | 124,011 | 32.3% | 38.1% | 16.0% | 8.0% |
| North Dakota | 94.4% | 5.6% | 325,079 | 306,817 | 18,262 | 95,614 | 122,048 | 54,823 | 34,332 | 29.4% | 37.5% | 16.9% | 10.6% |
| New Mexico | 94.3% | 5.7% | 825,021 | 777,980 | 47,041 | 274,459 | 295,405 | 133,307 | 74,809 | 33.3% | 35.8% | 16.2% | 9.1% |
| South Carolina | 94.3% | 5.7% | 2,070,390 | 1,952,558 | 117,832 | 666,848 | 800,388 | 331,229 | 154,093 | 32.2% | 38.7% | 16.0% | 7.4% |
| Arkansas | 94.1% | 5.9% | 1,189,160 | 1,118,868 | 70,292 | 391,304 | 448,921 | 189,567 | 89,076 | 32.9% | 37.8% | 15.9% | 7.5% |
| Florida | 94.1% | 5.9% | 8,550,911 | 8,046,054 | 504,857 | 3,319,449 | 3,274,542 | 1,044,495 | 407,568 | 38.8% | 38.3% | 12.2% | 4.8% |
| Georgia | 94.1% | 5.9% | 4,008,013 | 3,769,619 | 238,394 | 1,304,567 | 1,510,217 | 634,024 | 320,811 | 32.5% | 37.7% | 15.8% | 8.0% |
| Delaware | 94.0% | 6.0% | 396,209 | 372,365 | 23,844 | 136,035 | 153,233 | 57,481 | 25,616 | 34.3% | 38.7% | 14.5% | 6.5% |
| Virginia | 94.0% | 6.0% | 3,326,260 | 3,126,731 | 199,529 | 1,021,700 | 1,246,573 | 561,042 | 297,416 | 30.7% | 37.5% | 16.9% | 8.9% |
| Indiana | 93.8% | 6.2% | 2,681,537 | 2,515,218 | 166,319 | 854,586 | 1,023,498 | 422,816 | 214,318 | 31.9% | 38.2% | 15.8% | 8.0% |
| Mississippi | 93.8% | 6.2% | 1,131,760 | 1,061,940 | 69,820 | 363,676 | 413,032 | 188,254 | 96,978 | 32.1% | 36.5% | 16.6% | 8.6% |
| Vermont | 93.7% | 6.3% | 269,466 | 252,565 | 16,901 | 94,924 | 109,664 | 34,177 | 13,800 | 35.2% | 40.7% | 12.7% | 5.1% |
| Wisconsin | 93.7% | 6.3% | 2,446,028 | 2,291,103 | 154,925 | 800,269 | 969,042 | 358,438 | 163,354 | 32.7% | 39.6% | 14.7% | 6.7% |
| Minnesota | 93.5% | 6.5% | 2,282,967 | 2,133,873 | 149,094 | 693,714 | 907,619 | 359,873 | 172,667 | 30.4% | 39.8% | 15.8% | 7.6% |
| Missouri | 93.4% | 6.6% | 2,484,834 | 2,321,656 | 163,178 | 812,258 | 941,714 | 381,944 | 185,740 | 32.7% | 37.9% | 15.4% | 7.5% |
| Kentucky | 93.3% | 6.7% | 1,791,991 | 1,671,445 | 120,546 | 575,190 | 670,380 | 283,879 | 141,996 | 32.1% | 37.4% | 15.8% | 7.9% |
| Maine | 93.3% | 6.7% | 589,085 | 549,621 | 39,464 | 197,804 | 235,211 | 81,166 | 35,440 | 33.6% | 39.9% | 13.8% | 6.0% |
| Washington | 93.1% | 6.9% | 3,020,558 | 2,811,075 | 209,483 | 905,970 | 1,105,946 | 507,809 | 291,350 | 30.0% | 36.6% | 16.8% | 9.6% |
| California | 93.0% | 7.0% | 13,434,847 | 12,495,826 | 939,021 | 4,087,643 | 4,911,533 | 2,177,847 | 1,318,803 | 30.4% | 36.6% | 16.2% | 9.8% |
| Michigan | 92.9% | 7.1% | 4,040,168 | 3,753,841 | 286,327 | 1,394,319 | 1,552,098 | 551,143 | 256,281 | 34.5% | 38.4% | 13.6% | 6.3% |
| Nevada | 92.9% | 7.1% | 1,183,393 | 1,099,786 | 83,607 | 405,018 | 432,003 | 174,839 | 87,926 | 34.2% | 36.5% | 14.8% | 7.4% |
| Oregon | 92.9% | 7.1% | 1,701,548 | 1,580,706 | 120,842 | 533,064 | 634,665 | 269,340 | 143,637 | 31.3% | 37.3% | 15.8% | 8.4% |
| Ohio | 92.6% | 7.4% | 4,829,571 | 4,469,989 | 359,582 | 1,626,215 | 1,815,557 | 691,927 | 336,290 | 33.7% | 37.6% | 14.3% | 7.0% |
| Hawaii | 91.8% | 8.2% | 488,991 | 448,789 | 40,202 | 159,805 | 171,534 | 69,848 | 47,602 | 32.7% | 35.1% | 14.3% | 9.7% |
| West Virginia | 91.8% | 8.2% | 721,448 | 662,286 | 59,162 | 246,181 | 265,228 | 103,574 | 47,303 | 34.1% | 36.8% | 14.4% | 6.6% |
| Louisiana | 91.7% | 8.3% | 1,783,168 | 1,635,387 | 147,781 | 658,435 | 663,534 | 222,440 | 90,978 | 36.9% | 37.2% | 12.5% | 5.1% |
| Connecticut | 91.4% | 8.6% | 1,420,170 | 1,298,057 | 122,113 | 472,282 | 529,564 | 206,620 | 89,591 | 33.3% | 37.3% | 14.5% | 6.3% |
| Maryland | 91.3% | 8.7% | 2,339,510 | 2,135,763 | 203,747 | 778,577 | 840,989 | 344,213 | 171,984 | 33.3% | 35.9% | 14.7% | 7.4% |
| Rhode Island | 91.0% | 9.0% | 436,902 | 397,720 | 39,182 | 156,844 | 162,889 | 54,344 | 23,643 | 35.9% | 37.3% | 12.4% | 5.4% |
| Alaska | 90.9% | 9.1% | 267,865 | 243,506 | 24,359 | 84,663 | 97,163 | 40,782 | 20,898 | 31.6% | 36.3% | 15.2% | 7.8% |
| Pennsylvania | 89.5% | 10.5% | 5,235,339 | 4,688,086 | 547,253 | 1,814,708 | 1,887,028 | 678,963 | 307,387 | 34.7% | 36.0% | 13.0% | 5.9% |
| Illinois | 89.1% | 10.9% | 5,001,904 | 4,456,479 | 545,425 | 1,770,902 | 1,766,275 | 642,174 | 277,128 | 35.4% | 35.3% | 12.8% | 5.5% |
| New Jersey | 88.7% | 11.3% | 3,478,355 | 3,086,513 | 391,842 | 1,207,026 | 1,242,133 | 438,077 | 199,277 | 34.7% | 35.7% | 12.6% | 5.7% |
| Massachusetts | 88.2% | 11.8% | 2,762,070 | 2,435,950 | 326,120 | 989,483 | 987,660 | 315,871 | 142,936 | 35.8% | 35.8% | 11.4% | 5.2% |
| Puerto Rico | 86.5% | 13.5% | 1,239,243 | 1,071,329 | 167,914 | 504,002 | 380,766 | 133,623 | 52,938 | 40.7% | 30.7% | 10.8% | 4.3% |
| New York | 71.0% | 29.0% | 7,668,956 | 5,442,633 | 2,226,323 | 2,558,625 | 1,960,852 | 638,782 | 284,374 | 33.4% | 25.6% | 8.3% | 3.7% |
| District of Columbia | 64.1% | 35.9% | 321,556 | 206,100 | 115,456 | 148,985 | 46,007 | 7,841 | 3,267 | 46.3% | 14.3% | 2.4% | 1.0% |