Health insurance by US city

Summary

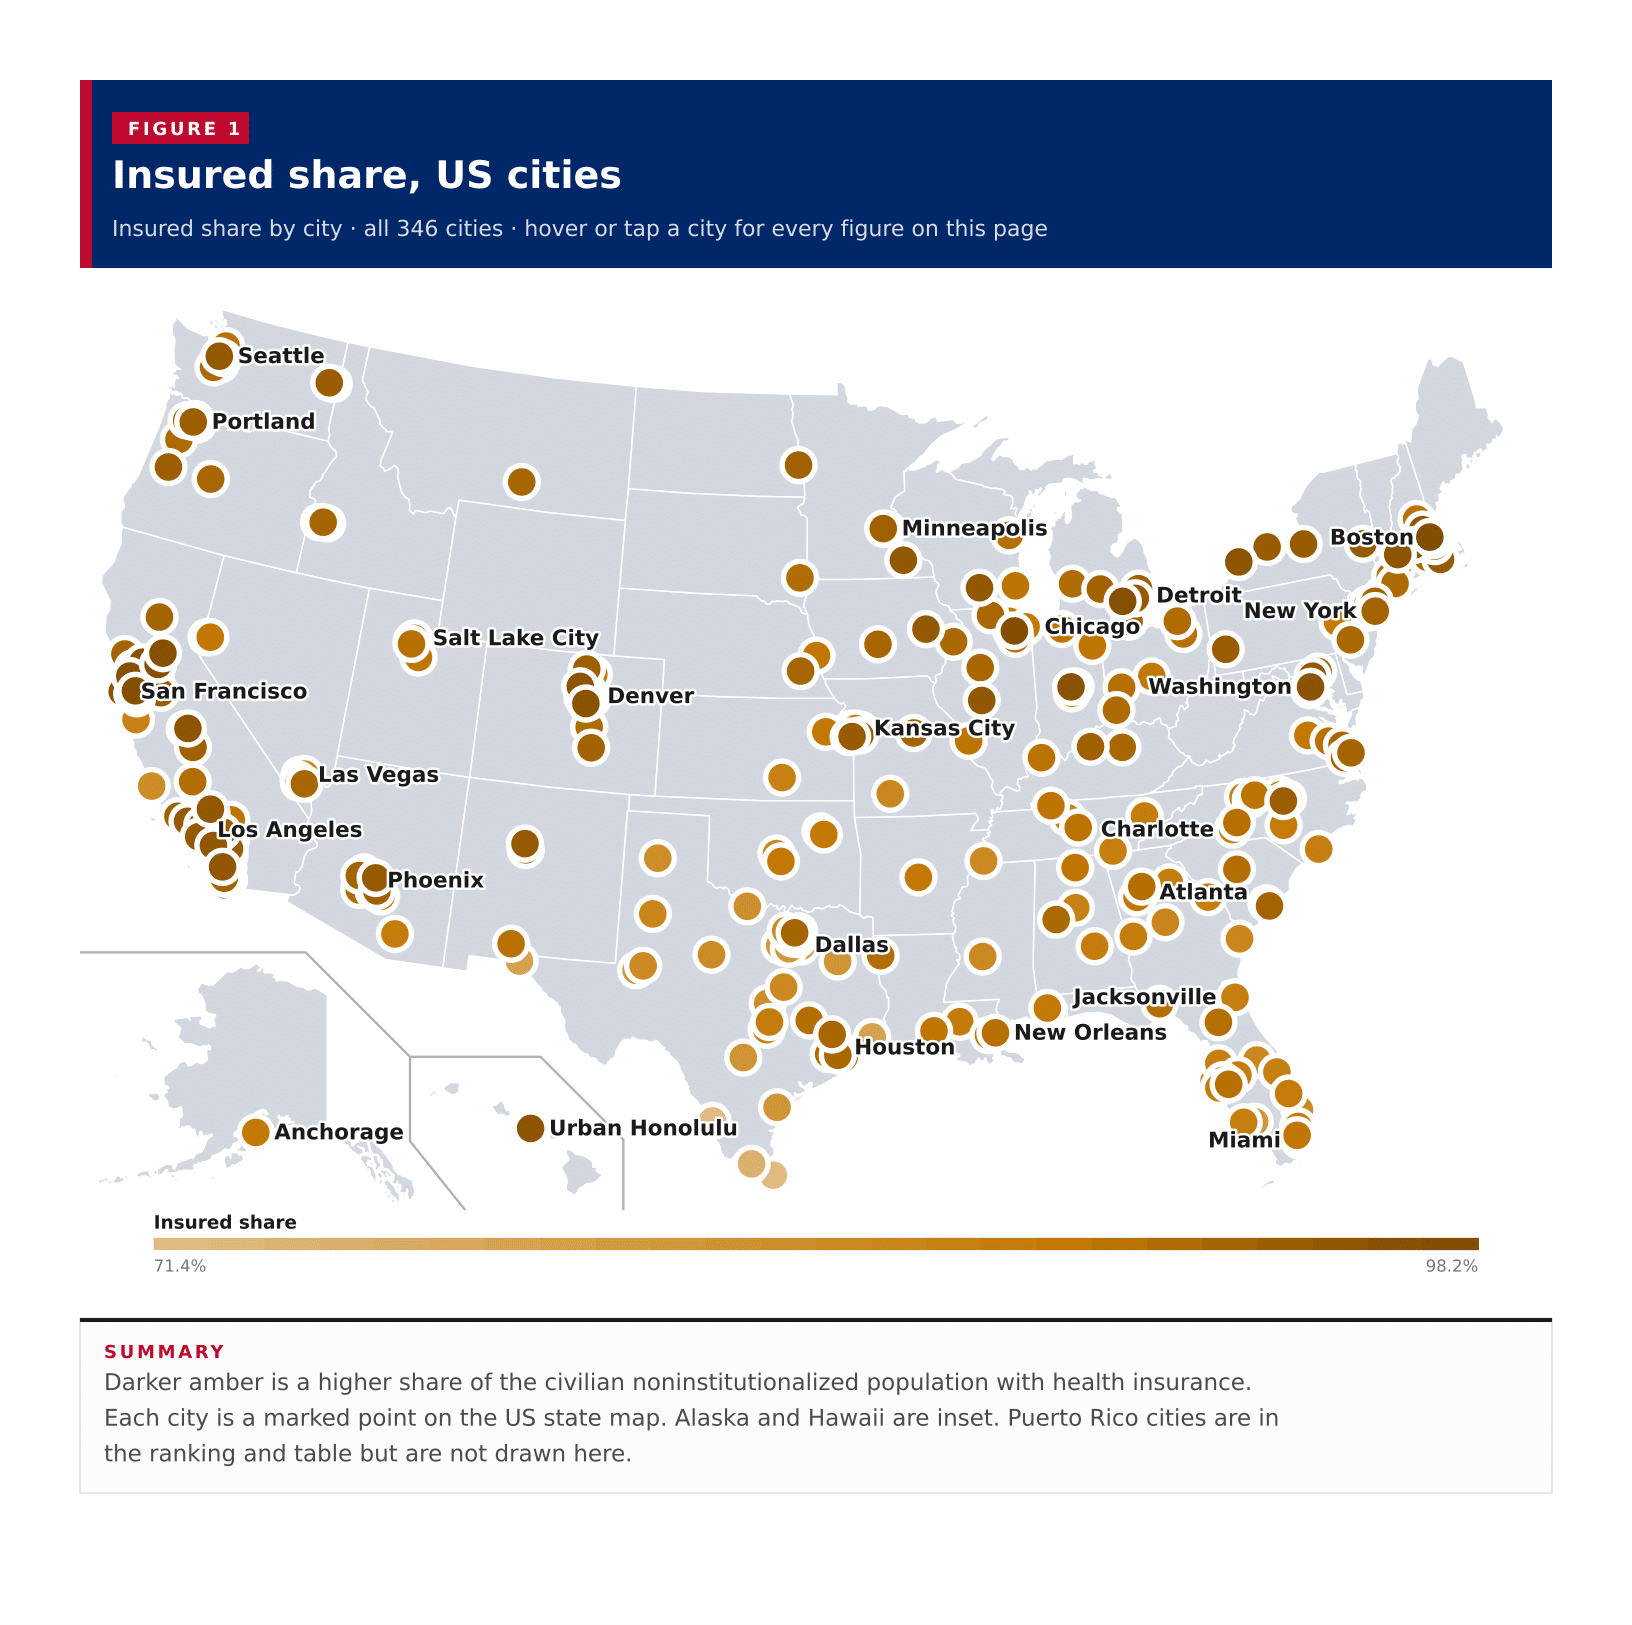
Insured share, US cities

Insured share by city · all 346 cities · hover or tap a city for every figure on this page

346 items
View100%
DownloadPDFImageCSV
CitiesCambridge, Massachusetts
Insured share, US citiesDarker amber is a higher share of the civilian noninstitutionalized population with health insurance. Each city is a marked point on the US state map. Alaska and Hawaii are inset. Puerto Rico cities are in the ranking and table but are not drawn here.Brownsville, Texas · Insured share: 71.4% · Uninsured share: 28.6% · Male insured share: 70.9% · Female insured share: 71.8% · With health insurance: 133,304 · No health insurance: 53,428 · Civilian noninstitutionalized population: 186,732 · Population: 188,023 · Insured margin of error: 2,770 · Uninsured margin of error: 1,951 · Coverage universe margin of error: 3,389 · Population margin of error: 90 · Males with health insurance: 63,715 · Females with health insurance: 69,589 · Male civilian noninstitutionalized population: 89,853 · Female civilian noninstitutionalized population: 96,879Laredo, Texas · Insured share: 71.6% · Uninsured share: 28.4% · Male insured share: 72.2% · Female insured share: 71.0% · With health insurance: 182,074 · No health insurance: 72,184 · Civilian noninstitutionalized population: 254,258 · Population: 255,949 · Insured margin of error: 2,532 · Uninsured margin of error: 2,251 · Coverage universe margin of error: 3,388 · Population margin of error: 41 · Males with health insurance: 90,750 · Females with health insurance: 91,324 · Male civilian noninstitutionalized population: 125,609 · Female civilian noninstitutionalized population: 128,649Pasadena, Texas · Insured share: 72.0% · Uninsured share: 28.0% · Male insured share: 71.3% · Female insured share: 72.6% · With health insurance: 106,825 · No health insurance: 41,592 · Civilian noninstitutionalized population: 148,417 · Population: 149,345 · Insured margin of error: 2,917 · Uninsured margin of error: 1,978 · Coverage universe margin of error: 3,524 · Population margin of error: 59 · Males with health insurance: 52,047 · Females with health insurance: 54,778 · Male civilian noninstitutionalized population: 72,980 · Female civilian noninstitutionalized population: 75,437Garland, Texas · Insured share: 74.2% · Uninsured share: 25.8% · Male insured share: 72.8% · Female insured share: 75.6% · With health insurance: 181,584 · No health insurance: 63,125 · Civilian noninstitutionalized population: 244,709 · Population: 245,298 · Insured margin of error: 3,993 · Uninsured margin of error: 2,853 · Coverage universe margin of error: 4,908 · Population margin of error: 145 · Males with health insurance: 88,191 · Females with health insurance: 93,393 · Male civilian noninstitutionalized population: 121,138 · Female civilian noninstitutionalized population: 123,571McAllen, Texas · Insured share: 74.2% · Uninsured share: 25.8% · Male insured share: 73.8% · Female insured share: 74.5% · With health insurance: 105,932 · No health insurance: 36,888 · Civilian noninstitutionalized population: 142,820 · Population: 143,789 · Insured margin of error: 2,792 · Uninsured margin of error: 1,991 · Coverage universe margin of error: 3,430 · Population margin of error: 56 · Males with health insurance: 52,170 · Females with health insurance: 53,762 · Male civilian noninstitutionalized population: 70,682 · Female civilian noninstitutionalized population: 72,138Edinburg, Texas · Insured share: 74.3% · Uninsured share: 25.7% · Male insured share: 74.6% · Female insured share: 74.1% · With health insurance: 73,213 · No health insurance: 25,283 · Civilian noninstitutionalized population: 98,496 · Population: 102,561 · Insured margin of error: 2,924 · Uninsured margin of error: 2,018 · Coverage universe margin of error: 3,553 · Population margin of error: 51 · Males with health insurance: 35,665 · Females with health insurance: 37,548 · Male civilian noninstitutionalized population: 47,805 · Female civilian noninstitutionalized population: 50,691Houston, Texas · Insured share: 76.0% · Uninsured share: 24.0% · Male insured share: 73.9% · Female insured share: 78.1% · With health insurance: 1,734,218 · No health insurance: 547,513 · Civilian noninstitutionalized population: 2,281,731 · Population: 2,300,419 · Insured margin of error: 10,737 · Uninsured margin of error: 7,541 · Coverage universe margin of error: 13,121 · Population margin of error: 172 · Males with health insurance: 831,061 · Females with health insurance: 903,157 · Male civilian noninstitutionalized population: 1,125,068 · Female civilian noninstitutionalized population: 1,156,663Dallas, Texas · Insured share: 77.0% · Uninsured share: 23.0% · Male insured share: 75.0% · Female insured share: 79.0% · With health insurance: 993,057 · No health insurance: 296,803 · Civilian noninstitutionalized population: 1,289,860 · Population: 1,299,553 · Insured margin of error: 7,980 · Uninsured margin of error: 5,262 · Coverage universe margin of error: 9,559 · Population margin of error: 141 · Males with health insurance: 480,169 · Females with health insurance: 512,888 · Male civilian noninstitutionalized population: 640,337 · Female civilian noninstitutionalized population: 649,523Elizabeth, New Jersey · Insured share: 77.1% · Uninsured share: 22.9% · Male insured share: 74.4% · Female insured share: 79.8% · With health insurance: 104,034 · No health insurance: 30,925 · Civilian noninstitutionalized population: 134,959 · Population: 135,887 · Insured margin of error: 2,365 · Uninsured margin of error: 1,676 · Coverage universe margin of error: 2,899 · Population margin of error: 79 · Males with health insurance: 50,301 · Females with health insurance: 53,733 · Male civilian noninstitutionalized population: 67,636 · Female civilian noninstitutionalized population: 67,323Irving, Texas · Insured share: 78.4% · Uninsured share: 21.6% · Male insured share: 77.8% · Female insured share: 79.0% · With health insurance: 199,360 · No health insurance: 54,998 · Civilian noninstitutionalized population: 254,358 · Population: 255,036 · Insured margin of error: 3,680 · Uninsured margin of error: 2,307 · Coverage universe margin of error: 4,343 · Population margin of error: 57 · Males with health insurance: 100,524 · Females with health insurance: 98,836 · Male civilian noninstitutionalized population: 129,232 · Female civilian noninstitutionalized population: 125,126Beaumont, Texas · Insured share: 78.5% · Uninsured share: 21.5% · Male insured share: 77.3% · Female insured share: 79.7% · With health insurance: 88,276 · No health insurance: 24,150 · Civilian noninstitutionalized population: 112,426 · Population: 113,710 · Insured margin of error: 2,160 · Uninsured margin of error: 1,438 · Coverage universe margin of error: 2,595 · Population margin of error: 63 · Males with health insurance: 42,607 · Females with health insurance: 45,669 · Male civilian noninstitutionalized population: 55,107 · Female civilian noninstitutionalized population: 57,319Mesquite, Texas · Insured share: 78.6% · Uninsured share: 21.4% · Male insured share: 77.0% · Female insured share: 80.0% · With health insurance: 116,506 · No health insurance: 31,770 · Civilian noninstitutionalized population: 148,276 · Population: 148,848 · Insured margin of error: 3,337 · Uninsured margin of error: 1,908 · Coverage universe margin of error: 3,844 · Population margin of error: 473 · Males with health insurance: 54,523 · Females with health insurance: 61,983 · Male civilian noninstitutionalized population: 70,814 · Female civilian noninstitutionalized population: 77,462Pompano Beach, Florida · Insured share: 78.9% · Uninsured share: 21.1% · Male insured share: 75.8% · Female insured share: 82.4% · With health insurance: 86,381 · No health insurance: 23,045 · Civilian noninstitutionalized population: 109,426 · Population: 112,212 · Insured margin of error: 2,667 · Uninsured margin of error: 1,668 · Coverage universe margin of error: 3,146 · Population margin of error: 80 · Males with health insurance: 43,383 · Females with health insurance: 42,998 · Male civilian noninstitutionalized population: 57,230 · Female civilian noninstitutionalized population: 52,196El Paso, Texas · Insured share: 79.0% · Uninsured share: 21.0% · Male insured share: 78.2% · Female insured share: 79.9% · With health insurance: 523,617 · No health insurance: 138,812 · Civilian noninstitutionalized population: 662,429 · Population: 678,147 · Insured margin of error: 4,721 · Uninsured margin of error: 3,440 · Coverage universe margin of error: 5,841 · Population margin of error: 153 · Males with health insurance: 250,758 · Females with health insurance: 272,859 · Male civilian noninstitutionalized population: 320,741 · Female civilian noninstitutionalized population: 341,688Miami Gardens, Florida · Insured share: 80.6% · Uninsured share: 19.4% · Male insured share: 79.0% · Female insured share: 82.2% · With health insurance: 89,626 · No health insurance: 21,529 · Civilian noninstitutionalized population: 111,155 · Population: 111,264 · Insured margin of error: 2,627 · Uninsured margin of error: 1,525 · Coverage universe margin of error: 3,037 · Population margin of error: 111 · Males with health insurance: 42,875 · Females with health insurance: 46,751 · Male civilian noninstitutionalized population: 54,299 · Female civilian noninstitutionalized population: 56,856Newark, New Jersey · Insured share: 80.9% · Uninsured share: 19.1% · Male insured share: 78.3% · Female insured share: 83.4% · With health insurance: 242,606 · No health insurance: 57,137 · Civilian noninstitutionalized population: 299,743 · Population: 307,188 · Insured margin of error: 3,888 · Uninsured margin of error: 2,264 · Coverage universe margin of error: 4,499 · Population margin of error: 49 · Males with health insurance: 113,628 · Females with health insurance: 128,978 · Male civilian noninstitutionalized population: 145,177 · Female civilian noninstitutionalized population: 154,566Paterson, New Jersey · Insured share: 80.9% · Uninsured share: 19.1% · Male insured share: 77.5% · Female insured share: 84.2% · With health insurance: 126,891 · No health insurance: 29,942 · Civilian noninstitutionalized population: 156,833 · Population: 157,660 · Insured margin of error: 2,343 · Uninsured margin of error: 1,559 · Coverage universe margin of error: 2,814 · Population margin of error: 137 · Males with health insurance: 59,716 · Females with health insurance: 67,175 · Male civilian noninstitutionalized population: 77,022 · Female civilian noninstitutionalized population: 79,811Arlington, Texas · Insured share: 81.3% · Uninsured share: 18.7% · Male insured share: 80.0% · Female insured share: 82.4% · With health insurance: 319,619 · No health insurance: 73,748 · Civilian noninstitutionalized population: 393,367 · Population: 394,769 · Insured margin of error: 4,641 · Uninsured margin of error: 2,788 · Coverage universe margin of error: 5,414 · Population margin of error: 103 · Males with health insurance: 154,757 · Females with health insurance: 164,862 · Male civilian noninstitutionalized population: 193,396 · Female civilian noninstitutionalized population: 199,971Fort Worth, Texas · Insured share: 81.4% · Uninsured share: 18.6% · Male insured share: 80.4% · Female insured share: 82.4% · With health insurance: 756,882 · No health insurance: 172,533 · Civilian noninstitutionalized population: 929,415 · Population: 941,311 · Insured margin of error: 7,022 · Uninsured margin of error: 4,311 · Coverage universe margin of error: 8,240 · Population margin of error: 527 · Males with health insurance: 364,941 · Females with health insurance: 391,941 · Male civilian noninstitutionalized population: 453,985 · Female civilian noninstitutionalized population: 475,430Kansas City, Kansas · Insured share: 81.6% · Uninsured share: 18.4% · Male insured share: 79.9% · Female insured share: 83.3% · With health insurance: 125,388 · No health insurance: 28,237 · Civilian noninstitutionalized population: 153,625 · Population: 154,776 · Insured margin of error: 1,560 · Uninsured margin of error: 1,201 · Coverage universe margin of error: 1,969 · Population margin of error: 26 · Males with health insurance: 61,523 · Females with health insurance: 63,865 · Male civilian noninstitutionalized population: 76,975 · Female civilian noninstitutionalized population: 76,650Grand Prairie, Texas · Insured share: 81.6% · Uninsured share: 18.4% · Male insured share: 80.5% · Female insured share: 82.8% · With health insurance: 161,709 · No health insurance: 36,380 · Civilian noninstitutionalized population: 198,089 · Population: 198,564 · Insured margin of error: 3,571 · Uninsured margin of error: 1,950 · Coverage universe margin of error: 4,069 · Population margin of error: 92 · Males with health insurance: 78,208 · Females with health insurance: 83,501 · Male civilian noninstitutionalized population: 97,212 · Female civilian noninstitutionalized population: 100,877Sunrise Manor, Nevada · Insured share: 81.9% · Uninsured share: 18.1% · Male insured share: 80.7% · Female insured share: 83.1% · With health insurance: 162,767 · No health insurance: 35,939 · Civilian noninstitutionalized population: 198,706 · Population: 199,099 · Insured margin of error: 3,268 · Uninsured margin of error: 1,748 · Coverage universe margin of error: 3,706 · Population margin of error: 3,940 · Males with health insurance: 78,627 · Females with health insurance: 84,140 · Male civilian noninstitutionalized population: 97,464 · Female civilian noninstitutionalized population: 101,242Lehigh Acres, Florida · Insured share: 82.1% · Uninsured share: 17.9% · Male insured share: 79.7% · Female insured share: 84.5% · With health insurance: 104,510 · No health insurance: 22,725 · Civilian noninstitutionalized population: 127,235 · Population: 127,391 · Insured margin of error: 2,624 · Uninsured margin of error: 1,488 · Coverage universe margin of error: 3,017 · Population margin of error: 3,339 · Males with health insurance: 49,356 · Females with health insurance: 55,154 · Male civilian noninstitutionalized population: 61,940 · Female civilian noninstitutionalized population: 65,295West Valley City, Utah · Insured share: 82.1% · Uninsured share: 17.9% · Male insured share: 81.0% · Female insured share: 83.2% · With health insurance: 112,873 · No health insurance: 24,575 · Civilian noninstitutionalized population: 137,448 · Population: 137,955 · Insured margin of error: 2,836 · Uninsured margin of error: 1,451 · Coverage universe margin of error: 3,186 · Population margin of error: 55 · Males with health insurance: 56,455 · Females with health insurance: 56,418 · Male civilian noninstitutionalized population: 69,656 · Female civilian noninstitutionalized population: 67,792Corpus Christi, Texas · Insured share: 82.2% · Uninsured share: 17.8% · Male insured share: 80.7% · Female insured share: 83.7% · With health insurance: 256,109 · No health insurance: 55,387 · Civilian noninstitutionalized population: 311,496 · Population: 317,383 · Insured margin of error: 2,690 · Uninsured margin of error: 2,016 · Coverage universe margin of error: 3,361 · Population margin of error: 78 · Males with health insurance: 124,043 · Females with health insurance: 132,066 · Male civilian noninstitutionalized population: 153,791 · Female civilian noninstitutionalized population: 157,705Odessa, Texas · Insured share: 82.2% · Uninsured share: 17.8% · Male insured share: 82.6% · Female insured share: 81.8% · With health insurance: 92,704 · No health insurance: 20,064 · Civilian noninstitutionalized population: 112,768 · Population: 114,080 · Insured margin of error: 2,452 · Uninsured margin of error: 1,454 · Coverage universe margin of error: 2,851 · Population margin of error: 49 · Males with health insurance: 46,998 · Females with health insurance: 45,706 · Male civilian noninstitutionalized population: 56,886 · Female civilian noninstitutionalized population: 55,882Tyler, Texas · Insured share: 82.2% · Uninsured share: 17.8% · Male insured share: 81.3% · Female insured share: 83.1% · With health insurance: 86,798 · No health insurance: 18,795 · Civilian noninstitutionalized population: 105,593 · Population: 107,718 · Insured margin of error: 2,136 · Uninsured margin of error: 1,237 · Coverage universe margin of error: 2,469 · Population margin of error: 63 · Males with health insurance: 41,073 · Females with health insurance: 45,725 · Male civilian noninstitutionalized population: 50,546 · Female civilian noninstitutionalized population: 55,047Miami, Florida · Insured share: 82.4% · Uninsured share: 17.6% · Male insured share: 79.8% · Female insured share: 85.0% · With health insurance: 363,353 · No health insurance: 77,600 · Civilian noninstitutionalized population: 440,953 · Population: 446,663 · Insured margin of error: 5,571 · Uninsured margin of error: 2,893 · Coverage universe margin of error: 6,277 · Population margin of error: 77 · Males with health insurance: 177,475 · Females with health insurance: 185,878 · Male civilian noninstitutionalized population: 222,383 · Female civilian noninstitutionalized population: 218,570San Antonio, Texas · Insured share: 82.5% · Uninsured share: 17.5% · Male insured share: 80.6% · Female insured share: 84.2% · With health insurance: 1,183,490 · No health insurance: 251,886 · Civilian noninstitutionalized population: 1,435,376 · Population: 1,458,954 · Insured margin of error: 7,430 · Uninsured margin of error: 4,910 · Coverage universe margin of error: 8,905 · Population margin of error: 118 · Males with health insurance: 569,651 · Females with health insurance: 613,839 · Male civilian noninstitutionalized population: 706,578 · Female civilian noninstitutionalized population: 728,798North Charleston, South Carolina · Insured share: 83.2% · Uninsured share: 16.8% · Male insured share: 80.6% · Female insured share: 85.6% · With health insurance: 93,311 · No health insurance: 18,904 · Civilian noninstitutionalized population: 112,215 · Population: 117,460 · Insured margin of error: 2,720 · Uninsured margin of error: 1,452 · Coverage universe margin of error: 3,083 · Population margin of error: 80 · Males with health insurance: 44,003 · Females with health insurance: 49,308 · Male civilian noninstitutionalized population: 54,584 · Female civilian noninstitutionalized population: 57,631Hollywood, Florida · Insured share: 83.3% · Uninsured share: 16.7% · Male insured share: 81.3% · Female insured share: 85.3% · With health insurance: 126,335 · No health insurance: 25,383 · Civilian noninstitutionalized population: 151,718 · Population: 152,935 · Insured margin of error: 3,025 · Uninsured margin of error: 1,805 · Coverage universe margin of error: 3,523 · Population margin of error: 60 · Males with health insurance: 62,555 · Females with health insurance: 63,780 · Male civilian noninstitutionalized population: 76,923 · Female civilian noninstitutionalized population: 74,795Tulsa, Oklahoma · Insured share: 83.5% · Uninsured share: 16.5% · Male insured share: 81.9% · Female insured share: 85.0% · With health insurance: 340,757 · No health insurance: 67,316 · Civilian noninstitutionalized population: 408,073 · Population: 412,322 · Insured margin of error: 2,501 · Uninsured margin of error: 1,399 · Coverage universe margin of error: 2,866 · Population margin of error: 129 · Males with health insurance: 163,076 · Females with health insurance: 177,681 · Male civilian noninstitutionalized population: 199,106 · Female civilian noninstitutionalized population: 208,967Wichita Falls, Texas · Insured share: 83.6% · Uninsured share: 16.4% · Male insured share: 82.6% · Female insured share: 84.7% · With health insurance: 76,371 · No health insurance: 14,928 · Civilian noninstitutionalized population: 91,299 · Population: 102,558 · Insured margin of error: 1,431 · Uninsured margin of error: 1,026 · Coverage universe margin of error: 1,761 · Population margin of error: 39 · Males with health insurance: 36,300 · Females with health insurance: 40,071 · Male civilian noninstitutionalized population: 43,970 · Female civilian noninstitutionalized population: 47,329Lewisville, Texas · Insured share: 83.9% · Uninsured share: 16.1% · Male insured share: 83.2% · Female insured share: 84.6% · With health insurance: 107,290 · No health insurance: 20,526 · Civilian noninstitutionalized population: 127,816 · Population: 128,313 · Insured margin of error: 2,673 · Uninsured margin of error: 1,330 · Coverage universe margin of error: 2,985 · Population margin of error: 470 · Males with health insurance: 51,563 · Females with health insurance: 55,727 · Male civilian noninstitutionalized population: 61,968 · Female civilian noninstitutionalized population: 65,848Amarillo, Texas · Insured share: 84.2% · Uninsured share: 15.8% · Male insured share: 82.7% · Female insured share: 85.6% · With health insurance: 167,568 · No health insurance: 31,486 · Civilian noninstitutionalized population: 199,054 · Population: 200,945 · Insured margin of error: 2,293 · Uninsured margin of error: 1,540 · Coverage universe margin of error: 2,762 · Population margin of error: 43 · Males with health insurance: 81,036 · Females with health insurance: 86,532 · Male civilian noninstitutionalized population: 97,937 · Female civilian noninstitutionalized population: 101,117Hialeah, Florida · Insured share: 84.3% · Uninsured share: 15.7% · Male insured share: 80.8% · Female insured share: 87.7% · With health insurance: 186,274 · No health insurance: 34,571 · Civilian noninstitutionalized population: 220,845 · Population: 221,901 · Insured margin of error: 3,570 · Uninsured margin of error: 1,798 · Coverage universe margin of error: 3,998 · Population margin of error: 67 · Males with health insurance: 86,631 · Females with health insurance: 99,643 · Male civilian noninstitutionalized population: 107,261 · Female civilian noninstitutionalized population: 113,584Killeen, Texas · Insured share: 84.3% · Uninsured share: 15.7% · Male insured share: 83.0% · Female insured share: 85.4% · With health insurance: 121,939 · No health insurance: 22,763 · Civilian noninstitutionalized population: 144,702 · Population: 156,144 · Insured margin of error: 2,656 · Uninsured margin of error: 1,649 · Coverage universe margin of error: 3,127 · Population margin of error: 60 · Males with health insurance: 56,990 · Females with health insurance: 64,949 · Male civilian noninstitutionalized population: 68,630 · Female civilian noninstitutionalized population: 76,072Santa Maria, California · Insured share: 84.5% · Uninsured share: 15.5% · Male insured share: 82.3% · Female insured share: 86.6% · With health insurance: 92,198 · No health insurance: 16,969 · Civilian noninstitutionalized population: 109,167 · Population: 109,880 · Insured margin of error: 2,200 · Uninsured margin of error: 1,174 · Coverage universe margin of error: 2,494 · Population margin of error: 48 · Males with health insurance: 44,762 · Females with health insurance: 47,436 · Male civilian noninstitutionalized population: 54,417 · Female civilian noninstitutionalized population: 54,750Carrollton, Texas · Insured share: 84.6% · Uninsured share: 15.4% · Male insured share: 83.5% · Female insured share: 85.5% · With health insurance: 111,700 · No health insurance: 20,410 · Civilian noninstitutionalized population: 132,110 · Population: 132,741 · Insured margin of error: 2,680 · Uninsured margin of error: 1,336 · Coverage universe margin of error: 2,994 · Population margin of error: 170 · Males with health insurance: 54,818 · Females with health insurance: 56,882 · Male civilian noninstitutionalized population: 65,616 · Female civilian noninstitutionalized population: 66,494East Los Angeles, California · Insured share: 84.7% · Uninsured share: 15.3% · Male insured share: 83.3% · Female insured share: 86.2% · With health insurance: 96,965 · No health insurance: 17,505 · Civilian noninstitutionalized population: 114,470 · Population: 114,617 · Insured margin of error: 2,412 · Uninsured margin of error: 1,119 · Coverage universe margin of error: 2,659 · Population margin of error: 3,058 · Males with health insurance: 48,367 · Females with health insurance: 48,598 · Male civilian noninstitutionalized population: 58,091 · Female civilian noninstitutionalized population: 56,379Denton, Texas · Insured share: 84.8% · Uninsured share: 15.2% · Male insured share: 83.3% · Female insured share: 86.3% · With health insurance: 123,158 · No health insurance: 22,081 · Civilian noninstitutionalized population: 145,239 · Population: 146,987 · Insured margin of error: 3,071 · Uninsured margin of error: 1,557 · Coverage universe margin of error: 3,443 · Population margin of error: 68 · Males with health insurance: 59,609 · Females with health insurance: 63,549 · Male civilian noninstitutionalized population: 71,588 · Female civilian noninstitutionalized population: 73,651Abilene, Texas · Insured share: 84.9% · Uninsured share: 15.1% · Male insured share: 83.4% · Female insured share: 86.1% · With health insurance: 97,606 · No health insurance: 17,408 · Civilian noninstitutionalized population: 115,014 · Population: 127,130 · Insured margin of error: 1,703 · Uninsured margin of error: 1,089 · Coverage universe margin of error: 2,021 · Population margin of error: 262 · Males with health insurance: 45,359 · Females with health insurance: 52,247 · Male civilian noninstitutionalized population: 54,360 · Female civilian noninstitutionalized population: 60,654Oxnard, California · Insured share: 85.0% · Uninsured share: 15.0% · Male insured share: 82.9% · Female insured share: 87.1% · With health insurance: 169,746 · No health insurance: 29,960 · Civilian noninstitutionalized population: 199,706 · Population: 201,014 · Insured margin of error: 2,651 · Uninsured margin of error: 1,496 · Coverage universe margin of error: 3,044 · Population margin of error: 62 · Males with health insurance: 83,165 · Females with health insurance: 86,581 · Male civilian noninstitutionalized population: 100,350 · Female civilian noninstitutionalized population: 99,356West Palm Beach, Florida · Insured share: 85.2% · Uninsured share: 14.8% · Male insured share: 81.9% · Female insured share: 88.5% · With health insurance: 100,509 · No health insurance: 17,427 · Civilian noninstitutionalized population: 117,936 · Population: 119,508 · Insured margin of error: 2,965 · Uninsured margin of error: 1,438 · Coverage universe margin of error: 3,296 · Population margin of error: 117 · Males with health insurance: 47,824 · Females with health insurance: 52,685 · Male civilian noninstitutionalized population: 58,372 · Female civilian noninstitutionalized population: 59,564Memphis, Tennessee · Insured share: 85.2% · Uninsured share: 14.8% · Male insured share: 82.5% · Female insured share: 87.6% · With health insurance: 528,041 · No health insurance: 91,917 · Civilian noninstitutionalized population: 619,958 · Population: 629,063 · Insured margin of error: 4,837 · Uninsured margin of error: 2,961 · Coverage universe margin of error: 5,671 · Population margin of error: 84 · Males with health insurance: 240,942 · Females with health insurance: 287,099 · Male civilian noninstitutionalized population: 292,037 · Female civilian noninstitutionalized population: 327,921Midland, Texas · Insured share: 85.2% · Uninsured share: 14.8% · Male insured share: 85.8% · Female insured share: 84.7% · With health insurance: 113,290 · No health insurance: 19,606 · Civilian noninstitutionalized population: 132,896 · Population: 133,998 · Insured margin of error: 2,507 · Uninsured margin of error: 1,589 · Coverage universe margin of error: 2,968 · Population margin of error: 47 · Males with health insurance: 58,166 · Females with health insurance: 55,124 · Male civilian noninstitutionalized population: 67,778 · Female civilian noninstitutionalized population: 65,118Jackson, Mississippi · Insured share: 85.4% · Uninsured share: 14.6% · Male insured share: 83.1% · Female insured share: 87.3% · With health insurance: 126,678 · No health insurance: 21,729 · Civilian noninstitutionalized population: 148,407 · Population: 149,827 · Insured margin of error: 2,079 · Uninsured margin of error: 1,352 · Coverage universe margin of error: 2,480 · Population margin of error: 70 · Males with health insurance: 56,349 · Females with health insurance: 70,329 · Male civilian noninstitutionalized population: 67,831 · Female civilian noninstitutionalized population: 80,576Paradise, Nevada · Insured share: 85.4% · Uninsured share: 14.6% · Male insured share: 84.6% · Female insured share: 86.2% · With health insurance: 158,413 · No health insurance: 27,112 · Civilian noninstitutionalized population: 185,525 · Population: 186,178 · Insured margin of error: 3,422 · Uninsured margin of error: 1,497 · Coverage universe margin of error: 3,736 · Population margin of error: 4,601 · Males with health insurance: 79,708 · Females with health insurance: 78,705 · Male civilian noninstitutionalized population: 94,189 · Female civilian noninstitutionalized population: 91,336Phoenix, Arizona · Insured share: 85.5% · Uninsured share: 14.5% · Male insured share: 84.4% · Female insured share: 86.6% · With health insurance: 1,378,353 · No health insurance: 233,637 · Civilian noninstitutionalized population: 1,611,990 · Population: 1,624,832 · Insured margin of error: 8,490 · Uninsured margin of error: 4,545 · Coverage universe margin of error: 9,630 · Population margin of error: 112 · Males with health insurance: 679,903 · Females with health insurance: 698,450 · Male civilian noninstitutionalized population: 805,390 · Female civilian noninstitutionalized population: 806,600Waco, Texas · Insured share: 85.5% · Uninsured share: 14.5% · Male insured share: 84.9% · Female insured share: 86.0% · With health insurance: 118,848 · No health insurance: 20,211 · Civilian noninstitutionalized population: 139,059 · Population: 141,925 · Insured margin of error: 2,332 · Uninsured margin of error: 1,349 · Coverage universe margin of error: 2,694 · Population margin of error: 137 · Males with health insurance: 56,403 · Females with health insurance: 62,445 · Male civilian noninstitutionalized population: 66,413 · Female civilian noninstitutionalized population: 72,646Bridgeport, Connecticut · Insured share: 85.6% · Uninsured share: 14.4% · Male insured share: 83.1% · Female insured share: 88.0% · With health insurance: 125,589 · No health insurance: 21,077 · Civilian noninstitutionalized population: 146,666 · Population: 148,012 · Insured margin of error: 2,411 · Uninsured margin of error: 1,293 · Coverage universe margin of error: 2,736 · Population margin of error: 100 · Males with health insurance: 59,196 · Females with health insurance: 66,393 · Male civilian noninstitutionalized population: 71,214 · Female civilian noninstitutionalized population: 75,452Clearwater, Florida · Insured share: 85.9% · Uninsured share: 14.1% · Male insured share: 83.6% · Female insured share: 88.2% · With health insurance: 99,182 · No health insurance: 16,216 · Civilian noninstitutionalized population: 115,398 · Population: 117,075 · Insured margin of error: 2,615 · Uninsured margin of error: 1,318 · Coverage universe margin of error: 2,928 · Population margin of error: 58 · Males with health insurance: 47,649 · Females with health insurance: 51,533 · Male civilian noninstitutionalized population: 56,977 · Female civilian noninstitutionalized population: 58,421Fort Lauderdale, Florida · Insured share: 85.9% · Uninsured share: 14.1% · Male insured share: 85.0% · Female insured share: 86.9% · With health insurance: 155,544 · No health insurance: 25,504 · Civilian noninstitutionalized population: 181,048 · Population: 183,032 · Insured margin of error: 3,644 · Uninsured margin of error: 1,743 · Coverage universe margin of error: 4,040 · Population margin of error: 56 · Males with health insurance: 80,193 · Females with health insurance: 75,351 · Male civilian noninstitutionalized population: 94,364 · Female civilian noninstitutionalized population: 86,684Springfield, Missouri · Insured share: 85.9% · Uninsured share: 14.1% · Male insured share: 83.9% · Female insured share: 87.9% · With health insurance: 142,905 · No health insurance: 23,386 · Civilian noninstitutionalized population: 166,291 · Population: 169,432 · Insured margin of error: 2,322 · Uninsured margin of error: 1,327 · Coverage universe margin of error: 2,675 · Population margin of error: 92 · Males with health insurance: 67,651 · Females with health insurance: 75,254 · Male civilian noninstitutionalized population: 80,659 · Female civilian noninstitutionalized population: 85,632Oklahoma City, Oklahoma · Insured share: 86.0% · Uninsured share: 14.0% · Male insured share: 84.5% · Female insured share: 87.4% · With health insurance: 582,744 · No health insurance: 94,705 · Civilian noninstitutionalized population: 677,449 · Population: 688,693 · Insured margin of error: 4,268 · Uninsured margin of error: 2,617 · Coverage universe margin of error: 5,006 · Population margin of error: 148 · Males with health insurance: 280,822 · Females with health insurance: 301,922 · Male civilian noninstitutionalized population: 332,146 · Female civilian noninstitutionalized population: 345,303Orlando, Florida · Insured share: 86.1% · Uninsured share: 13.9% · Male insured share: 85.0% · Female insured share: 87.2% · With health insurance: 266,328 · No health insurance: 42,985 · Civilian noninstitutionalized population: 309,313 · Population: 311,732 · Insured margin of error: 5,118 · Uninsured margin of error: 2,586 · Coverage universe margin of error: 5,734 · Population margin of error: 141 · Males with health insurance: 129,557 · Females with health insurance: 136,771 · Male civilian noninstitutionalized population: 152,391 · Female civilian noninstitutionalized population: 156,922Savannah, Georgia · Insured share: 86.2% · Uninsured share: 13.8% · Male insured share: 84.4% · Female insured share: 87.7% · With health insurance: 122,091 · No health insurance: 19,496 · Civilian noninstitutionalized population: 141,587 · Population: 147,546 · Insured margin of error: 2,585 · Uninsured margin of error: 1,236 · Coverage universe margin of error: 2,865 · Population margin of error: 85 · Males with health insurance: 54,049 · Females with health insurance: 68,042 · Male civilian noninstitutionalized population: 64,038 · Female civilian noninstitutionalized population: 77,549Macon-Bibb County, Georgia · Insured share: 86.4% · Uninsured share: 13.6% · Male insured share: 84.5% · Female insured share: 88.1% · With health insurance: 132,321 · No health insurance: 20,810 · Civilian noninstitutionalized population: 153,131 · Population: 156,543 · Insured margin of error: 1,472 · Uninsured margin of error: 1,291 · Coverage universe margin of error: 1,958 · Males with health insurance: 60,266 · Females with health insurance: 72,055 · Male civilian noninstitutionalized population: 71,344 · Female civilian noninstitutionalized population: 81,787Lubbock, Texas · Insured share: 86.5% · Uninsured share: 13.5% · Male insured share: 85.6% · Female insured share: 87.3% · With health insurance: 222,980 · No health insurance: 34,806 · Civilian noninstitutionalized population: 257,786 · Population: 261,078 · Insured margin of error: 2,463 · Uninsured margin of error: 1,682 · Coverage universe margin of error: 2,982 · Population margin of error: 49 · Males with health insurance: 108,149 · Females with health insurance: 114,831 · Male civilian noninstitutionalized population: 126,297 · Female civilian noninstitutionalized population: 131,489Davie, Florida · Insured share: 86.7% · Uninsured share: 13.3% · Male insured share: 85.8% · Female insured share: 87.5% · With health insurance: 92,011 · No health insurance: 14,148 · Civilian noninstitutionalized population: 106,159 · Population: 106,412 · Insured margin of error: 2,685 · Uninsured margin of error: 1,353 · Coverage universe margin of error: 3,006 · Population margin of error: 62 · Males with health insurance: 45,213 · Females with health insurance: 46,798 · Male civilian noninstitutionalized population: 52,675 · Female civilian noninstitutionalized population: 53,484Glendale, Arizona · Insured share: 86.8% · Uninsured share: 13.2% · Male insured share: 86.5% · Female insured share: 87.1% · With health insurance: 214,498 · No health insurance: 32,517 · Civilian noninstitutionalized population: 247,015 · Population: 250,193 · Insured margin of error: 3,832 · Uninsured margin of error: 1,696 · Coverage universe margin of error: 4,191 · Population margin of error: 86 · Males with health insurance: 103,971 · Females with health insurance: 110,527 · Male civilian noninstitutionalized population: 120,178 · Female civilian noninstitutionalized population: 126,837Las Vegas, Nevada · Insured share: 86.8% · Uninsured share: 13.2% · Male insured share: 85.5% · Female insured share: 88.1% · With health insurance: 556,984 · No health insurance: 84,624 · Civilian noninstitutionalized population: 641,608 · Population: 650,873 · Insured margin of error: 5,300 · Uninsured margin of error: 2,725 · Coverage universe margin of error: 5,960 · Population margin of error: 108 · Males with health insurance: 272,452 · Females with health insurance: 284,532 · Male civilian noninstitutionalized population: 318,802 · Female civilian noninstitutionalized population: 322,806El Monte, California · Insured share: 86.9% · Uninsured share: 13.1% · Male insured share: 84.3% · Female insured share: 89.5% · With health insurance: 92,268 · No health insurance: 13,952 · Civilian noninstitutionalized population: 106,220 · Population: 107,066 · Insured margin of error: 2,159 · Uninsured margin of error: 1,014 · Coverage universe margin of error: 2,385 · Population margin of error: 113 · Males with health insurance: 45,356 · Females with health insurance: 46,912 · Male civilian noninstitutionalized population: 53,794 · Female civilian noninstitutionalized population: 52,426Independence, Missouri · Insured share: 86.9% · Uninsured share: 13.1% · Male insured share: 86.1% · Female insured share: 87.7% · With health insurance: 105,029 · No health insurance: 15,773 · Civilian noninstitutionalized population: 120,802 · Population: 121,944 · Insured margin of error: 2,454 · Uninsured margin of error: 1,345 · Coverage universe margin of error: 2,799 · Population margin of error: 74 · Males with health insurance: 50,872 · Females with health insurance: 54,157 · Male civilian noninstitutionalized population: 59,073 · Female civilian noninstitutionalized population: 61,729North Las Vegas, Nevada · Insured share: 86.9% · Uninsured share: 13.1% · Male insured share: 86.3% · Female insured share: 87.5% · With health insurance: 231,560 · No health insurance: 34,880 · Civilian noninstitutionalized population: 266,440 · Population: 270,773 · Insured margin of error: 3,984 · Uninsured margin of error: 1,774 · Coverage universe margin of error: 4,361 · Population margin of error: 64 · Males with health insurance: 111,802 · Females with health insurance: 119,758 · Male civilian noninstitutionalized population: 129,595 · Female civilian noninstitutionalized population: 136,845Richardson, Texas · Insured share: 86.9% · Uninsured share: 13.1% · Male insured share: 87.0% · Female insured share: 86.8% · With health insurance: 102,309 · No health insurance: 15,434 · Civilian noninstitutionalized population: 117,743 · Population: 118,269 · Insured margin of error: 2,768 · Uninsured margin of error: 1,435 · Coverage universe margin of error: 3,117 · Population margin of error: 91 · Males with health insurance: 49,039 · Females with health insurance: 53,270 · Male civilian noninstitutionalized population: 56,344 · Female civilian noninstitutionalized population: 61,399Aurora, Colorado · Insured share: 87.0% · Uninsured share: 13.0% · Male insured share: 85.4% · Female insured share: 88.6% · With health insurance: 336,433 · No health insurance: 50,302 · Civilian noninstitutionalized population: 386,735 · Population: 390,201 · Insured margin of error: 3,617 · Uninsured margin of error: 2,077 · Coverage universe margin of error: 4,171 · Population margin of error: 117 · Males with health insurance: 165,753 · Females with health insurance: 170,680 · Male civilian noninstitutionalized population: 194,047 · Female civilian noninstitutionalized population: 192,688Brandon, Florida · Insured share: 87.1% · Uninsured share: 12.9% · Male insured share: 85.6% · Female insured share: 88.4% · With health insurance: 98,808 · No health insurance: 14,670 · Civilian noninstitutionalized population: 113,478 · Population: 116,365 · Insured margin of error: 2,757 · Uninsured margin of error: 1,300 · Coverage universe margin of error: 3,048 · Population margin of error: 3,137 · Males with health insurance: 46,723 · Females with health insurance: 52,085 · Male civilian noninstitutionalized population: 54,585 · Female civilian noninstitutionalized population: 58,893Charlotte, North Carolina · Insured share: 87.1% · Uninsured share: 12.9% · Male insured share: 86.0% · Female insured share: 88.2% · With health insurance: 767,919 · No health insurance: 113,278 · Civilian noninstitutionalized population: 881,197 · Population: 886,283 · Insured margin of error: 4,778 · Uninsured margin of error: 3,052 · Coverage universe margin of error: 5,670 · Population margin of error: 226 · Males with health insurance: 365,257 · Females with health insurance: 402,662 · Male civilian noninstitutionalized population: 424,543 · Female civilian noninstitutionalized population: 456,654Salinas, California · Insured share: 87.4% · Uninsured share: 12.6% · Male insured share: 85.7% · Female insured share: 89.1% · With health insurance: 140,797 · No health insurance: 20,262 · Civilian noninstitutionalized population: 161,059 · Population: 161,993 · Insured margin of error: 2,305 · Uninsured margin of error: 1,227 · Coverage universe margin of error: 2,611 · Population margin of error: 109 · Males with health insurance: 69,793 · Females with health insurance: 71,004 · Male civilian noninstitutionalized population: 81,412 · Female civilian noninstitutionalized population: 79,647Nashville-Davidson metropolitan government (balance), Tennessee · Insured share: 87.4% · Uninsured share: 12.6% · Male insured share: 85.5% · Female insured share: 89.2% · With health insurance: 593,155 · No health insurance: 85,424 · Civilian noninstitutionalized population: 678,579 · Population: 684,298 · Insured margin of error: 3,629 · Uninsured margin of error: 2,855 · Coverage universe margin of error: 4,618 · Population margin of error: 77 · Males with health insurance: 280,545 · Females with health insurance: 312,610 · Male civilian noninstitutionalized population: 328,103 · Female civilian noninstitutionalized population: 350,476Birmingham, Alabama · Insured share: 87.5% · Uninsured share: 12.5% · Male insured share: 84.9% · Female insured share: 89.7% · With health insurance: 171,419 · No health insurance: 24,564 · Civilian noninstitutionalized population: 195,983 · Population: 199,322 · Insured margin of error: 3,277 · Uninsured margin of error: 1,439 · Coverage universe margin of error: 3,579 · Population margin of error: 646 · Males with health insurance: 78,145 · Females with health insurance: 93,274 · Male civilian noninstitutionalized population: 92,037 · Female civilian noninstitutionalized population: 103,946Santa Ana, California · Insured share: 87.6% · Uninsured share: 12.4% · Male insured share: 86.6% · Female insured share: 88.6% · With health insurance: 271,100 · No health insurance: 38,429 · Civilian noninstitutionalized population: 309,529 · Population: 311,639 · Insured margin of error: 3,696 · Uninsured margin of error: 1,656 · Coverage universe margin of error: 4,050 · Population margin of error: 89 · Males with health insurance: 137,520 · Females with health insurance: 133,580 · Male civilian noninstitutionalized population: 158,824 · Female civilian noninstitutionalized population: 150,705Wichita, Kansas · Insured share: 87.6% · Uninsured share: 12.4% · Male insured share: 86.6% · Female insured share: 88.6% · With health insurance: 342,378 · No health insurance: 48,419 · Civilian noninstitutionalized population: 390,797 · Population: 396,488 · Insured margin of error: 2,965 · Uninsured margin of error: 1,759 · Coverage universe margin of error: 3,448 · Population margin of error: 82 · Males with health insurance: 167,590 · Females with health insurance: 174,788 · Male civilian noninstitutionalized population: 193,456 · Female civilian noninstitutionalized population: 197,341Spring Valley, Nevada · Insured share: 87.6% · Uninsured share: 12.4% · Male insured share: 86.0% · Female insured share: 89.2% · With health insurance: 192,416 · No health insurance: 27,261 · Civilian noninstitutionalized population: 219,677 · Population: 219,913 · Insured margin of error: 3,783 · Uninsured margin of error: 1,638 · Coverage universe margin of error: 4,123 · Population margin of error: 5,139 · Males with health insurance: 95,473 · Females with health insurance: 96,943 · Male civilian noninstitutionalized population: 111,008 · Female civilian noninstitutionalized population: 108,669Austin, Texas · Insured share: 87.6% · Uninsured share: 12.4% · Male insured share: 86.6% · Female insured share: 88.6% · With health insurance: 843,230 · No health insurance: 119,482 · Civilian noninstitutionalized population: 962,712 · Population: 967,862 · Insured margin of error: 6,256 · Uninsured margin of error: 3,944 · Coverage universe margin of error: 7,395 · Population margin of error: 373 · Males with health insurance: 426,511 · Females with health insurance: 416,719 · Male civilian noninstitutionalized population: 492,253 · Female civilian noninstitutionalized population: 470,459Jurupa Valley, California · Insured share: 87.8% · Uninsured share: 12.2% · Male insured share: 86.9% · Female insured share: 88.8% · With health insurance: 92,788 · No health insurance: 12,852 · Civilian noninstitutionalized population: 105,640 · Population: 106,244 · Insured margin of error: 2,319 · Uninsured margin of error: 963 · Coverage universe margin of error: 2,511 · Population margin of error: 54 · Males with health insurance: 45,741 · Females with health insurance: 47,047 · Male civilian noninstitutionalized population: 52,640 · Female civilian noninstitutionalized population: 53,000Miramar, Florida · Insured share: 87.8% · Uninsured share: 12.2% · Male insured share: 86.9% · Female insured share: 88.6% · With health insurance: 119,226 · No health insurance: 16,583 · Civilian noninstitutionalized population: 135,809 · Population: 135,986 · Insured margin of error: 3,679 · Uninsured margin of error: 1,412 · Coverage universe margin of error: 3,940 · Population margin of error: 63 · Males with health insurance: 57,228 · Females with health insurance: 61,998 · Male civilian noninstitutionalized population: 65,822 · Female civilian noninstitutionalized population: 69,987Palm Bay, Florida · Insured share: 87.9% · Uninsured share: 12.1% · Male insured share: 85.9% · Female insured share: 89.7% · With health insurance: 109,206 · No health insurance: 15,046 · Civilian noninstitutionalized population: 124,252 · Population: 125,273 · Insured margin of error: 2,756 · Uninsured margin of error: 1,297 · Coverage universe margin of error: 3,046 · Population margin of error: 104 · Males with health insurance: 51,968 · Females with health insurance: 57,238 · Male civilian noninstitutionalized population: 60,475 · Female civilian noninstitutionalized population: 63,777Coral Springs, Florida · Insured share: 88.1% · Uninsured share: 11.9% · Male insured share: 87.1% · Female insured share: 88.9% · With health insurance: 117,754 · No health insurance: 15,953 · Civilian noninstitutionalized population: 133,707 · Population: 133,962 · Insured margin of error: 2,995 · Uninsured margin of error: 1,445 · Coverage universe margin of error: 3,326 · Population margin of error: 64 · Males with health insurance: 55,221 · Females with health insurance: 62,533 · Male civilian noninstitutionalized population: 63,369 · Female civilian noninstitutionalized population: 70,338Winston-Salem, North Carolina · Insured share: 88.1% · Uninsured share: 11.9% · Male insured share: 86.1% · Female insured share: 89.8% · With health insurance: 218,812 · No health insurance: 29,561 · Civilian noninstitutionalized population: 248,373 · Population: 250,887 · Insured margin of error: 2,712 · Uninsured margin of error: 1,670 · Coverage universe margin of error: 3,185 · Population margin of error: 68 · Males with health insurance: 99,342 · Females with health insurance: 119,470 · Male civilian noninstitutionalized population: 115,315 · Female civilian noninstitutionalized population: 133,058Spring Hill, Florida · Insured share: 88.2% · Uninsured share: 11.8% · Male insured share: 87.3% · Female insured share: 89.0% · With health insurance: 103,540 · No health insurance: 13,853 · Civilian noninstitutionalized population: 117,393 · Population: 118,814 · Insured margin of error: 1,988 · Uninsured margin of error: 1,080 · Coverage universe margin of error: 2,263 · Population margin of error: 2,310 · Males with health insurance: 49,185 · Females with health insurance: 54,355 · Male civilian noninstitutionalized population: 56,340 · Female civilian noninstitutionalized population: 61,053Jacksonville, Florida · Insured share: 88.3% · Uninsured share: 11.7% · Male insured share: 86.6% · Female insured share: 90.0% · With health insurance: 828,413 · No health insurance: 109,302 · Civilian noninstitutionalized population: 937,715 · Population: 961,739 · Insured margin of error: 4,565 · Uninsured margin of error: 3,616 · Coverage universe margin of error: 5,824 · Population margin of error: 52 · Males with health insurance: 388,986 · Females with health insurance: 439,427 · Male civilian noninstitutionalized population: 449,301 · Female civilian noninstitutionalized population: 488,414Chattanooga, Tennessee · Insured share: 88.3% · Uninsured share: 11.7% · Male insured share: 86.1% · Female insured share: 90.4% · With health insurance: 158,989 · No health insurance: 20,967 · Civilian noninstitutionalized population: 179,956 · Population: 182,832 · Insured margin of error: 2,597 · Uninsured margin of error: 1,335 · Coverage universe margin of error: 2,920 · Population margin of error: 79 · Males with health insurance: 74,433 · Females with health insurance: 84,556 · Male civilian noninstitutionalized population: 86,441 · Female civilian noninstitutionalized population: 93,515Cape Coral, Florida · Insured share: 88.4% · Uninsured share: 11.6% · Male insured share: 86.7% · Female insured share: 90.1% · With health insurance: 181,740 · No health insurance: 23,850 · Civilian noninstitutionalized population: 205,590 · Population: 206,387 · Insured margin of error: 3,432 · Uninsured margin of error: 1,909 · Coverage universe margin of error: 3,927 · Population margin of error: 42 · Males with health insurance: 89,254 · Females with health insurance: 92,486 · Male civilian noninstitutionalized population: 102,946 · Female civilian noninstitutionalized population: 102,644Durham, North Carolina · Insured share: 88.4% · Uninsured share: 11.6% · Male insured share: 86.9% · Female insured share: 89.7% · With health insurance: 253,016 · No health insurance: 33,245 · Civilian noninstitutionalized population: 286,261 · Population: 288,465 · Insured margin of error: 2,657 · Uninsured margin of error: 1,880 · Coverage universe margin of error: 3,255 · Population margin of error: 163 · Males with health insurance: 117,446 · Females with health insurance: 135,570 · Male civilian noninstitutionalized population: 135,148 · Female civilian noninstitutionalized population: 151,113Wilmington, North Carolina · Insured share: 88.4% · Uninsured share: 11.6% · Male insured share: 84.8% · Female insured share: 91.5% · With health insurance: 104,092 · No health insurance: 13,722 · Civilian noninstitutionalized population: 117,814 · Population: 118,578 · Insured margin of error: 2,321 · Uninsured margin of error: 1,323 · Coverage universe margin of error: 2,671 · Population margin of error: 53 · Males with health insurance: 46,662 · Females with health insurance: 57,430 · Male civilian noninstitutionalized population: 55,036 · Female civilian noninstitutionalized population: 62,778Escondido, California · Insured share: 88.5% · Uninsured share: 11.5% · Male insured share: 86.7% · Female insured share: 90.4% · With health insurance: 131,505 · No health insurance: 17,041 · Civilian noninstitutionalized population: 148,546 · Population: 149,913 · Insured margin of error: 2,990 · Uninsured margin of error: 1,223 · Coverage universe margin of error: 3,230 · Population margin of error: 83 · Males with health insurance: 64,586 · Females with health insurance: 66,919 · Male civilian noninstitutionalized population: 74,516 · Female civilian noninstitutionalized population: 74,030Augusta-Richmond County consolidated government (balance), Georgia · Insured share: 88.5% · Uninsured share: 11.5% · Male insured share: 87.2% · Female insured share: 89.6% · With health insurance: 167,971 · No health insurance: 21,917 · Civilian noninstitutionalized population: 189,888 · Population: 201,504 · Insured margin of error: 1,936 · Uninsured margin of error: 1,441 · Coverage universe margin of error: 2,414 · Population margin of error: 20 · Males with health insurance: 76,910 · Females with health insurance: 91,061 · Male civilian noninstitutionalized population: 88,238 · Female civilian noninstitutionalized population: 101,650High Point, North Carolina · Insured share: 88.5% · Uninsured share: 11.5% · Male insured share: 87.6% · Female insured share: 89.4% · With health insurance: 101,004 · No health insurance: 13,064 · Civilian noninstitutionalized population: 114,068 · Population: 115,263 · Insured margin of error: 2,531 · Uninsured margin of error: 1,074 · Coverage universe margin of error: 2,749 · Population margin of error: 63 · Males with health insurance: 48,617 · Females with health insurance: 52,387 · Male civilian noninstitutionalized population: 55,496 · Female civilian noninstitutionalized population: 58,572Plano, Texas · Insured share: 88.6% · Uninsured share: 11.4% · Male insured share: 87.8% · Female insured share: 89.4% · With health insurance: 253,698 · No health insurance: 32,618 · Civilian noninstitutionalized population: 286,316 · Population: 287,339 · Insured margin of error: 3,626 · Uninsured margin of error: 1,828 · Coverage universe margin of error: 4,061 · Population margin of error: 74 · Males with health insurance: 124,423 · Females with health insurance: 129,275 · Male civilian noninstitutionalized population: 141,660 · Female civilian noninstitutionalized population: 144,656Montgomery, Alabama · Insured share: 88.7% · Uninsured share: 11.3% · Male insured share: 87.6% · Female insured share: 89.7% · With health insurance: 171,521 · No health insurance: 21,865 · Civilian noninstitutionalized population: 193,386 · Population: 198,440 · Insured margin of error: 2,023 · Uninsured margin of error: 1,356 · Coverage universe margin of error: 2,435 · Population margin of error: 40 · Males with health insurance: 77,874 · Females with health insurance: 93,647 · Male civilian noninstitutionalized population: 88,935 · Female civilian noninstitutionalized population: 104,451Lakeland, Florida · Insured share: 88.7% · Uninsured share: 11.3% · Male insured share: 87.4% · Female insured share: 89.9% · With health insurance: 102,161 · No health insurance: 13,069 · Civilian noninstitutionalized population: 115,230 · Population: 117,030 · Insured margin of error: 2,638 · Uninsured margin of error: 1,095 · Coverage universe margin of error: 2,856 · Population margin of error: 64 · Males with health insurance: 50,058 · Females with health insurance: 52,103 · Male civilian noninstitutionalized population: 57,247 · Female civilian noninstitutionalized population: 57,983Columbus, Georgia · Insured share: 88.7% · Uninsured share: 11.3% · Male insured share: 87.7% · Female insured share: 89.6% · With health insurance: 172,849 · No health insurance: 21,952 · Civilian noninstitutionalized population: 194,801 · Population: 204,383 · Insured margin of error: 1,864 · Uninsured margin of error: 1,549 · Coverage universe margin of error: 2,424 · Males with health insurance: 79,054 · Females with health insurance: 93,795 · Male civilian noninstitutionalized population: 90,142 · Female civilian noninstitutionalized population: 104,659Kansas City, Missouri · Insured share: 88.7% · Uninsured share: 11.3% · Male insured share: 87.9% · Female insured share: 89.5% · With health insurance: 447,096 · No health insurance: 56,892 · Civilian noninstitutionalized population: 503,988 · Population: 508,233 · Insured margin of error: 4,123 · Uninsured margin of error: 2,178 · Coverage universe margin of error: 4,663 · Population margin of error: 121 · Males with health insurance: 213,750 · Females with health insurance: 233,346 · Male civilian noninstitutionalized population: 243,303 · Female civilian noninstitutionalized population: 260,685Knoxville, Tennessee · Insured share: 88.7% · Uninsured share: 11.3% · Male insured share: 86.9% · Female insured share: 90.4% · With health insurance: 170,451 · No health insurance: 21,656 · Civilian noninstitutionalized population: 192,107 · Population: 193,721 · Insured margin of error: 2,757 · Uninsured margin of error: 1,346 · Coverage universe margin of error: 3,068 · Population margin of error: 80 · Males with health insurance: 81,072 · Females with health insurance: 89,379 · Male civilian noninstitutionalized population: 93,266 · Female civilian noninstitutionalized population: 98,841Athens-Clarke County unified government (balance), Georgia · Insured share: 88.8% · Uninsured share: 11.2% · Male insured share: 88.1% · Female insured share: 89.4% · With health insurance: 111,934 · No health insurance: 14,147 · Civilian noninstitutionalized population: 126,081 · Population: 126,987 · Insured margin of error: 1,611 · Uninsured margin of error: 1,104 · Coverage universe margin of error: 1,953 · Population margin of error: 688 · Males with health insurance: 52,647 · Females with health insurance: 59,287 · Male civilian noninstitutionalized population: 59,743 · Female civilian noninstitutionalized population: 66,338Mesa, Arizona · Insured share: 88.9% · Uninsured share: 11.1% · Male insured share: 87.7% · Female insured share: 90.1% · With health insurance: 448,605 · No health insurance: 55,934 · Civilian noninstitutionalized population: 504,539 · Population: 507,478 · Insured margin of error: 5,200 · Uninsured margin of error: 2,070 · Coverage universe margin of error: 5,597 · Population margin of error: 87 · Males with health insurance: 220,552 · Females with health insurance: 228,053 · Male civilian noninstitutionalized population: 251,442 · Female civilian noninstitutionalized population: 253,097Round Rock, Texas · Insured share: 88.9% · Uninsured share: 11.1% · Male insured share: 87.9% · Female insured share: 89.9% · With health insurance: 109,976 · No health insurance: 13,667 · Civilian noninstitutionalized population: 123,643 · Population: 124,288 · Insured margin of error: 2,902 · Uninsured margin of error: 1,215 · Coverage universe margin of error: 3,146 · Population margin of error: 898 · Males with health insurance: 53,421 · Females with health insurance: 56,555 · Male civilian noninstitutionalized population: 60,753 · Female civilian noninstitutionalized population: 62,890Tucson, Arizona · Insured share: 89.0% · Uninsured share: 11.0% · Male insured share: 87.4% · Female insured share: 90.5% · With health insurance: 467,951 · No health insurance: 57,763 · Civilian noninstitutionalized population: 525,714 · Population: 543,348 · Insured margin of error: 4,352 · Uninsured margin of error: 2,140 · Coverage universe margin of error: 4,850 · Population margin of error: 98 · Males with health insurance: 223,212 · Females with health insurance: 244,739 · Male civilian noninstitutionalized population: 255,322 · Female civilian noninstitutionalized population: 270,392Pomona, California · Insured share: 89.0% · Uninsured share: 11.0% · Male insured share: 86.8% · Female insured share: 91.2% · With health insurance: 130,715 · No health insurance: 16,080 · Civilian noninstitutionalized population: 146,795 · Population: 148,391 · Insured margin of error: 2,739 · Uninsured margin of error: 1,066 · Coverage universe margin of error: 2,939 · Population margin of error: 54 · Males with health insurance: 63,062 · Females with health insurance: 67,653 · Male civilian noninstitutionalized population: 72,628 · Female civilian noninstitutionalized population: 74,167Tampa, Florida · Insured share: 89.0% · Uninsured share: 11.0% · Male insured share: 87.6% · Female insured share: 90.3% · With health insurance: 345,900 · No health insurance: 42,805 · Civilian noninstitutionalized population: 388,705 · Population: 393,389 · Insured margin of error: 4,502 · Uninsured margin of error: 1,983 · Coverage universe margin of error: 4,919 · Population margin of error: 134 · Males with health insurance: 170,160 · Females with health insurance: 175,740 · Male civilian noninstitutionalized population: 194,169 · Female civilian noninstitutionalized population: 194,536Salt Lake City, Utah · Insured share: 89.0% · Uninsured share: 11.0% · Male insured share: 88.2% · Female insured share: 89.9% · With health insurance: 180,358 · No health insurance: 22,321 · Civilian noninstitutionalized population: 202,679 · Population: 203,888 · Insured margin of error: 3,105 · Uninsured margin of error: 1,432 · Coverage universe margin of error: 3,420 · Population margin of error: 77 · Males with health insurance: 91,917 · Females with health insurance: 88,441 · Male civilian noninstitutionalized population: 104,251 · Female civilian noninstitutionalized population: 98,428Elgin, Illinois · Insured share: 89.1% · Uninsured share: 10.9% · Male insured share: 88.8% · Female insured share: 89.4% · With health insurance: 100,444 · No health insurance: 12,286 · Civilian noninstitutionalized population: 112,730 · Population: 114,106 · Insured margin of error: 2,515 · Uninsured margin of error: 1,017 · Coverage universe margin of error: 2,713 · Population margin of error: 399 · Males with health insurance: 50,571 · Females with health insurance: 49,873 · Male civilian noninstitutionalized population: 56,942 · Female civilian noninstitutionalized population: 55,788San Bernardino, California · Insured share: 89.2% · Uninsured share: 10.8% · Male insured share: 87.6% · Female insured share: 90.8% · With health insurance: 192,838 · No health insurance: 23,302 · Civilian noninstitutionalized population: 216,140 · Population: 221,774 · Insured margin of error: 3,511 · Uninsured margin of error: 1,380 · Coverage universe margin of error: 3,772 · Population margin of error: 88 · Males with health insurance: 93,469 · Females with health insurance: 99,369 · Male civilian noninstitutionalized population: 106,684 · Female civilian noninstitutionalized population: 109,456Port St. Lucie, Florida · Insured share: 89.2% · Uninsured share: 10.8% · Male insured share: 89.7% · Female insured share: 88.8% · With health insurance: 195,874 · No health insurance: 23,716 · Civilian noninstitutionalized population: 219,590 · Population: 220,453 · Insured margin of error: 3,003 · Uninsured margin of error: 1,711 · Coverage universe margin of error: 3,456 · Population margin of error: 73 · Males with health insurance: 96,110 · Females with health insurance: 99,764 · Male civilian noninstitutionalized population: 107,190 · Female civilian noninstitutionalized population: 112,400Fayetteville, North Carolina · Insured share: 89.2% · Uninsured share: 10.8% · Male insured share: 87.7% · Female insured share: 90.5% · With health insurance: 160,825 · No health insurance: 19,413 · Civilian noninstitutionalized population: 180,238 · Population: 209,692 · Insured margin of error: 1,976 · Uninsured margin of error: 958 · Coverage universe margin of error: 2,196 · Population margin of error: 87 · Males with health insurance: 71,042 · Females with health insurance: 89,783 · Male civilian noninstitutionalized population: 81,036 · Female civilian noninstitutionalized population: 99,202Allentown, Pennsylvania · Insured share: 89.2% · Uninsured share: 10.8% · Male insured share: 86.9% · Female insured share: 91.4% · With health insurance: 110,069 · No health insurance: 13,330 · Civilian noninstitutionalized population: 123,399 · Population: 125,320 · Insured margin of error: 2,279 · Uninsured margin of error: 1,139 · Coverage universe margin of error: 2,547 · Population margin of error: 53 · Males with health insurance: 52,213 · Females with health insurance: 57,856 · Male civilian noninstitutionalized population: 60,070 · Female civilian noninstitutionalized population: 63,329Baton Rouge, Louisiana · Insured share: 89.3% · Uninsured share: 10.7% · Male insured share: 87.4% · Female insured share: 91.0% · With health insurance: 197,851 · No health insurance: 23,655 · Civilian noninstitutionalized population: 221,506 · Population: 223,699 · Insured margin of error: 3,707 · Uninsured margin of error: 2,025 · Coverage universe margin of error: 4,224 · Population margin of error: 58 · Males with health insurance: 91,707 · Females with health insurance: 106,144 · Male civilian noninstitutionalized population: 104,918 · Female civilian noninstitutionalized population: 116,588Anaheim, California · Insured share: 89.4% · Uninsured share: 10.6% · Male insured share: 88.0% · Female insured share: 90.6% · With health insurance: 306,243 · No health insurance: 36,500 · Civilian noninstitutionalized population: 342,743 · Population: 344,553 · Insured margin of error: 4,422 · Uninsured margin of error: 1,735 · Coverage universe margin of error: 4,750 · Population margin of error: 138 · Males with health insurance: 146,956 · Females with health insurance: 159,287 · Male civilian noninstitutionalized population: 166,908 · Female civilian noninstitutionalized population: 175,835Costa Mesa, California · Insured share: 89.4% · Uninsured share: 10.6% · Male insured share: 88.3% · Female insured share: 90.5% · With health insurance: 98,423 · No health insurance: 11,689 · Civilian noninstitutionalized population: 110,112 · Population: 110,538 · Insured margin of error: 2,454 · Uninsured margin of error: 984 · Coverage universe margin of error: 2,644 · Population margin of error: 83 · Males with health insurance: 49,545 · Females with health insurance: 48,878 · Male civilian noninstitutionalized population: 56,130 · Female civilian noninstitutionalized population: 53,982Greeley, Colorado · Insured share: 89.4% · Uninsured share: 10.6% · Male insured share: 87.8% · Female insured share: 91.0% · With health insurance: 96,352 · No health insurance: 11,432 · Civilian noninstitutionalized population: 107,784 · Population: 109,421 · Insured margin of error: 2,159 · Uninsured margin of error: 1,024 · Coverage universe margin of error: 2,390 · Population margin of error: 62 · Males with health insurance: 47,396 · Females with health insurance: 48,956 · Male civilian noninstitutionalized population: 54,003 · Female civilian noninstitutionalized population: 53,781Mobile, Alabama · Insured share: 89.5% · Uninsured share: 10.5% · Male insured share: 87.8% · Female insured share: 90.9% · With health insurance: 162,856 · No health insurance: 19,147 · Civilian noninstitutionalized population: 182,003 · Population: 185,097 · Insured margin of error: 2,756 · Uninsured margin of error: 1,333 · Coverage universe margin of error: 3,061 · Population margin of error: 52 · Males with health insurance: 74,200 · Females with health insurance: 88,656 · Male civilian noninstitutionalized population: 84,484 · Female civilian noninstitutionalized population: 97,519Rialto, California · Insured share: 89.5% · Uninsured share: 10.5% · Male insured share: 88.4% · Female insured share: 90.5% · With health insurance: 92,549 · No health insurance: 10,909 · Civilian noninstitutionalized population: 103,458 · Population: 103,866 · Insured margin of error: 2,330 · Uninsured margin of error: 947 · Coverage universe margin of error: 2,515 · Population margin of error: 60 · Males with health insurance: 44,915 · Females with health insurance: 47,634 · Male civilian noninstitutionalized population: 50,832 · Female civilian noninstitutionalized population: 52,626St. Petersburg, Florida · Insured share: 89.5% · Uninsured share: 10.5% · Male insured share: 87.8% · Female insured share: 91.0% · With health insurance: 229,634 · No health insurance: 26,945 · Civilian noninstitutionalized population: 256,579 · Population: 260,646 · Insured margin of error: 3,514 · Uninsured margin of error: 1,529 · Coverage universe margin of error: 3,832 · Population margin of error: 54 · Males with health insurance: 107,628 · Females with health insurance: 122,006 · Male civilian noninstitutionalized population: 122,526 · Female civilian noninstitutionalized population: 134,053Atlanta, Georgia · Insured share: 89.5% · Uninsured share: 10.5% · Male insured share: 88.2% · Female insured share: 90.7% · With health insurance: 439,866 · No health insurance: 51,593 · Civilian noninstitutionalized population: 491,459 · Population: 499,287 · Insured margin of error: 5,755 · Uninsured margin of error: 2,761 · Coverage universe margin of error: 6,383 · Population margin of error: 90 · Males with health insurance: 208,783 · Females with health insurance: 231,083 · Male civilian noninstitutionalized population: 236,697 · Female civilian noninstitutionalized population: 254,762Reno, Nevada · Insured share: 89.5% · Uninsured share: 10.5% · Male insured share: 88.2% · Female insured share: 90.7% · With health insurance: 238,294 · No health insurance: 28,053 · Civilian noninstitutionalized population: 266,347 · Population: 268,959 · Insured margin of error: 3,035 · Uninsured margin of error: 1,541 · Coverage universe margin of error: 3,404 · Population margin of error: 101 · Males with health insurance: 118,518 · Females with health insurance: 119,776 · Male civilian noninstitutionalized population: 134,344 · Female civilian noninstitutionalized population: 132,003Hesperia, California · Insured share: 89.6% · Uninsured share: 10.4% · Male insured share: 87.6% · Female insured share: 91.7% · With health insurance: 89,668 · No health insurance: 10,378 · Civilian noninstitutionalized population: 100,046 · Population: 100,141 · Insured margin of error: 2,593 · Uninsured margin of error: 1,049 · Coverage universe margin of error: 2,798 · Population margin of error: 44 · Males with health insurance: 44,778 · Females with health insurance: 44,890 · Male civilian noninstitutionalized population: 51,095 · Female civilian noninstitutionalized population: 48,951Inglewood, California · Insured share: 89.6% · Uninsured share: 10.4% · Male insured share: 87.1% · Female insured share: 92.0% · With health insurance: 94,040 · No health insurance: 10,910 · Civilian noninstitutionalized population: 104,950 · Population: 105,575 · Insured margin of error: 2,583 · Uninsured margin of error: 948 · Coverage universe margin of error: 2,751 · Population margin of error: 57 · Males with health insurance: 44,425 · Females with health insurance: 49,615 · Male civilian noninstitutionalized population: 50,992 · Female civilian noninstitutionalized population: 53,958Moreno Valley, California · Insured share: 89.7% · Uninsured share: 10.3% · Male insured share: 88.8% · Female insured share: 90.7% · With health insurance: 188,230 · No health insurance: 21,596 · Civilian noninstitutionalized population: 209,826 · Population: 210,378 · Insured margin of error: 3,140 · Uninsured margin of error: 1,229 · Coverage universe margin of error: 3,372 · Population margin of error: 68 · Males with health insurance: 92,956 · Females with health insurance: 95,274 · Male civilian noninstitutionalized population: 104,735 · Female civilian noninstitutionalized population: 105,091Broken Arrow, Oklahoma · Insured share: 89.7% · Uninsured share: 10.3% · Male insured share: 88.8% · Female insured share: 90.6% · With health insurance: 103,351 · No health insurance: 11,865 · Civilian noninstitutionalized population: 115,216 · Population: 115,919 · Insured margin of error: 1,758 · Uninsured margin of error: 644 · Coverage universe margin of error: 1,872 · Population margin of error: 85 · Males with health insurance: 50,097 · Females with health insurance: 53,254 · Male civilian noninstitutionalized population: 56,447 · Female civilian noninstitutionalized population: 58,769Nampa, Idaho · Insured share: 89.8% · Uninsured share: 10.2% · Male insured share: 88.4% · Female insured share: 91.2% · With health insurance: 94,537 · No health insurance: 10,761 · Civilian noninstitutionalized population: 105,298 · Population: 106,289 · Insured margin of error: 2,240 · Uninsured margin of error: 927 · Coverage universe margin of error: 2,424 · Population margin of error: 52 · Males with health insurance: 46,051 · Females with health insurance: 48,486 · Male civilian noninstitutionalized population: 52,122 · Female civilian noninstitutionalized population: 53,176Raleigh, North Carolina · Insured share: 89.9% · Uninsured share: 10.1% · Male insured share: 88.2% · Female insured share: 91.6% · With health insurance: 417,766 · No health insurance: 46,782 · Civilian noninstitutionalized population: 464,548 · Population: 470,763 · Insured margin of error: 4,986 · Uninsured margin of error: 2,443 · Coverage universe margin of error: 5,553 · Population margin of error: 429 · Males with health insurance: 198,280 · Females with health insurance: 219,486 · Male civilian noninstitutionalized population: 224,825 · Female civilian noninstitutionalized population: 239,723Anchorage, Alaska · Insured share: 90.0% · Uninsured share: 10.0% · Male insured share: 88.6% · Female insured share: 91.3% · With health insurance: 248,756 · No health insurance: 27,758 · Civilian noninstitutionalized population: 276,514 · Population: 289,069 · Insured margin of error: 5,273 · Uninsured margin of error: 1,981 · Coverage universe margin of error: 5,633 · Males with health insurance: 122,008 · Females with health insurance: 126,748 · Male civilian noninstitutionalized population: 137,629 · Female civilian noninstitutionalized population: 138,885Tempe, Arizona · Insured share: 90.0% · Uninsured share: 10.0% · Male insured share: 89.3% · Female insured share: 90.8% · With health insurance: 167,206 · No health insurance: 18,576 · Civilian noninstitutionalized population: 185,782 · Population: 186,419 · Insured margin of error: 3,749 · Uninsured margin of error: 1,357 · Coverage universe margin of error: 3,987 · Population margin of error: 81 · Males with health insurance: 87,865 · Females with health insurance: 79,341 · Male civilian noninstitutionalized population: 98,374 · Female civilian noninstitutionalized population: 87,408Little Rock, Arkansas · Insured share: 90.0% · Uninsured share: 10.0% · Male insured share: 88.0% · Female insured share: 91.7% · With health insurance: 180,103 · No health insurance: 20,066 · Civilian noninstitutionalized population: 200,169 · Population: 202,739 · Insured margin of error: 3,226 · Uninsured margin of error: 1,518 · Coverage universe margin of error: 3,565 · Population margin of error: 78 · Males with health insurance: 82,725 · Females with health insurance: 97,378 · Male civilian noninstitutionalized population: 94,021 · Female civilian noninstitutionalized population: 106,148Los Angeles, California · Insured share: 90.0% · Uninsured share: 10.0% · Male insured share: 88.2% · Female insured share: 91.7% · With health insurance: 3,446,637 · No health insurance: 383,226 · Civilian noninstitutionalized population: 3,829,863 · Population: 3,857,897 · Insured margin of error: 11,443 · Uninsured margin of error: 5,101 · Coverage universe margin of error: 12,528 · Population margin of error: 75 · Males with health insurance: 1,679,143 · Females with health insurance: 1,767,494 · Male civilian noninstitutionalized population: 1,902,797 · Female civilian noninstitutionalized population: 1,927,066South Fulton, Georgia · Insured share: 90.1% · Uninsured share: 9.9% · Male insured share: 89.4% · Female insured share: 90.8% · With health insurance: 97,994 · No health insurance: 10,717 · Civilian noninstitutionalized population: 108,711 · Population: 109,157 · Insured margin of error: 3,601 · Uninsured margin of error: 1,459 · Coverage universe margin of error: 3,885 · Population margin of error: 51 · Males with health insurance: 44,531 · Females with health insurance: 53,463 · Male civilian noninstitutionalized population: 49,830 · Female civilian noninstitutionalized population: 58,881Topeka, Kansas · Insured share: 90.1% · Uninsured share: 9.9% · Male insured share: 88.6% · Female insured share: 91.5% · With health insurance: 110,818 · No health insurance: 12,164 · Civilian noninstitutionalized population: 122,982 · Population: 126,103 · Insured margin of error: 1,639 · Uninsured margin of error: 914 · Coverage universe margin of error: 1,877 · Population margin of error: 43 · Males with health insurance: 52,255 · Females with health insurance: 58,563 · Male civilian noninstitutionalized population: 58,985 · Female civilian noninstitutionalized population: 63,997Norman, Oklahoma · Insured share: 90.1% · Uninsured share: 9.9% · Male insured share: 88.7% · Female insured share: 91.4% · With health insurance: 114,450 · No health insurance: 12,622 · Civilian noninstitutionalized population: 127,072 · Population: 128,714 · Insured margin of error: 2,370 · Uninsured margin of error: 1,178 · Coverage universe margin of error: 2,646 · Population margin of error: 76 · Males with health insurance: 55,563 · Females with health insurance: 58,887 · Male civilian noninstitutionalized population: 62,673 · Female civilian noninstitutionalized population: 64,399Chicago, Illinois · Insured share: 90.2% · Uninsured share: 9.8% · Male insured share: 88.9% · Female insured share: 91.4% · With health insurance: 2,420,422 · No health insurance: 263,488 · Civilian noninstitutionalized population: 2,683,910 · Population: 2,707,648 · Insured margin of error: 9,657 · Uninsured margin of error: 5,004 · Coverage universe margin of error: 10,876 · Population margin of error: 72 · Males with health insurance: 1,153,984 · Females with health insurance: 1,266,438 · Male civilian noninstitutionalized population: 1,297,644 · Female civilian noninstitutionalized population: 1,386,266Columbus, Ohio · Insured share: 90.2% · Uninsured share: 9.8% · Male insured share: 88.2% · Female insured share: 92.2% · With health insurance: 812,682 · No health insurance: 87,901 · Civilian noninstitutionalized population: 900,583 · Population: 906,480 · Insured margin of error: 5,304 · Uninsured margin of error: 2,880 · Coverage universe margin of error: 6,036 · Population margin of error: 134 · Males with health insurance: 390,118 · Females with health insurance: 422,564 · Male civilian noninstitutionalized population: 442,219 · Female civilian noninstitutionalized population: 458,364Richmond, Virginia · Insured share: 90.2% · Uninsured share: 9.8% · Male insured share: 88.0% · Female insured share: 92.1% · With health insurance: 203,028 · No health insurance: 22,135 · Civilian noninstitutionalized population: 225,163 · Population: 227,595 · Insured margin of error: 1,665 · Uninsured margin of error: 1,366 · Coverage universe margin of error: 2,154 · Males with health insurance: 93,427 · Females with health insurance: 109,601 · Male civilian noninstitutionalized population: 106,216 · Female civilian noninstitutionalized population: 118,947Hartford, Connecticut · Insured share: 90.3% · Uninsured share: 9.7% · Male insured share: 88.5% · Female insured share: 91.9% · With health insurance: 106,503 · No health insurance: 11,445 · Civilian noninstitutionalized population: 117,948 · Population: 119,970 · Insured margin of error: 2,511 · Uninsured margin of error: 991 · Coverage universe margin of error: 2,699 · Population margin of error: 53 · Males with health insurance: 49,877 · Females with health insurance: 56,626 · Male civilian noninstitutionalized population: 56,337 · Female civilian noninstitutionalized population: 61,611Aurora, Illinois · Insured share: 90.3% · Uninsured share: 9.7% · Male insured share: 89.1% · Female insured share: 91.4% · With health insurance: 161,612 · No health insurance: 17,427 · Civilian noninstitutionalized population: 179,039 · Population: 179,867 · Insured margin of error: 2,917 · Uninsured margin of error: 1,158 · Coverage universe margin of error: 3,139 · Population margin of error: 480 · Males with health insurance: 79,272 · Females with health insurance: 82,340 · Male civilian noninstitutionalized population: 88,924 · Female civilian noninstitutionalized population: 90,115Omaha, Nebraska · Insured share: 90.3% · Uninsured share: 9.7% · Male insured share: 89.6% · Female insured share: 91.0% · With health insurance: 435,696 · No health insurance: 46,771 · Civilian noninstitutionalized population: 482,467 · Population: 488,197 · Insured margin of error: 2,664 · Uninsured margin of error: 1,749 · Coverage universe margin of error: 3,187 · Population margin of error: 68 · Males with health insurance: 213,588 · Females with health insurance: 222,108 · Male civilian noninstitutionalized population: 238,470 · Female civilian noninstitutionalized population: 243,997Sparks, Nevada · Insured share: 90.3% · Uninsured share: 9.7% · Male insured share: 90.5% · Female insured share: 90.2% · With health insurance: 98,183 · No health insurance: 10,502 · Civilian noninstitutionalized population: 108,685 · Population: 109,106 · Insured margin of error: 2,405 · Uninsured margin of error: 951 · Coverage universe margin of error: 2,586 · Population margin of error: 75 · Males with health insurance: 50,064 · Females with health insurance: 48,119 · Male civilian noninstitutionalized population: 55,337 · Female civilian noninstitutionalized population: 53,348Norwalk, California · Insured share: 90.4% · Uninsured share: 9.6% · Male insured share: 89.3% · Female insured share: 91.5% · With health insurance: 90,152 · No health insurance: 9,548 · Civilian noninstitutionalized population: 99,700 · Population: 100,713 · Insured margin of error: 2,165 · Uninsured margin of error: 794 · Coverage universe margin of error: 2,306 · Population margin of error: 59 · Males with health insurance: 44,856 · Females with health insurance: 45,296 · Male civilian noninstitutionalized population: 50,220 · Female civilian noninstitutionalized population: 49,480Pembroke Pines, Florida · Insured share: 90.4% · Uninsured share: 9.6% · Male insured share: 89.6% · Female insured share: 91.1% · With health insurance: 153,330 · No health insurance: 16,315 · Civilian noninstitutionalized population: 169,645 · Population: 170,557 · Insured margin of error: 3,689 · Uninsured margin of error: 1,406 · Coverage universe margin of error: 3,948 · Population margin of error: 64 · Males with health insurance: 71,862 · Females with health insurance: 81,468 · Male civilian noninstitutionalized population: 80,204 · Female civilian noninstitutionalized population: 89,441Metairie, Louisiana · Insured share: 90.4% · Uninsured share: 9.6% · Male insured share: 87.6% · Female insured share: 93.1% · With health insurance: 125,095 · No health insurance: 13,312 · Civilian noninstitutionalized population: 138,407 · Population: 138,995 · Insured margin of error: 2,704 · Uninsured margin of error: 1,176 · Coverage universe margin of error: 2,949 · Population margin of error: 3,016 · Males with health insurance: 59,277 · Females with health insurance: 65,818 · Male civilian noninstitutionalized population: 67,681 · Female civilian noninstitutionalized population: 70,726Thornton, Colorado · Insured share: 90.5% · Uninsured share: 9.5% · Male insured share: 90.2% · Female insured share: 90.9% · With health insurance: 128,821 · No health insurance: 13,474 · Civilian noninstitutionalized population: 142,295 · Population: 142,878 · Insured margin of error: 2,552 · Uninsured margin of error: 1,206 · Coverage universe margin of error: 2,823 · Population margin of error: 77 · Males with health insurance: 64,414 · Females with health insurance: 64,407 · Male civilian noninstitutionalized population: 71,452 · Female civilian noninstitutionalized population: 70,843Lafayette, Louisiana · Insured share: 90.5% · Uninsured share: 9.5% · Male insured share: 89.0% · Female insured share: 91.8% · With health insurance: 108,511 · No health insurance: 11,433 · Civilian noninstitutionalized population: 119,944 · Population: 121,537 · Insured margin of error: 2,442 · Uninsured margin of error: 1,076 · Coverage universe margin of error: 2,668 · Population margin of error: 75 · Males with health insurance: 51,463 · Females with health insurance: 57,048 · Male civilian noninstitutionalized population: 57,813 · Female civilian noninstitutionalized population: 62,131Huntsville, Alabama · Insured share: 90.6% · Uninsured share: 9.4% · Male insured share: 89.9% · Female insured share: 91.3% · With health insurance: 194,734 · No health insurance: 20,180 · Civilian noninstitutionalized population: 214,914 · Population: 218,814 · Insured margin of error: 2,924 · Uninsured margin of error: 1,413 · Coverage universe margin of error: 3,248 · Population margin of error: 61 · Males with health insurance: 93,727 · Females with health insurance: 101,007 · Male civilian noninstitutionalized population: 104,267 · Female civilian noninstitutionalized population: 110,647Fort Wayne, Indiana · Insured share: 90.6% · Uninsured share: 9.4% · Male insured share: 89.2% · Female insured share: 91.9% · With health insurance: 238,519 · No health insurance: 24,852 · Civilian noninstitutionalized population: 263,371 · Population: 266,235 · Insured margin of error: 2,489 · Uninsured margin of error: 1,361 · Coverage universe margin of error: 2,837 · Population margin of error: 395 · Males with health insurance: 114,674 · Females with health insurance: 123,845 · Male civilian noninstitutionalized population: 128,562 · Female civilian noninstitutionalized population: 134,809Provo, Utah · Insured share: 90.6% · Uninsured share: 9.4% · Male insured share: 89.8% · Female insured share: 91.3% · With health insurance: 102,850 · No health insurance: 10,710 · Civilian noninstitutionalized population: 113,560 · Population: 114,303 · Insured margin of error: 1,872 · Uninsured margin of error: 832 · Coverage universe margin of error: 2,048 · Population margin of error: 48 · Males with health insurance: 49,966 · Females with health insurance: 52,884 · Male civilian noninstitutionalized population: 55,627 · Female civilian noninstitutionalized population: 57,933Ontario, California · Insured share: 90.7% · Uninsured share: 9.3% · Male insured share: 90.1% · Female insured share: 91.3% · With health insurance: 161,337 · No health insurance: 16,564 · Civilian noninstitutionalized population: 177,901 · Population: 178,347 · Insured margin of error: 3,121 · Uninsured margin of error: 1,048 · Coverage universe margin of error: 3,293 · Population margin of error: 66 · Males with health insurance: 78,486 · Females with health insurance: 82,851 · Male civilian noninstitutionalized population: 87,146 · Female civilian noninstitutionalized population: 90,755Riverside, California · Insured share: 90.7% · Uninsured share: 9.3% · Male insured share: 89.5% · Female insured share: 91.8% · With health insurance: 284,795 · No health insurance: 29,254 · Civilian noninstitutionalized population: 314,049 · Population: 316,241 · Insured margin of error: 4,061 · Uninsured margin of error: 1,498 · Coverage universe margin of error: 4,329 · Population margin of error: 115 · Males with health insurance: 139,852 · Females with health insurance: 144,943 · Male civilian noninstitutionalized population: 156,218 · Female civilian noninstitutionalized population: 157,831St. Louis, Missouri · Insured share: 90.7% · Uninsured share: 9.3% · Male insured share: 89.0% · Female insured share: 92.2% · With health insurance: 262,201 · No health insurance: 27,004 · Civilian noninstitutionalized population: 289,205 · Population: 293,109 · Insured margin of error: 1,795 · Uninsured margin of error: 1,490 · Coverage universe margin of error: 2,332 · Males with health insurance: 124,079 · Females with health insurance: 138,122 · Male civilian noninstitutionalized population: 139,410 · Female civilian noninstitutionalized population: 149,795Clarksville, Tennessee · Insured share: 90.7% · Uninsured share: 9.3% · Male insured share: 88.9% · Female insured share: 92.3% · With health insurance: 144,391 · No health insurance: 14,814 · Civilian noninstitutionalized population: 159,205 · Population: 171,897 · Insured margin of error: 2,277 · Uninsured margin of error: 1,204 · Coverage universe margin of error: 2,575 · Population margin of error: 51 · Males with health insurance: 67,161 · Females with health insurance: 77,230 · Male civilian noninstitutionalized population: 75,550 · Female civilian noninstitutionalized population: 83,655Fontana, California · Insured share: 90.8% · Uninsured share: 9.2% · Male insured share: 90.1% · Female insured share: 91.5% · With health insurance: 192,062 · No health insurance: 19,462 · Civilian noninstitutionalized population: 211,524 · Population: 211,921 · Insured margin of error: 3,432 · Uninsured margin of error: 1,195 · Coverage universe margin of error: 3,634 · Population margin of error: 98 · Males with health insurance: 96,373 · Females with health insurance: 95,689 · Male civilian noninstitutionalized population: 106,992 · Female civilian noninstitutionalized population: 104,532Victorville, California · Insured share: 90.8% · Uninsured share: 9.2% · Male insured share: 89.9% · Female insured share: 91.7% · With health insurance: 119,399 · No health insurance: 12,085 · Civilian noninstitutionalized population: 131,484 · Population: 135,983 · Insured margin of error: 3,390 · Uninsured margin of error: 1,148 · Coverage universe margin of error: 3,579 · Population margin of error: 80 · Males with health insurance: 58,224 · Females with health insurance: 61,175 · Male civilian noninstitutionalized population: 64,747 · Female civilian noninstitutionalized population: 66,737Stamford, Connecticut · Insured share: 90.8% · Uninsured share: 9.2% · Male insured share: 88.5% · Female insured share: 93.0% · With health insurance: 122,752 · No health insurance: 12,445 · Civilian noninstitutionalized population: 135,197 · Population: 135,806 · Insured margin of error: 2,581 · Uninsured margin of error: 1,165 · Coverage universe margin of error: 2,832 · Population margin of error: 40 · Males with health insurance: 58,333 · Females with health insurance: 64,419 · Male civilian noninstitutionalized population: 65,948 · Female civilian noninstitutionalized population: 69,249Oceanside, California · Insured share: 90.9% · Uninsured share: 9.1% · Male insured share: 89.9% · Female insured share: 91.8% · With health insurance: 153,155 · No health insurance: 15,348 · Civilian noninstitutionalized population: 168,503 · Population: 172,542 · Insured margin of error: 3,029 · Uninsured margin of error: 1,201 · Coverage universe margin of error: 3,259 · Population margin of error: 76 · Males with health insurance: 75,125 · Females with health insurance: 78,030 · Male civilian noninstitutionalized population: 83,546 · Female civilian noninstitutionalized population: 84,957South Bend, Indiana · Insured share: 90.9% · Uninsured share: 9.1% · Male insured share: 89.5% · Female insured share: 92.2% · With health insurance: 92,106 · No health insurance: 9,228 · Civilian noninstitutionalized population: 101,334 · Population: 102,866 · Insured margin of error: 1,813 · Uninsured margin of error: 781 · Coverage universe margin of error: 1,974 · Population margin of error: 612 · Males with health insurance: 42,925 · Females with health insurance: 49,181 · Male civilian noninstitutionalized population: 47,983 · Female civilian noninstitutionalized population: 53,351Greensboro, North Carolina · Insured share: 90.9% · Uninsured share: 9.1% · Male insured share: 89.8% · Female insured share: 92.0% · With health insurance: 268,853 · No health insurance: 26,769 · Civilian noninstitutionalized population: 295,622 · Population: 298,564 · Insured margin of error: 3,492 · Uninsured margin of error: 1,614 · Coverage universe margin of error: 3,847 · Population margin of error: 102 · Males with health insurance: 122,435 · Females with health insurance: 146,418 · Male civilian noninstitutionalized population: 136,388 · Female civilian noninstitutionalized population: 159,234Norfolk, Virginia · Insured share: 90.9% · Uninsured share: 9.1% · Male insured share: 88.2% · Female insured share: 93.3% · With health insurance: 189,281 · No health insurance: 19,017 · Civilian noninstitutionalized population: 208,298 · Population: 235,037 · Insured margin of error: 1,753 · Uninsured margin of error: 1,181 · Coverage universe margin of error: 2,113 · Males with health insurance: 86,809 · Females with health insurance: 102,472 · Male civilian noninstitutionalized population: 98,451 · Female civilian noninstitutionalized population: 109,847Milwaukee, Wisconsin · Insured share: 90.9% · Uninsured share: 9.1% · Male insured share: 89.1% · Female insured share: 92.5% · With health insurance: 513,867 · No health insurance: 51,731 · Civilian noninstitutionalized population: 565,598 · Population: 569,756 · Insured margin of error: 3,529 · Uninsured margin of error: 1,907 · Coverage universe margin of error: 4,011 · Population margin of error: 49 · Males with health insurance: 243,169 · Females with health insurance: 270,698 · Male civilian noninstitutionalized population: 272,914 · Female civilian noninstitutionalized population: 292,684Long Beach, California · Insured share: 91.0% · Uninsured share: 9.0% · Male insured share: 90.0% · Female insured share: 92.0% · With health insurance: 414,209 · No health insurance: 40,969 · Civilian noninstitutionalized population: 455,178 · Population: 458,491 · Insured margin of error: 4,994 · Uninsured margin of error: 1,768 · Coverage universe margin of error: 5,297 · Population margin of error: 71 · Males with health insurance: 202,547 · Females with health insurance: 211,662 · Male civilian noninstitutionalized population: 225,161 · Female civilian noninstitutionalized population: 230,017Indianapolis city (balance), Indiana · Insured share: 91.0% · Uninsured share: 9.0% · Male insured share: 89.6% · Female insured share: 92.4% · With health insurance: 794,794 · No health insurance: 78,581 · Civilian noninstitutionalized population: 873,375 · Population: 882,043 · Insured margin of error: 4,256 · Uninsured margin of error: 2,853 · Coverage universe margin of error: 5,124 · Population margin of error: 878 · Males with health insurance: 379,558 · Females with health insurance: 415,236 · Male civilian noninstitutionalized population: 423,817 · Female civilian noninstitutionalized population: 449,558Murfreesboro, Tennessee · Insured share: 91.1% · Uninsured share: 8.9% · Male insured share: 90.2% · Female insured share: 92.0% · With health insurance: 142,469 · No health insurance: 13,868 · Civilian noninstitutionalized population: 156,337 · Population: 157,547 · Insured margin of error: 2,833 · Uninsured margin of error: 1,397 · Coverage universe margin of error: 3,158 · Population margin of error: 53 · Males with health insurance: 69,103 · Females with health insurance: 73,366 · Male civilian noninstitutionalized population: 76,583 · Female civilian noninstitutionalized population: 79,754San Tan Valley, Arizona · Insured share: 91.2% · Uninsured share: 8.8% · Male insured share: 90.4% · Female insured share: 92.1% · With health insurance: 95,898 · No health insurance: 9,198 · Civilian noninstitutionalized population: 105,096 · Population: 105,231 · Insured margin of error: 2,572 · Uninsured margin of error: 1,050 · Coverage universe margin of error: 2,778 · Population margin of error: 2,932 · Males with health insurance: 46,969 · Females with health insurance: 48,929 · Male civilian noninstitutionalized population: 51,980 · Female civilian noninstitutionalized population: 53,116Denver, Colorado · Insured share: 91.2% · Uninsured share: 8.8% · Male insured share: 90.1% · Female insured share: 92.4% · With health insurance: 644,528 · No health insurance: 62,025 · Civilian noninstitutionalized population: 706,553 · Population: 713,734 · Insured margin of error: 3,136 · Uninsured margin of error: 2,289 · Coverage universe margin of error: 3,882 · Males with health insurance: 320,339 · Females with health insurance: 324,189 · Male civilian noninstitutionalized population: 355,688 · Female civilian noninstitutionalized population: 350,865Joliet, Illinois · Insured share: 91.2% · Uninsured share: 8.8% · Male insured share: 89.8% · Female insured share: 92.5% · With health insurance: 134,696 · No health insurance: 13,038 · Civilian noninstitutionalized population: 147,734 · Population: 149,785 · Insured margin of error: 2,472 · Uninsured margin of error: 944 · Coverage universe margin of error: 2,646 · Population margin of error: 914 · Males with health insurance: 65,716 · Females with health insurance: 68,980 · Male civilian noninstitutionalized population: 73,143 · Female civilian noninstitutionalized population: 74,591Evansville, Indiana · Insured share: 91.2% · Uninsured share: 8.8% · Male insured share: 89.4% · Female insured share: 93.0% · With health insurance: 104,216 · No health insurance: 10,031 · Civilian noninstitutionalized population: 114,247 · Population: 116,441 · Insured margin of error: 1,694 · Uninsured margin of error: 885 · Coverage universe margin of error: 1,911 · Population margin of error: 34 · Males with health insurance: 49,802 · Females with health insurance: 54,414 · Male civilian noninstitutionalized population: 55,725 · Female civilian noninstitutionalized population: 58,522Manchester, New Hampshire · Insured share: 91.2% · Uninsured share: 8.8% · Male insured share: 90.5% · Female insured share: 91.8% · With health insurance: 103,674 · No health insurance: 10,021 · Civilian noninstitutionalized population: 113,695 · Population: 115,415 · Insured margin of error: 2,278 · Uninsured margin of error: 997 · Coverage universe margin of error: 2,487 · Population margin of error: 61 · Males with health insurance: 50,951 · Females with health insurance: 52,723 · Male civilian noninstitutionalized population: 56,272 · Female civilian noninstitutionalized population: 57,423Everett, Washington · Insured share: 91.2% · Uninsured share: 8.8% · Male insured share: 89.7% · Female insured share: 92.8% · With health insurance: 98,649 · No health insurance: 9,499 · Civilian noninstitutionalized population: 108,148 · Population: 111,083 · Insured margin of error: 2,433 · Uninsured margin of error: 923 · Coverage universe margin of error: 2,602 · Population margin of error: 80 · Males with health insurance: 49,473 · Females with health insurance: 49,176 · Male civilian noninstitutionalized population: 55,133 · Female civilian noninstitutionalized population: 53,015Las Cruces, New Mexico · Insured share: 91.3% · Uninsured share: 8.7% · Male insured share: 90.7% · Female insured share: 91.8% · With health insurance: 101,626 · No health insurance: 9,696 · Civilian noninstitutionalized population: 111,322 · Population: 112,612 · Insured margin of error: 2,480 · Uninsured margin of error: 1,012 · Coverage universe margin of error: 2,679 · Population margin of error: 86 · Males with health insurance: 49,593 · Females with health insurance: 52,033 · Male civilian noninstitutionalized population: 54,662 · Female civilian noninstitutionalized population: 56,660League City, Texas · Insured share: 91.3% · Uninsured share: 8.7% · Male insured share: 91.4% · Female insured share: 91.1% · With health insurance: 104,093 · No health insurance: 9,965 · Civilian noninstitutionalized population: 114,058 · Population: 114,885 · Insured margin of error: 2,633 · Uninsured margin of error: 1,000 · Coverage universe margin of error: 2,817 · Population margin of error: 119 · Males with health insurance: 52,205 · Females with health insurance: 51,888 · Male civilian noninstitutionalized population: 57,103 · Female civilian noninstitutionalized population: 56,955Alexandria, Virginia · Insured share: 91.3% · Uninsured share: 8.7% · Male insured share: 90.6% · Female insured share: 91.8% · With health insurance: 139,162 · No health insurance: 13,339 · Civilian noninstitutionalized population: 152,501 · Population: 156,788 · Insured margin of error: 1,450 · Uninsured margin of error: 1,102 · Coverage universe margin of error: 1,821 · Males with health insurance: 66,092 · Females with health insurance: 73,070 · Male civilian noninstitutionalized population: 72,929 · Female civilian noninstitutionalized population: 79,572Newport News, Virginia · Insured share: 91.3% · Uninsured share: 8.7% · Male insured share: 89.6% · Female insured share: 92.8% · With health insurance: 159,485 · No health insurance: 15,182 · Civilian noninstitutionalized population: 174,667 · Population: 184,774 · Insured margin of error: 1,566 · Uninsured margin of error: 1,092 · Coverage universe margin of error: 1,909 · Males with health insurance: 73,143 · Females with health insurance: 86,342 · Male civilian noninstitutionalized population: 81,675 · Female civilian noninstitutionalized population: 92,992Akron, Ohio · Insured share: 91.4% · Uninsured share: 8.6% · Male insured share: 89.8% · Female insured share: 93.0% · With health insurance: 171,657 · No health insurance: 16,100 · Civilian noninstitutionalized population: 187,757 · Population: 189,526 · Insured margin of error: 2,666 · Uninsured margin of error: 1,180 · Coverage universe margin of error: 2,915 · Population margin of error: 76 · Males with health insurance: 81,441 · Females with health insurance: 90,216 · Male civilian noninstitutionalized population: 90,709 · Female civilian noninstitutionalized population: 97,048McKinney, Texas · Insured share: 91.4% · Uninsured share: 8.6% · Male insured share: 90.6% · Female insured share: 92.1% · With health insurance: 183,324 · No health insurance: 17,301 · Civilian noninstitutionalized population: 200,625 · Population: 202,314 · Insured margin of error: 3,423 · Uninsured margin of error: 1,439 · Coverage universe margin of error: 3,714 · Population margin of error: 65 · Males with health insurance: 90,859 · Females with health insurance: 92,465 · Male civilian noninstitutionalized population: 100,261 · Female civilian noninstitutionalized population: 100,364Kent, Washington · Insured share: 91.4% · Uninsured share: 8.6% · Male insured share: 90.5% · Female insured share: 92.4% · With health insurance: 122,369 · No health insurance: 11,519 · Civilian noninstitutionalized population: 133,888 · Population: 135,015 · Insured margin of error: 2,716 · Uninsured margin of error: 962 · Coverage universe margin of error: 2,881 · Population margin of error: 73 · Males with health insurance: 61,259 · Females with health insurance: 61,110 · Male civilian noninstitutionalized population: 67,722 · Female civilian noninstitutionalized population: 66,166Riverview, Florida · Insured share: 91.5% · Uninsured share: 8.5% · Male insured share: 90.7% · Female insured share: 92.2% · With health insurance: 97,669 · No health insurance: 9,106 · Civilian noninstitutionalized population: 106,775 · Population: 107,776 · Insured margin of error: 3,226 · Uninsured margin of error: 1,310 · Coverage universe margin of error: 3,482 · Population margin of error: 3,794 · Males with health insurance: 46,641 · Females with health insurance: 51,028 · Male civilian noninstitutionalized population: 51,431 · Female civilian noninstitutionalized population: 55,344West Jordan, Utah · Insured share: 91.5% · Uninsured share: 8.5% · Male insured share: 90.6% · Female insured share: 92.4% · With health insurance: 105,884 · No health insurance: 9,869 · Civilian noninstitutionalized population: 115,753 · Population: 116,277 · Insured margin of error: 2,424 · Uninsured margin of error: 943 · Coverage universe margin of error: 2,601 · Population margin of error: 73 · Males with health insurance: 53,707 · Females with health insurance: 52,177 · Male civilian noninstitutionalized population: 59,295 · Female civilian noninstitutionalized population: 56,458Corona, California · Insured share: 91.6% · Uninsured share: 8.4% · Male insured share: 91.2% · Female insured share: 91.9% · With health insurance: 144,770 · No health insurance: 13,279 · Civilian noninstitutionalized population: 158,049 · Population: 158,839 · Insured margin of error: 2,834 · Uninsured margin of error: 1,026 · Coverage universe margin of error: 3,014 · Population margin of error: 97 · Males with health insurance: 72,069 · Females with health insurance: 72,701 · Male civilian noninstitutionalized population: 78,980 · Female civilian noninstitutionalized population: 79,069New Orleans, Louisiana · Insured share: 91.6% · Uninsured share: 8.4% · Male insured share: 88.7% · Female insured share: 94.1% · With health insurance: 340,157 · No health insurance: 31,392 · Civilian noninstitutionalized population: 371,549 · Population: 376,035 · Insured margin of error: 2,083 · Uninsured margin of error: 1,583 · Coverage universe margin of error: 2,616 · Males with health insurance: 154,545 · Females with health insurance: 185,612 · Male civilian noninstitutionalized population: 174,233 · Female civilian noninstitutionalized population: 197,316Enterprise, Nevada · Insured share: 91.6% · Uninsured share: 8.4% · Male insured share: 91.3% · Female insured share: 92.0% · With health insurance: 212,281 · No health insurance: 19,385 · Civilian noninstitutionalized population: 231,666 · Population: 232,043 · Insured margin of error: 4,083 · Uninsured margin of error: 1,488 · Coverage universe margin of error: 4,346 · Population margin of error: 5,278 · Males with health insurance: 104,944 · Females with health insurance: 107,337 · Male civilian noninstitutionalized population: 114,974 · Female civilian noninstitutionalized population: 116,692Jersey City, New Jersey · Insured share: 91.6% · Uninsured share: 8.4% · Male insured share: 90.7% · Female insured share: 92.5% · With health insurance: 264,540 · No health insurance: 24,303 · Civilian noninstitutionalized population: 288,843 · Population: 289,691 · Insured margin of error: 3,493 · Uninsured margin of error: 1,418 · Coverage universe margin of error: 3,770 · Population margin of error: 57 · Males with health insurance: 132,211 · Females with health insurance: 132,329 · Male civilian noninstitutionalized population: 145,825 · Female civilian noninstitutionalized population: 143,018Allen, Texas · Insured share: 91.6% · Uninsured share: 8.4% · Male insured share: 91.7% · Female insured share: 91.5% · With health insurance: 98,312 · No health insurance: 9,038 · Civilian noninstitutionalized population: 107,350 · Population: 107,684 · Insured margin of error: 2,722 · Uninsured margin of error: 1,102 · Coverage universe margin of error: 2,936 · Population margin of error: 44 · Males with health insurance: 49,072 · Females with health insurance: 49,240 · Male civilian noninstitutionalized population: 53,520 · Female civilian noninstitutionalized population: 53,830Vancouver, Washington · Insured share: 91.6% · Uninsured share: 8.4% · Male insured share: 90.3% · Female insured share: 92.9% · With health insurance: 175,043 · No health insurance: 16,015 · Civilian noninstitutionalized population: 191,058 · Population: 192,696 · Insured margin of error: 2,622 · Uninsured margin of error: 1,132 · Coverage universe margin of error: 2,856 · Population margin of error: 110 · Males with health insurance: 85,093 · Females with health insurance: 89,950 · Male civilian noninstitutionalized population: 94,230 · Female civilian noninstitutionalized population: 96,828Green Bay, Wisconsin · Insured share: 91.6% · Uninsured share: 8.4% · Male insured share: 90.2% · Female insured share: 92.9% · With health insurance: 96,761 · No health insurance: 8,922 · Civilian noninstitutionalized population: 105,683 · Population: 106,585 · Insured margin of error: 1,897 · Uninsured margin of error: 768 · Coverage universe margin of error: 2,046 · Population margin of error: 91 · Males with health insurance: 47,118 · Females with health insurance: 49,643 · Male civilian noninstitutionalized population: 52,218 · Female civilian noninstitutionalized population: 53,465Albuquerque, New Mexico · Insured share: 91.7% · Uninsured share: 8.3% · Male insured share: 90.4% · Female insured share: 93.0% · With health insurance: 511,401 · No health insurance: 46,270 · Civilian noninstitutionalized population: 557,671 · Population: 562,488 · Insured margin of error: 3,375 · Uninsured margin of error: 2,075 · Coverage universe margin of error: 3,962 · Population margin of error: 118 · Males with health insurance: 246,156 · Females with health insurance: 265,245 · Male civilian noninstitutionalized population: 272,320 · Female civilian noninstitutionalized population: 285,351Concord, North Carolina · Insured share: 91.7% · Uninsured share: 8.3% · Male insured share: 90.6% · Female insured share: 92.8% · With health insurance: 96,529 · No health insurance: 8,720 · Civilian noninstitutionalized population: 105,249 · Population: 106,518 · Insured margin of error: 2,180 · Uninsured margin of error: 952 · Coverage universe margin of error: 2,378 · Population margin of error: 49 · Males with health insurance: 46,005 · Females with health insurance: 50,524 · Male civilian noninstitutionalized population: 50,777 · Female civilian noninstitutionalized population: 54,472Dayton, Ohio · Insured share: 91.7% · Uninsured share: 8.3% · Male insured share: 90.3% · Female insured share: 93.1% · With health insurance: 122,825 · No health insurance: 11,047 · Civilian noninstitutionalized population: 133,872 · Population: 136,741 · Insured margin of error: 2,650 · Uninsured margin of error: 914 · Coverage universe margin of error: 2,803 · Population margin of error: 70 · Males with health insurance: 59,716 · Females with health insurance: 63,109 · Male civilian noninstitutionalized population: 66,110 · Female civilian noninstitutionalized population: 67,762Gresham, Oregon · Insured share: 91.7% · Uninsured share: 8.3% · Male insured share: 90.4% · Female insured share: 92.9% · With health insurance: 102,816 · No health insurance: 9,358 · Civilian noninstitutionalized population: 112,174 · Population: 112,818 · Insured margin of error: 2,644 · Uninsured margin of error: 1,050 · Coverage universe margin of error: 2,845 · Population margin of error: 58 · Males with health insurance: 50,891 · Females with health insurance: 51,925 · Male civilian noninstitutionalized population: 56,288 · Female civilian noninstitutionalized population: 55,886Richmond, California · Insured share: 91.8% · Uninsured share: 8.2% · Male insured share: 90.0% · Female insured share: 93.4% · With health insurance: 105,162 · No health insurance: 9,443 · Civilian noninstitutionalized population: 114,605 · Population: 115,396 · Insured margin of error: 2,564 · Uninsured margin of error: 943 · Coverage universe margin of error: 2,732 · Population margin of error: 54 · Males with health insurance: 50,912 · Females with health insurance: 54,250 · Male civilian noninstitutionalized population: 56,548 · Female civilian noninstitutionalized population: 58,057Gainesville, Florida · Insured share: 91.8% · Uninsured share: 8.2% · Male insured share: 90.2% · Female insured share: 93.3% · With health insurance: 130,199 · No health insurance: 11,597 · Civilian noninstitutionalized population: 141,796 · Population: 143,611 · Insured margin of error: 2,445 · Uninsured margin of error: 1,121 · Coverage universe margin of error: 2,690 · Population margin of error: 98 · Males with health insurance: 60,871 · Females with health insurance: 69,328 · Male civilian noninstitutionalized population: 67,462 · Female civilian noninstitutionalized population: 74,334Sandy Springs, Georgia · Insured share: 91.8% · Uninsured share: 8.2% · Male insured share: 90.7% · Female insured share: 92.8% · With health insurance: 97,862 · No health insurance: 8,756 · Civilian noninstitutionalized population: 106,618 · Population: 107,198 · Insured margin of error: 2,847 · Uninsured margin of error: 1,069 · Coverage universe margin of error: 3,041 · Population margin of error: 40 · Males with health insurance: 46,268 · Females with health insurance: 51,594 · Male civilian noninstitutionalized population: 51,001 · Female civilian noninstitutionalized population: 55,617Garden Grove, California · Insured share: 91.9% · Uninsured share: 8.1% · Male insured share: 91.0% · Female insured share: 92.8% · With health insurance: 156,125 · No health insurance: 13,795 · Civilian noninstitutionalized population: 169,920 · Population: 170,603 · Insured margin of error: 2,709 · Uninsured margin of error: 899 · Coverage universe margin of error: 2,854 · Population margin of error: 85 · Males with health insurance: 77,312 · Females with health insurance: 78,813 · Male civilian noninstitutionalized population: 84,958 · Female civilian noninstitutionalized population: 84,962Palmdale, California · Insured share: 91.9% · Uninsured share: 8.1% · Male insured share: 90.9% · Female insured share: 92.9% · With health insurance: 151,965 · No health insurance: 13,380 · Civilian noninstitutionalized population: 165,345 · Population: 165,487 · Insured margin of error: 3,099 · Uninsured margin of error: 1,018 · Coverage universe margin of error: 3,262 · Population margin of error: 66 · Males with health insurance: 73,941 · Females with health insurance: 78,024 · Male civilian noninstitutionalized population: 81,319 · Female civilian noninstitutionalized population: 84,026Tallahassee, Florida · Insured share: 91.9% · Uninsured share: 8.1% · Male insured share: 91.1% · Female insured share: 92.6% · With health insurance: 180,567 · No health insurance: 15,896 · Civilian noninstitutionalized population: 196,463 · Population: 199,696 · Insured margin of error: 2,506 · Uninsured margin of error: 1,242 · Coverage universe margin of error: 2,797 · Population margin of error: 118 · Males with health insurance: 83,589 · Females with health insurance: 96,978 · Male civilian noninstitutionalized population: 91,745 · Female civilian noninstitutionalized population: 104,718Columbia, South Carolina · Insured share: 91.9% · Uninsured share: 8.1% · Male insured share: 90.0% · Female insured share: 93.6% · With health insurance: 111,412 · No health insurance: 9,772 · Civilian noninstitutionalized population: 121,184 · Population: 138,019 · Insured margin of error: 2,678 · Uninsured margin of error: 974 · Coverage universe margin of error: 2,850 · Population margin of error: 187 · Males with health insurance: 51,577 · Females with health insurance: 59,835 · Male civilian noninstitutionalized population: 57,286 · Female civilian noninstitutionalized population: 63,898College Station, Texas · Insured share: 91.9% · Uninsured share: 8.1% · Male insured share: 91.3% · Female insured share: 92.5% · With health insurance: 112,068 · No health insurance: 9,868 · Civilian noninstitutionalized population: 121,936 · Population: 122,280 · Insured margin of error: 2,191 · Uninsured margin of error: 930 · Coverage universe margin of error: 2,380 · Population margin of error: 66 · Males with health insurance: 57,230 · Females with health insurance: 54,838 · Male civilian noninstitutionalized population: 62,650 · Female civilian noninstitutionalized population: 59,286Bakersfield, California · Insured share: 92.1% · Uninsured share: 7.9% · Male insured share: 90.7% · Female insured share: 93.5% · With health insurance: 374,494 · No health insurance: 31,941 · Civilian noninstitutionalized population: 406,435 · Population: 408,366 · Insured margin of error: 4,401 · Uninsured margin of error: 1,812 · Coverage universe margin of error: 4,760 · Population margin of error: 97 · Males with health insurance: 182,391 · Females with health insurance: 192,103 · Male civilian noninstitutionalized population: 201,054 · Female civilian noninstitutionalized population: 205,381Shreveport, Louisiana · Insured share: 92.1% · Uninsured share: 7.9% · Male insured share: 90.7% · Female insured share: 93.3% · With health insurance: 164,475 · No health insurance: 14,107 · Civilian noninstitutionalized population: 178,582 · Population: 183,483 · Insured margin of error: 2,226 · Uninsured margin of error: 1,310 · Coverage universe margin of error: 2,583 · Population margin of error: 60 · Males with health insurance: 75,681 · Females with health insurance: 88,794 · Male civilian noninstitutionalized population: 83,456 · Female civilian noninstitutionalized population: 95,126Downey, California · Insured share: 92.2% · Uninsured share: 7.8% · Male insured share: 91.5% · Female insured share: 92.7% · With health insurance: 102,374 · No health insurance: 8,716 · Civilian noninstitutionalized population: 111,090 · Population: 111,793 · Insured margin of error: 2,469 · Uninsured margin of error: 776 · Coverage universe margin of error: 2,588 · Population margin of error: 61 · Males with health insurance: 48,813 · Females with health insurance: 53,561 · Male civilian noninstitutionalized population: 53,322 · Female civilian noninstitutionalized population: 57,768Sioux Falls, South Dakota · Insured share: 92.2% · Uninsured share: 7.8% · Male insured share: 91.1% · Female insured share: 93.2% · With health insurance: 179,469 · No health insurance: 15,254 · Civilian noninstitutionalized population: 194,723 · Population: 197,642 · Insured margin of error: 2,014 · Uninsured margin of error: 1,125 · Coverage universe margin of error: 2,307 · Population margin of error: 66 · Males with health insurance: 89,023 · Females with health insurance: 90,446 · Male civilian noninstitutionalized population: 97,718 · Female civilian noninstitutionalized population: 97,005Colorado Springs, Colorado · Insured share: 92.3% · Uninsured share: 7.7% · Male insured share: 91.2% · Female insured share: 93.3% · With health insurance: 430,399 · No health insurance: 35,929 · Civilian noninstitutionalized population: 466,328 · Population: 483,099 · Insured margin of error: 3,787 · Uninsured margin of error: 1,721 · Coverage universe margin of error: 4,160 · Population margin of error: 79 · Males with health insurance: 208,214 · Females with health insurance: 222,185 · Male civilian noninstitutionalized population: 228,202 · Female civilian noninstitutionalized population: 238,126Boise City, Idaho · Insured share: 92.3% · Uninsured share: 7.7% · Male insured share: 91.0% · Female insured share: 93.7% · With health insurance: 215,254 · No health insurance: 17,860 · Civilian noninstitutionalized population: 233,114 · Population: 235,701 · Insured margin of error: 3,087 · Uninsured margin of error: 1,209 · Coverage universe margin of error: 3,316 · Population margin of error: 54 · Males with health insurance: 106,412 · Females with health insurance: 108,842 · Male civilian noninstitutionalized population: 116,943 · Female civilian noninstitutionalized population: 116,171Grand Rapids, Michigan · Insured share: 92.3% · Uninsured share: 7.7% · Male insured share: 91.0% · Female insured share: 93.6% · With health insurance: 179,475 · No health insurance: 14,966 · Civilian noninstitutionalized population: 194,441 · Population: 197,768 · Insured margin of error: 2,975 · Uninsured margin of error: 1,142 · Coverage universe margin of error: 3,186 · Population margin of error: 88 · Males with health insurance: 86,395 · Females with health insurance: 93,080 · Male civilian noninstitutionalized population: 94,989 · Female civilian noninstitutionalized population: 99,452Cleveland, Ohio · Insured share: 92.3% · Uninsured share: 7.7% · Male insured share: 90.2% · Female insured share: 94.2% · With health insurance: 334,109 · No health insurance: 27,948 · Civilian noninstitutionalized population: 362,057 · Population: 367,523 · Insured margin of error: 3,860 · Uninsured margin of error: 1,522 · Coverage universe margin of error: 4,149 · Population margin of error: 61 · Males with health insurance: 157,378 · Females with health insurance: 176,731 · Male civilian noninstitutionalized population: 174,522 · Female civilian noninstitutionalized population: 187,535Sugar Land, Texas · Insured share: 92.3% · Uninsured share: 7.7% · Male insured share: 91.7% · Female insured share: 93.0% · With health insurance: 101,103 · No health insurance: 8,394 · Civilian noninstitutionalized population: 109,497 · Population: 109,735 · Insured margin of error: 2,613 · Uninsured margin of error: 1,085 · Coverage universe margin of error: 2,829 · Population margin of error: 64 · Males with health insurance: 48,975 · Females with health insurance: 52,128 · Male civilian noninstitutionalized population: 53,425 · Female civilian noninstitutionalized population: 56,072Goodyear, Arizona · Insured share: 92.4% · Uninsured share: 7.6% · Male insured share: 92.7% · Female insured share: 92.2% · With health insurance: 90,115 · No health insurance: 7,379 · Civilian noninstitutionalized population: 97,494 · Population: 102,891 · Insured margin of error: 2,615 · Uninsured margin of error: 974 · Coverage universe margin of error: 2,791 · Population margin of error: 62 · Males with health insurance: 45,065 · Females with health insurance: 45,050 · Male civilian noninstitutionalized population: 48,635 · Female civilian noninstitutionalized population: 48,859Lakewood, Colorado · Insured share: 92.4% · Uninsured share: 7.6% · Male insured share: 91.8% · Female insured share: 93.0% · With health insurance: 142,901 · No health insurance: 11,750 · Civilian noninstitutionalized population: 154,651 · Population: 156,309 · Insured margin of error: 2,553 · Uninsured margin of error: 989 · Coverage universe margin of error: 2,738 · Population margin of error: 154 · Males with health insurance: 71,050 · Females with health insurance: 71,851 · Male civilian noninstitutionalized population: 77,430 · Female civilian noninstitutionalized population: 77,221Waterbury, Connecticut · Insured share: 92.4% · Uninsured share: 7.6% · Male insured share: 91.1% · Female insured share: 93.8% · With health insurance: 104,929 · No health insurance: 8,573 · Civilian noninstitutionalized population: 113,502 · Population: 114,356 · Insured margin of error: 2,523 · Uninsured margin of error: 913 · Coverage universe margin of error: 2,683 · Population margin of error: 39 · Males with health insurance: 50,287 · Females with health insurance: 54,642 · Male civilian noninstitutionalized population: 55,226 · Female civilian noninstitutionalized population: 58,276Cincinnati, Ohio · Insured share: 92.4% · Uninsured share: 7.6% · Male insured share: 91.1% · Female insured share: 93.7% · With health insurance: 281,839 · No health insurance: 23,060 · Civilian noninstitutionalized population: 304,899 · Population: 309,595 · Insured margin of error: 3,676 · Uninsured margin of error: 1,529 · Coverage universe margin of error: 3,981 · Population margin of error: 63 · Males with health insurance: 133,168 · Females with health insurance: 148,671 · Male civilian noninstitutionalized population: 146,223 · Female civilian noninstitutionalized population: 158,676New Haven, Connecticut · Insured share: 92.5% · Uninsured share: 7.5% · Male insured share: 91.6% · Female insured share: 93.3% · With health insurance: 121,810 · No health insurance: 9,887 · Civilian noninstitutionalized population: 131,697 · Population: 132,893 · Insured margin of error: 2,800 · Uninsured margin of error: 930 · Coverage universe margin of error: 2,951 · Population margin of error: 76 · Males with health insurance: 57,368 · Females with health insurance: 64,442 · Male civilian noninstitutionalized population: 62,627 · Female civilian noninstitutionalized population: 69,070Detroit, Michigan · Insured share: 92.5% · Uninsured share: 7.5% · Male insured share: 90.6% · Female insured share: 94.2% · With health insurance: 584,086 · No health insurance: 47,538 · Civilian noninstitutionalized population: 631,624 · Population: 636,644 · Insured margin of error: 4,343 · Uninsured margin of error: 2,020 · Coverage universe margin of error: 4,790 · Population margin of error: 159 · Males with health insurance: 270,801 · Females with health insurance: 313,285 · Male civilian noninstitutionalized population: 299,022 · Female civilian noninstitutionalized population: 332,602Renton, Washington · Insured share: 92.5% · Uninsured share: 7.5% · Male insured share: 91.4% · Female insured share: 93.5% · With health insurance: 97,020 · No health insurance: 7,905 · Civilian noninstitutionalized population: 104,925 · Population: 105,279 · Insured margin of error: 2,479 · Uninsured margin of error: 875 · Coverage universe margin of error: 2,629 · Population margin of error: 70 · Males with health insurance: 47,968 · Females with health insurance: 49,052 · Male civilian noninstitutionalized population: 52,483 · Female civilian noninstitutionalized population: 52,442Westminster, Colorado · Insured share: 92.6% · Uninsured share: 7.4% · Male insured share: 91.0% · Female insured share: 94.1% · With health insurance: 106,439 · No health insurance: 8,546 · Civilian noninstitutionalized population: 114,985 · Population: 115,546 · Insured margin of error: 2,459 · Uninsured margin of error: 915 · Coverage universe margin of error: 2,624 · Population margin of error: 83 · Males with health insurance: 52,620 · Females with health insurance: 53,819 · Male civilian noninstitutionalized population: 57,797 · Female civilian noninstitutionalized population: 57,188Salem, Oregon · Insured share: 92.6% · Uninsured share: 7.4% · Male insured share: 91.2% · Female insured share: 93.9% · With health insurance: 158,585 · No health insurance: 12,729 · Civilian noninstitutionalized population: 171,314 · Population: 176,666 · Insured margin of error: 2,682 · Uninsured margin of error: 1,126 · Coverage universe margin of error: 2,909 · Population margin of error: 96 · Males with health insurance: 77,129 · Females with health insurance: 81,456 · Male civilian noninstitutionalized population: 84,586 · Female civilian noninstitutionalized population: 86,728Providence, Rhode Island · Insured share: 92.6% · Uninsured share: 7.4% · Male insured share: 91.7% · Female insured share: 93.4% · With health insurance: 173,710 · No health insurance: 13,910 · Civilian noninstitutionalized population: 187,620 · Population: 190,214 · Insured margin of error: 3,275 · Uninsured margin of error: 1,325 · Coverage universe margin of error: 3,532 · Population margin of error: 61 · Males with health insurance: 84,642 · Females with health insurance: 89,068 · Male civilian noninstitutionalized population: 92,255 · Female civilian noninstitutionalized population: 95,365Fullerton, California · Insured share: 92.7% · Uninsured share: 7.3% · Male insured share: 91.7% · Female insured share: 93.6% · With health insurance: 130,175 · No health insurance: 10,265 · Civilian noninstitutionalized population: 140,440 · Population: 141,278 · Insured margin of error: 2,975 · Uninsured margin of error: 1,117 · Coverage universe margin of error: 3,178 · Population margin of error: 65 · Males with health insurance: 64,173 · Females with health insurance: 66,002 · Male civilian noninstitutionalized population: 69,961 · Female civilian noninstitutionalized population: 70,479Tuscaloosa, Alabama · Insured share: 92.8% · Uninsured share: 7.2% · Male insured share: 92.0% · Female insured share: 93.5% · With health insurance: 98,823 · No health insurance: 7,659 · Civilian noninstitutionalized population: 106,482 · Population: 107,699 · Insured margin of error: 2,628 · Uninsured margin of error: 930 · Coverage universe margin of error: 2,788 · Population margin of error: 46 · Males with health insurance: 46,805 · Females with health insurance: 52,018 · Male civilian noninstitutionalized population: 50,871 · Female civilian noninstitutionalized population: 55,611Davenport, Iowa · Insured share: 92.8% · Uninsured share: 7.2% · Male insured share: 91.1% · Female insured share: 94.6% · With health insurance: 92,624 · No health insurance: 7,150 · Civilian noninstitutionalized population: 99,774 · Population: 101,083 · Insured margin of error: 1,492 · Uninsured margin of error: 721 · Coverage universe margin of error: 1,657 · Population margin of error: 34 · Males with health insurance: 45,012 · Females with health insurance: 47,612 · Male civilian noninstitutionalized population: 49,423 · Female civilian noninstitutionalized population: 50,351Philadelphia, Pennsylvania · Insured share: 92.8% · Uninsured share: 7.2% · Male insured share: 91.4% · Female insured share: 94.2% · With health insurance: 1,457,523 · No health insurance: 112,579 · Civilian noninstitutionalized population: 1,570,102 · Population: 1,582,432 · Insured margin of error: 4,772 · Uninsured margin of error: 3,750 · Coverage universe margin of error: 6,070 · Males with health insurance: 677,929 · Females with health insurance: 779,594 · Male civilian noninstitutionalized population: 742,078 · Female civilian noninstitutionalized population: 828,024Tacoma, Washington · Insured share: 92.8% · Uninsured share: 7.2% · Male insured share: 91.6% · Female insured share: 94.0% · With health insurance: 200,143 · No health insurance: 15,490 · Civilian noninstitutionalized population: 215,633 · Population: 220,482 · Insured margin of error: 3,081 · Uninsured margin of error: 1,123 · Coverage universe margin of error: 3,279 · Population margin of error: 73 · Males with health insurance: 97,883 · Females with health insurance: 102,260 · Male civilian noninstitutionalized population: 106,874 · Female civilian noninstitutionalized population: 108,759Chandler, Arizona · Insured share: 92.9% · Uninsured share: 7.1% · Male insured share: 92.3% · Female insured share: 93.5% · With health insurance: 257,755 · No health insurance: 19,757 · Civilian noninstitutionalized population: 277,512 · Population: 278,123 · Insured margin of error: 3,952 · Uninsured margin of error: 1,410 · Coverage universe margin of error: 4,196 · Population margin of error: 77 · Males with health insurance: 128,346 · Females with health insurance: 129,409 · Male civilian noninstitutionalized population: 139,098 · Female civilian noninstitutionalized population: 138,414Peoria, Arizona · Insured share: 93.0% · Uninsured share: 7.0% · Male insured share: 92.4% · Female insured share: 93.6% · With health insurance: 179,159 · No health insurance: 13,474 · Civilian noninstitutionalized population: 192,633 · Population: 194,338 · Insured margin of error: 3,500 · Uninsured margin of error: 1,097 · Coverage universe margin of error: 3,667 · Population margin of error: 207 · Males with health insurance: 86,383 · Females with health insurance: 92,776 · Male civilian noninstitutionalized population: 93,483 · Female civilian noninstitutionalized population: 99,150Rockford, Illinois · Insured share: 93.0% · Uninsured share: 7.0% · Male insured share: 91.6% · Female insured share: 94.2% · With health insurance: 134,850 · No health insurance: 10,178 · Civilian noninstitutionalized population: 145,028 · Population: 147,649 · Insured margin of error: 1,957 · Uninsured margin of error: 863 · Coverage universe margin of error: 2,139 · Population margin of error: 300 · Males with health insurance: 64,504 · Females with health insurance: 70,346 · Male civilian noninstitutionalized population: 70,386 · Female civilian noninstitutionalized population: 74,642Pearland, Texas · Insured share: 93.0% · Uninsured share: 7.0% · Male insured share: 92.4% · Female insured share: 93.6% · With health insurance: 116,438 · No health insurance: 8,773 · Civilian noninstitutionalized population: 125,211 · Population: 125,983 · Insured margin of error: 2,814 · Uninsured margin of error: 927 · Coverage universe margin of error: 2,963 · Population margin of error: 75 · Males with health insurance: 55,881 · Females with health insurance: 60,557 · Male civilian noninstitutionalized population: 60,482 · Female civilian noninstitutionalized population: 64,729Chula Vista, California · Insured share: 93.1% · Uninsured share: 6.9% · Male insured share: 92.4% · Female insured share: 93.9% · With health insurance: 250,438 · No health insurance: 18,451 · Civilian noninstitutionalized population: 268,889 · Population: 275,030 · Insured margin of error: 4,294 · Uninsured margin of error: 1,311 · Coverage universe margin of error: 4,490 · Population margin of error: 61 · Males with health insurance: 121,488 · Females with health insurance: 128,950 · Male civilian noninstitutionalized population: 131,493 · Female civilian noninstitutionalized population: 137,396Olathe, Kansas · Insured share: 93.1% · Uninsured share: 6.9% · Male insured share: 92.3% · Female insured share: 93.9% · With health insurance: 132,640 · No health insurance: 9,829 · Civilian noninstitutionalized population: 142,469 · Population: 143,720 · Insured margin of error: 2,503 · Uninsured margin of error: 909 · Coverage universe margin of error: 2,663 · Population margin of error: 63 · Males with health insurance: 65,755 · Females with health insurance: 66,885 · Male civilian noninstitutionalized population: 71,211 · Female civilian noninstitutionalized population: 71,258Billings, Montana · Insured share: 93.1% · Uninsured share: 6.9% · Male insured share: 91.5% · Female insured share: 94.8% · With health insurance: 108,387 · No health insurance: 7,971 · Civilian noninstitutionalized population: 116,358 · Population: 118,321 · Insured margin of error: 1,716 · Uninsured margin of error: 812 · Coverage universe margin of error: 1,898 · Population margin of error: 43 · Males with health insurance: 52,878 · Females with health insurance: 55,509 · Male civilian noninstitutionalized population: 57,792 · Female civilian noninstitutionalized population: 58,566Hampton, Virginia · Insured share: 93.1% · Uninsured share: 6.9% · Male insured share: 91.9% · Female insured share: 94.1% · With health insurance: 121,319 · No health insurance: 9,020 · Civilian noninstitutionalized population: 130,339 · Population: 137,334 · Insured margin of error: 1,288 · Uninsured margin of error: 914 · Coverage universe margin of error: 1,580 · Males with health insurance: 55,696 · Females with health insurance: 65,623 · Male civilian noninstitutionalized population: 60,607 · Female civilian noninstitutionalized population: 69,732Stockton, California · Insured share: 93.2% · Uninsured share: 6.8% · Male insured share: 91.8% · Female insured share: 94.5% · With health insurance: 296,880 · No health insurance: 21,621 · Civilian noninstitutionalized population: 318,501 · Population: 320,470 · Insured margin of error: 3,501 · Uninsured margin of error: 1,386 · Coverage universe margin of error: 3,765 · Population margin of error: 131 · Males with health insurance: 142,468 · Females with health insurance: 154,412 · Male civilian noninstitutionalized population: 155,123 · Female civilian noninstitutionalized population: 163,378Peoria, Illinois · Insured share: 93.2% · Uninsured share: 6.8% · Male insured share: 92.5% · Female insured share: 93.8% · With health insurance: 103,251 · No health insurance: 7,575 · Civilian noninstitutionalized population: 110,826 · Population: 112,126 · Insured margin of error: 1,653 · Uninsured margin of error: 758 · Coverage universe margin of error: 1,819 · Population margin of error: 429 · Males with health insurance: 49,843 · Females with health insurance: 53,408 · Male civilian noninstitutionalized population: 53,880 · Female civilian noninstitutionalized population: 56,946Lexington-Fayette urban county, Kentucky · Insured share: 93.2% · Uninsured share: 6.8% · Male insured share: 91.5% · Female insured share: 94.7% · With health insurance: 295,011 · No health insurance: 21,680 · Civilian noninstitutionalized population: 316,691 · Population: 321,122 · Insured margin of error: 1,751 · Uninsured margin of error: 1,297 · Coverage universe margin of error: 2,180 · Males with health insurance: 142,018 · Females with health insurance: 152,993 · Male civilian noninstitutionalized population: 155,197 · Female civilian noninstitutionalized population: 161,494Henderson, Nevada · Insured share: 93.2% · Uninsured share: 6.8% · Male insured share: 92.6% · Female insured share: 93.8% · With health insurance: 300,754 · No health insurance: 21,831 · Civilian noninstitutionalized population: 322,585 · Population: 324,523 · Insured margin of error: 4,184 · Uninsured margin of error: 1,415 · Coverage universe margin of error: 4,417 · Population margin of error: 51 · Males with health insurance: 148,012 · Females with health insurance: 152,742 · Male civilian noninstitutionalized population: 159,765 · Female civilian noninstitutionalized population: 162,820Bend, Oregon · Insured share: 93.2% · Uninsured share: 6.8% · Male insured share: 92.2% · Female insured share: 94.3% · With health insurance: 94,326 · No health insurance: 6,867 · Civilian noninstitutionalized population: 101,193 · Population: 101,472 · Insured margin of error: 2,049 · Uninsured margin of error: 859 · Coverage universe margin of error: 2,222 · Population margin of error: 76 · Males with health insurance: 46,854 · Females with health insurance: 47,472 · Male civilian noninstitutionalized population: 50,828 · Female civilian noninstitutionalized population: 50,365The Woodlands, Texas · Insured share: 93.2% · Uninsured share: 6.8% · Male insured share: 92.2% · Female insured share: 94.2% · With health insurance: 108,476 · No health insurance: 7,929 · Civilian noninstitutionalized population: 116,405 · Population: 116,916 · Insured margin of error: 3,300 · Uninsured margin of error: 1,011 · Coverage universe margin of error: 3,452 · Population margin of error: 5,154 · Males with health insurance: 53,315 · Females with health insurance: 55,161 · Male civilian noninstitutionalized population: 57,851 · Female civilian noninstitutionalized population: 58,554Antioch, California · Insured share: 93.3% · Uninsured share: 6.7% · Male insured share: 92.1% · Female insured share: 94.3% · With health insurance: 107,695 · No health insurance: 7,756 · Civilian noninstitutionalized population: 115,451 · Population: 115,759 · Insured margin of error: 2,747 · Uninsured margin of error: 974 · Coverage universe margin of error: 2,914 · Population margin of error: 110 · Males with health insurance: 49,884 · Females with health insurance: 57,811 · Male civilian noninstitutionalized population: 54,143 · Female civilian noninstitutionalized population: 61,308Glendale, California · Insured share: 93.3% · Uninsured share: 6.7% · Male insured share: 92.5% · Female insured share: 94.0% · With health insurance: 178,098 · No health insurance: 12,828 · Civilian noninstitutionalized population: 190,926 · Population: 192,270 · Insured margin of error: 3,372 · Uninsured margin of error: 1,023 · Coverage universe margin of error: 3,524 · Population margin of error: 67 · Males with health insurance: 84,663 · Females with health insurance: 93,435 · Male civilian noninstitutionalized population: 91,565 · Female civilian noninstitutionalized population: 99,361Des Moines, Iowa · Insured share: 93.3% · Uninsured share: 6.7% · Male insured share: 91.9% · Female insured share: 94.8% · With health insurance: 196,806 · No health insurance: 14,067 · Civilian noninstitutionalized population: 210,873 · Population: 212,464 · Insured margin of error: 2,712 · Uninsured margin of error: 981 · Coverage universe margin of error: 2,884 · Population margin of error: 185 · Males with health insurance: 96,026 · Females with health insurance: 100,780 · Male civilian noninstitutionalized population: 104,515 · Female civilian noninstitutionalized population: 106,358Lincoln, Nebraska · Insured share: 93.3% · Uninsured share: 6.7% · Male insured share: 93.1% · Female insured share: 93.4% · With health insurance: 267,979 · No health insurance: 19,394 · Civilian noninstitutionalized population: 287,373 · Population: 291,932 · Insured margin of error: 1,829 · Uninsured margin of error: 1,161 · Coverage universe margin of error: 2,166 · Population margin of error: 71 · Males with health insurance: 133,456 · Females with health insurance: 134,523 · Male civilian noninstitutionalized population: 143,375 · Female civilian noninstitutionalized population: 143,998Meridian, Idaho · Insured share: 93.4% · Uninsured share: 6.6% · Male insured share: 92.3% · Female insured share: 94.4% · With health insurance: 115,939 · No health insurance: 8,249 · Civilian noninstitutionalized population: 124,188 · Population: 124,865 · Insured margin of error: 2,850 · Uninsured margin of error: 985 · Coverage universe margin of error: 3,015 · Population margin of error: 75 · Males with health insurance: 56,978 · Females with health insurance: 58,961 · Male civilian noninstitutionalized population: 61,703 · Female civilian noninstitutionalized population: 62,485Frisco, Texas · Insured share: 93.4% · Uninsured share: 6.6% · Male insured share: 93.2% · Female insured share: 93.6% · With health insurance: 195,829 · No health insurance: 13,896 · Civilian noninstitutionalized population: 209,725 · Population: 210,238 · Insured margin of error: 3,427 · Uninsured margin of error: 1,134 · Coverage universe margin of error: 3,610 · Population margin of error: 162 · Males with health insurance: 97,375 · Females with health insurance: 98,454 · Male civilian noninstitutionalized population: 104,517 · Female civilian noninstitutionalized population: 105,208Chesapeake, Virginia · Insured share: 93.4% · Uninsured share: 6.6% · Male insured share: 92.7% · Female insured share: 94.0% · With health insurance: 223,319 · No health insurance: 15,854 · Civilian noninstitutionalized population: 239,173 · Population: 251,153 · Insured margin of error: 1,599 · Uninsured margin of error: 1,216 · Coverage universe margin of error: 2,008 · Males with health insurance: 105,536 · Females with health insurance: 117,783 · Male civilian noninstitutionalized population: 113,899 · Female civilian noninstitutionalized population: 125,274Chico, California · Insured share: 93.5% · Uninsured share: 6.5% · Male insured share: 92.4% · Female insured share: 94.6% · With health insurance: 94,711 · No health insurance: 6,560 · Civilian noninstitutionalized population: 101,271 · Population: 102,032 · Insured margin of error: 1,821 · Uninsured margin of error: 776 · Coverage universe margin of error: 1,980 · Population margin of error: 57 · Males with health insurance: 45,474 · Females with health insurance: 49,237 · Male civilian noninstitutionalized population: 49,230 · Female civilian noninstitutionalized population: 52,041El Cajon, California · Insured share: 93.5% · Uninsured share: 6.5% · Male insured share: 93.1% · Female insured share: 93.9% · With health insurance: 96,198 · No health insurance: 6,715 · Civilian noninstitutionalized population: 102,913 · Population: 104,909 · Insured margin of error: 2,637 · Uninsured margin of error: 799 · Coverage universe margin of error: 2,755 · Population margin of error: 94 · Males with health insurance: 47,018 · Females with health insurance: 49,180 · Male civilian noninstitutionalized population: 50,523 · Female civilian noninstitutionalized population: 52,390Fresno, California · Insured share: 93.5% · Uninsured share: 6.5% · Male insured share: 92.2% · Female insured share: 94.8% · With health insurance: 503,128 · No health insurance: 34,924 · Civilian noninstitutionalized population: 538,052 · Population: 543,615 · Insured margin of error: 4,301 · Uninsured margin of error: 1,748 · Coverage universe margin of error: 4,643 · Population margin of error: 107 · Males with health insurance: 245,721 · Females with health insurance: 257,407 · Male civilian noninstitutionalized population: 266,643 · Female civilian noninstitutionalized population: 271,409Yonkers, New York · Insured share: 93.5% · Uninsured share: 6.5% · Male insured share: 92.5% · Female insured share: 94.5% · With health insurance: 195,152 · No health insurance: 13,551 · Civilian noninstitutionalized population: 208,703 · Population: 209,529 · Insured margin of error: 3,627 · Uninsured margin of error: 1,282 · Coverage universe margin of error: 3,847 · Population margin of error: 81 · Males with health insurance: 92,972 · Females with health insurance: 102,180 · Male civilian noninstitutionalized population: 100,554 · Female civilian noninstitutionalized population: 108,149Virginia Beach, Virginia · Insured share: 93.5% · Uninsured share: 6.5% · Male insured share: 92.6% · Female insured share: 94.4% · With health insurance: 404,486 · No health insurance: 27,930 · Civilian noninstitutionalized population: 432,416 · Population: 457,066 · Insured margin of error: 2,186 · Uninsured margin of error: 1,514 · Coverage universe margin of error: 2,660 · Males with health insurance: 189,519 · Females with health insurance: 214,967 · Male civilian noninstitutionalized population: 204,665 · Female civilian noninstitutionalized population: 227,751Spokane Valley, Washington · Insured share: 93.5% · Uninsured share: 6.5% · Male insured share: 92.3% · Female insured share: 94.8% · With health insurance: 97,881 · No health insurance: 6,755 · Civilian noninstitutionalized population: 104,636 · Population: 105,460 · Insured margin of error: 2,361 · Uninsured margin of error: 742 · Coverage universe margin of error: 2,474 · Population margin of error: 71 · Males with health insurance: 47,960 · Females with health insurance: 49,921 · Male civilian noninstitutionalized population: 51,975 · Female civilian noninstitutionalized population: 52,661Surprise, Arizona · Insured share: 93.6% · Uninsured share: 6.4% · Male insured share: 93.4% · Female insured share: 93.7% · With health insurance: 138,611 · No health insurance: 9,544 · Civilian noninstitutionalized population: 148,155 · Population: 149,519 · Insured margin of error: 3,116 · Uninsured margin of error: 1,324 · Coverage universe margin of error: 3,385 · Population margin of error: 64 · Males with health insurance: 65,364 · Females with health insurance: 73,247 · Male civilian noninstitutionalized population: 70,007 · Female civilian noninstitutionalized population: 78,148Santa Rosa, California · Insured share: 93.6% · Uninsured share: 6.4% · Male insured share: 92.0% · Female insured share: 95.0% · With health insurance: 164,170 · No health insurance: 11,300 · Civilian noninstitutionalized population: 175,470 · Population: 177,216 · Insured margin of error: 2,659 · Uninsured margin of error: 943 · Coverage universe margin of error: 2,821 · Population margin of error: 54 · Males with health insurance: 78,090 · Females with health insurance: 86,080 · Male civilian noninstitutionalized population: 84,906 · Female civilian noninstitutionalized population: 90,564Vallejo, California · Insured share: 93.6% · Uninsured share: 6.4% · Male insured share: 92.2% · Female insured share: 95.1% · With health insurance: 115,945 · No health insurance: 7,862 · Civilian noninstitutionalized population: 123,807 · Population: 124,637 · Insured margin of error: 2,220 · Uninsured margin of error: 819 · Coverage universe margin of error: 2,366 · Population margin of error: 70 · Males with health insurance: 55,815 · Females with health insurance: 60,130 · Male civilian noninstitutionalized population: 60,555 · Female civilian noninstitutionalized population: 63,252St. Paul, Minnesota · Insured share: 93.6% · Uninsured share: 6.4% · Male insured share: 92.4% · Female insured share: 94.7% · With health insurance: 285,589 · No health insurance: 19,604 · Civilian noninstitutionalized population: 305,193 · Population: 307,762 · Insured margin of error: 2,958 · Uninsured margin of error: 1,222 · Coverage universe margin of error: 3,200 · Population margin of error: 48 · Males with health insurance: 139,005 · Females with health insurance: 146,584 · Male civilian noninstitutionalized population: 150,444 · Female civilian noninstitutionalized population: 154,749Columbia, Missouri · Insured share: 93.6% · Uninsured share: 6.4% · Male insured share: 92.2% · Female insured share: 94.9% · With health insurance: 117,966 · No health insurance: 8,065 · Civilian noninstitutionalized population: 126,031 · Population: 127,200 · Insured margin of error: 1,923 · Uninsured margin of error: 798 · Coverage universe margin of error: 2,082 · Population margin of error: 64 · Males with health insurance: 55,760 · Females with health insurance: 62,206 · Male civilian noninstitutionalized population: 60,503 · Female civilian noninstitutionalized population: 65,528New York, New York · Insured share: 93.6% · Uninsured share: 6.4% · Male insured share: 92.2% · Female insured share: 94.9% · With health insurance: 7,916,800 · No health insurance: 543,446 · Civilian noninstitutionalized population: 8,460,246 · Population: 8,516,202 · Insured margin of error: 10,193 · Uninsured margin of error: 7,239 · Coverage universe margin of error: 12,502 · Males with health insurance: 3,739,130 · Females with health insurance: 4,177,670 · Male civilian noninstitutionalized population: 4,055,905 · Female civilian noninstitutionalized population: 4,404,341Toledo, Ohio · Insured share: 93.6% · Uninsured share: 6.4% · Male insured share: 92.1% · Female insured share: 95.0% · With health insurance: 248,812 · No health insurance: 17,018 · Civilian noninstitutionalized population: 265,830 · Population: 268,461 · Insured margin of error: 2,630 · Uninsured margin of error: 1,102 · Coverage universe margin of error: 2,852 · Population margin of error: 64 · Males with health insurance: 118,943 · Females with health insurance: 129,869 · Male civilian noninstitutionalized population: 129,118 · Female civilian noninstitutionalized population: 136,712Charleston, South Carolina · Insured share: 93.6% · Uninsured share: 6.4% · Male insured share: 92.1% · Female insured share: 94.9% · With health insurance: 140,315 · No health insurance: 9,661 · Civilian noninstitutionalized population: 149,976 · Population: 152,014 · Insured margin of error: 2,931 · Uninsured margin of error: 972 · Coverage universe margin of error: 3,088 · Population margin of error: 77 · Males with health insurance: 65,294 · Females with health insurance: 75,021 · Male civilian noninstitutionalized population: 70,903 · Female civilian noninstitutionalized population: 79,073Pasadena, California · Insured share: 93.7% · Uninsured share: 6.3% · Male insured share: 92.6% · Female insured share: 94.7% · With health insurance: 126,695 · No health insurance: 8,573 · Civilian noninstitutionalized population: 135,268 · Population: 136,462 · Insured margin of error: 2,583 · Uninsured margin of error: 801 · Coverage universe margin of error: 2,705 · Population margin of error: 63 · Males with health insurance: 61,821 · Females with health insurance: 64,874 · Male civilian noninstitutionalized population: 66,764 · Female civilian noninstitutionalized population: 68,504San Diego, California · Insured share: 93.7% · Uninsured share: 6.3% · Male insured share: 93.0% · Female insured share: 94.4% · With health insurance: 1,253,622 · No health insurance: 83,863 · Civilian noninstitutionalized population: 1,337,485 · Population: 1,385,061 · Insured margin of error: 7,390 · Uninsured margin of error: 2,862 · Coverage universe margin of error: 7,925 · Population margin of error: 147 · Males with health insurance: 618,734 · Females with health insurance: 634,888 · Male civilian noninstitutionalized population: 665,219 · Female civilian noninstitutionalized population: 672,266Pueblo, Colorado · Insured share: 93.7% · Uninsured share: 6.3% · Male insured share: 92.7% · Female insured share: 94.7% · With health insurance: 100,925 · No health insurance: 6,777 · Civilian noninstitutionalized population: 107,702 · Population: 111,514 · Insured margin of error: 1,631 · Uninsured margin of error: 650 · Coverage universe margin of error: 1,756 · Population margin of error: 51 · Males with health insurance: 49,458 · Females with health insurance: 51,467 · Male civilian noninstitutionalized population: 53,357 · Female civilian noninstitutionalized population: 54,345Warren, Michigan · Insured share: 93.7% · Uninsured share: 6.3% · Male insured share: 92.4% · Female insured share: 95.0% · With health insurance: 128,464 · No health insurance: 8,625 · Civilian noninstitutionalized population: 137,089 · Population: 138,128 · Insured margin of error: 2,504 · Uninsured margin of error: 815 · Coverage universe margin of error: 2,633 · Population margin of error: 56 · Males with health insurance: 62,157 · Females with health insurance: 66,307 · Male civilian noninstitutionalized population: 67,292 · Female civilian noninstitutionalized population: 69,797Hillsboro, Oregon · Insured share: 93.7% · Uninsured share: 6.3% · Male insured share: 92.8% · Female insured share: 94.7% · With health insurance: 99,472 · No health insurance: 6,662 · Civilian noninstitutionalized population: 106,134 · Population: 107,050 · Insured margin of error: 2,448 · Uninsured margin of error: 823 · Coverage universe margin of error: 2,582 · Population margin of error: 43 · Males with health insurance: 49,827 · Females with health insurance: 49,645 · Male civilian noninstitutionalized population: 53,699 · Female civilian noninstitutionalized population: 52,435Orange, California · Insured share: 93.8% · Uninsured share: 6.2% · Male insured share: 92.8% · Female insured share: 94.9% · With health insurance: 127,137 · No health insurance: 8,391 · Civilian noninstitutionalized population: 135,528 · Population: 138,723 · Insured margin of error: 2,793 · Uninsured margin of error: 726 · Coverage universe margin of error: 2,885 · Population margin of error: 68 · Males with health insurance: 62,630 · Females with health insurance: 64,507 · Male civilian noninstitutionalized population: 67,522 · Female civilian noninstitutionalized population: 68,006Lansing, Michigan · Insured share: 93.8% · Uninsured share: 6.2% · Male insured share: 91.9% · Female insured share: 95.6% · With health insurance: 105,381 · No health insurance: 6,966 · Civilian noninstitutionalized population: 112,347 · Population: 112,546 · Insured margin of error: 1,984 · Uninsured margin of error: 731 · Coverage universe margin of error: 2,114 · Population margin of error: 66 · Males with health insurance: 51,000 · Females with health insurance: 54,381 · Male civilian noninstitutionalized population: 55,471 · Female civilian noninstitutionalized population: 56,876Fargo, North Dakota · Insured share: 93.9% · Uninsured share: 6.1% · Male insured share: 92.7% · Female insured share: 95.1% · With health insurance: 119,649 · No health insurance: 7,800 · Civilian noninstitutionalized population: 127,449 · Population: 129,064 · Insured margin of error: 1,975 · Uninsured margin of error: 840 · Coverage universe margin of error: 2,146 · Population margin of error: 49 · Males with health insurance: 59,496 · Females with health insurance: 60,153 · Male civilian noninstitutionalized population: 64,203 · Female civilian noninstitutionalized population: 63,246Gilbert, Arizona · Insured share: 94.1% · Uninsured share: 5.9% · Male insured share: 93.6% · Female insured share: 94.5% · With health insurance: 254,742 · No health insurance: 16,076 · Civilian noninstitutionalized population: 270,818 · Population: 271,118 · Insured margin of error: 3,600 · Uninsured margin of error: 1,203 · Coverage universe margin of error: 3,796 · Population margin of error: 101 · Males with health insurance: 125,811 · Females with health insurance: 128,931 · Male civilian noninstitutionalized population: 134,381 · Female civilian noninstitutionalized population: 136,437Fairfield, California · Insured share: 94.1% · Uninsured share: 5.9% · Male insured share: 93.3% · Female insured share: 94.9% · With health insurance: 110,249 · No health insurance: 6,872 · Civilian noninstitutionalized population: 117,121 · Population: 119,985 · Insured margin of error: 2,251 · Uninsured margin of error: 812 · Coverage universe margin of error: 2,393 · Population margin of error: 50 · Males with health insurance: 53,320 · Females with health insurance: 56,929 · Male civilian noninstitutionalized population: 57,132 · Female civilian noninstitutionalized population: 59,989Oakland, California · Insured share: 94.1% · Uninsured share: 5.9% · Male insured share: 93.1% · Female insured share: 95.1% · With health insurance: 410,120 · No health insurance: 25,773 · Civilian noninstitutionalized population: 435,893 · Population: 438,072 · Insured margin of error: 4,116 · Uninsured margin of error: 1,334 · Coverage universe margin of error: 4,327 · Population margin of error: 58 · Males with health insurance: 200,566 · Females with health insurance: 209,554 · Male civilian noninstitutionalized population: 215,497 · Female civilian noninstitutionalized population: 220,396Temecula, California · Insured share: 94.1% · Uninsured share: 5.9% · Male insured share: 93.7% · Female insured share: 94.4% · With health insurance: 102,516 · No health insurance: 6,461 · Civilian noninstitutionalized population: 108,977 · Population: 110,404 · Insured margin of error: 2,650 · Uninsured margin of error: 775 · Coverage universe margin of error: 2,761 · Population margin of error: 64 · Males with health insurance: 49,858 · Females with health insurance: 52,658 · Male civilian noninstitutionalized population: 53,199 · Female civilian noninstitutionalized population: 55,778Visalia, California · Insured share: 94.1% · Uninsured share: 5.9% · Male insured share: 93.1% · Female insured share: 95.2% · With health insurance: 133,430 · No health insurance: 8,298 · Civilian noninstitutionalized population: 141,728 · Population: 142,649 · Insured margin of error: 2,714 · Uninsured margin of error: 1,116 · Coverage universe margin of error: 2,934 · Population margin of error: 1,065 · Males with health insurance: 64,806 · Females with health insurance: 68,624 · Male civilian noninstitutionalized population: 69,633 · Female civilian noninstitutionalized population: 72,095Minneapolis, Minnesota · Insured share: 94.1% · Uninsured share: 5.9% · Male insured share: 93.4% · Female insured share: 94.8% · With health insurance: 397,821 · No health insurance: 24,917 · Civilian noninstitutionalized population: 422,738 · Population: 426,845 · Insured margin of error: 3,994 · Uninsured margin of error: 1,395 · Coverage universe margin of error: 4,231 · Population margin of error: 69 · Males with health insurance: 202,024 · Females with health insurance: 195,797 · Male civilian noninstitutionalized population: 216,284 · Female civilian noninstitutionalized population: 206,454Concord, California · Insured share: 94.2% · Uninsured share: 5.8% · Male insured share: 93.4% · Female insured share: 95.1% · With health insurance: 116,402 · No health insurance: 7,107 · Civilian noninstitutionalized population: 123,509 · Population: 124,260 · Insured margin of error: 2,736 · Uninsured margin of error: 801 · Coverage universe margin of error: 2,851 · Population margin of error: 42 · Males with health insurance: 57,831 · Females with health insurance: 58,571 · Male civilian noninstitutionalized population: 61,942 · Female civilian noninstitutionalized population: 61,567West Covina, California · Insured share: 94.2% · Uninsured share: 5.8% · Male insured share: 92.9% · Female insured share: 95.3% · With health insurance: 100,758 · No health insurance: 6,214 · Civilian noninstitutionalized population: 106,972 · Population: 107,436 · Insured margin of error: 2,283 · Uninsured margin of error: 665 · Coverage universe margin of error: 2,378 · Population margin of error: 76 · Males with health insurance: 47,800 · Females with health insurance: 52,958 · Male civilian noninstitutionalized population: 51,429 · Female civilian noninstitutionalized population: 55,543Louisville/Jefferson County metro government (balance), Kentucky · Insured share: 94.2% · Uninsured share: 5.8% · Male insured share: 93.0% · Female insured share: 95.2% · With health insurance: 584,008 · No health insurance: 36,243 · Civilian noninstitutionalized population: 620,251 · Population: 627,210 · Insured margin of error: 3,535 · Uninsured margin of error: 1,824 · Coverage universe margin of error: 3,978 · Population margin of error: 145 · Males with health insurance: 280,442 · Females with health insurance: 303,566 · Male civilian noninstitutionalized population: 301,429 · Female civilian noninstitutionalized population: 318,822Baltimore, Maryland · Insured share: 94.2% · Uninsured share: 5.8% · Male insured share: 92.8% · Female insured share: 95.4% · With health insurance: 536,729 · No health insurance: 32,918 · Civilian noninstitutionalized population: 569,647 · Population: 577,193 · Insured margin of error: 2,497 · Uninsured margin of error: 1,627 · Coverage universe margin of error: 2,980 · Males with health insurance: 244,890 · Females with health insurance: 291,839 · Male civilian noninstitutionalized population: 263,761 · Female civilian noninstitutionalized population: 305,886Sterling Heights, Michigan · Insured share: 94.2% · Uninsured share: 5.8% · Male insured share: 93.6% · Female insured share: 94.7% · With health insurance: 125,031 · No health insurance: 7,763 · Civilian noninstitutionalized population: 132,794 · Population: 133,473 · Insured margin of error: 2,498 · Uninsured margin of error: 786 · Coverage universe margin of error: 2,619 · Population margin of error: 73 · Males with health insurance: 60,756 · Females with health insurance: 64,275 · Male civilian noninstitutionalized population: 64,903 · Female civilian noninstitutionalized population: 67,891Hayward, California · Insured share: 94.3% · Uninsured share: 5.7% · Male insured share: 93.1% · Female insured share: 95.4% · With health insurance: 148,997 · No health insurance: 9,082 · Civilian noninstitutionalized population: 158,079 · Population: 159,201 · Insured margin of error: 2,734 · Uninsured margin of error: 820 · Coverage universe margin of error: 2,854 · Population margin of error: 69 · Males with health insurance: 74,165 · Females with health insurance: 74,832 · Male civilian noninstitutionalized population: 79,623 · Female civilian noninstitutionalized population: 78,456San Buenaventura (Ventura), California · Insured share: 94.3% · Uninsured share: 5.7% · Male insured share: 93.3% · Female insured share: 95.3% · With health insurance: 102,327 · No health insurance: 6,164 · Civilian noninstitutionalized population: 108,491 · Population: 109,900 · Insured margin of error: 2,385 · Uninsured margin of error: 673 · Coverage universe margin of error: 2,478 · Population margin of error: 62 · Males with health insurance: 50,288 · Females with health insurance: 52,039 · Male civilian noninstitutionalized population: 53,895 · Female civilian noninstitutionalized population: 54,596Fort Collins, Colorado · Insured share: 94.4% · Uninsured share: 5.6% · Male insured share: 93.8% · Female insured share: 95.0% · With health insurance: 158,451 · No health insurance: 9,455 · Civilian noninstitutionalized population: 167,906 · Population: 169,705 · Insured margin of error: 2,519 · Uninsured margin of error: 862 · Coverage universe margin of error: 2,662 · Population margin of error: 63 · Males with health insurance: 78,247 · Females with health insurance: 80,204 · Male civilian noninstitutionalized population: 83,451 · Female civilian noninstitutionalized population: 84,455Sacramento, California · Insured share: 94.5% · Uninsured share: 5.5% · Male insured share: 93.5% · Female insured share: 95.5% · With health insurance: 491,895 · No health insurance: 28,733 · Civilian noninstitutionalized population: 520,628 · Population: 524,802 · Insured margin of error: 4,753 · Uninsured margin of error: 1,538 · Coverage universe margin of error: 4,996 · Population margin of error: 252 · Males with health insurance: 240,521 · Females with health insurance: 251,374 · Male civilian noninstitutionalized population: 257,362 · Female civilian noninstitutionalized population: 263,266Eugene, Oregon · Insured share: 94.5% · Uninsured share: 5.5% · Male insured share: 93.6% · Female insured share: 95.4% · With health insurance: 166,629 · No health insurance: 9,727 · Civilian noninstitutionalized population: 176,356 · Population: 177,520 · Insured margin of error: 2,468 · Uninsured margin of error: 937 · Coverage universe margin of error: 2,640 · Population margin of error: 70 · Males with health insurance: 80,770 · Females with health insurance: 85,859 · Male civilian noninstitutionalized population: 86,316 · Female civilian noninstitutionalized population: 90,040Portland, Oregon · Insured share: 94.5% · Uninsured share: 5.5% · Male insured share: 93.5% · Female insured share: 95.5% · With health insurance: 602,909 · No health insurance: 35,060 · Civilian noninstitutionalized population: 637,969 · Population: 642,715 · Insured margin of error: 3,626 · Uninsured margin of error: 1,525 · Coverage universe margin of error: 3,934 · Population margin of error: 699 · Males with health insurance: 296,108 · Females with health insurance: 306,801 · Male civilian noninstitutionalized population: 316,758 · Female civilian noninstitutionalized population: 321,211Modesto, California · Insured share: 94.6% · Uninsured share: 5.4% · Male insured share: 93.4% · Female insured share: 95.8% · With health insurance: 205,552 · No health insurance: 11,737 · Civilian noninstitutionalized population: 217,289 · Population: 218,614 · Insured margin of error: 2,970 · Uninsured margin of error: 908 · Coverage universe margin of error: 3,105 · Population margin of error: 91 · Males with health insurance: 100,359 · Females with health insurance: 105,193 · Male civilian noninstitutionalized population: 107,442 · Female civilian noninstitutionalized population: 109,847Simi Valley, California · Insured share: 94.6% · Uninsured share: 5.4% · Male insured share: 93.4% · Female insured share: 95.7% · With health insurance: 118,662 · No health insurance: 6,773 · Civilian noninstitutionalized population: 125,435 · Population: 125,769 · Insured margin of error: 2,348 · Uninsured margin of error: 731 · Coverage universe margin of error: 2,459 · Population margin of error: 77 · Males with health insurance: 57,742 · Females with health insurance: 60,920 · Male civilian noninstitutionalized population: 61,809 · Female civilian noninstitutionalized population: 63,626Cary, North Carolina · Insured share: 94.6% · Uninsured share: 5.4% · Male insured share: 93.9% · Female insured share: 95.2% · With health insurance: 166,828 · No health insurance: 9,527 · Civilian noninstitutionalized population: 176,355 · Population: 176,686 · Insured margin of error: 3,153 · Uninsured margin of error: 966 · Coverage universe margin of error: 3,297 · Population margin of error: 139 · Males with health insurance: 81,919 · Females with health insurance: 84,909 · Male civilian noninstitutionalized population: 87,195 · Female civilian noninstitutionalized population: 89,160Daly City, California · Insured share: 94.7% · Uninsured share: 5.3% · Male insured share: 93.8% · Female insured share: 95.5% · With health insurance: 96,426 · No health insurance: 5,447 · Civilian noninstitutionalized population: 101,873 · Population: 102,560 · Insured margin of error: 2,244 · Uninsured margin of error: 752 · Coverage universe margin of error: 2,366 · Population margin of error: 52 · Males with health insurance: 47,720 · Females with health insurance: 48,706 · Male civilian noninstitutionalized population: 50,885 · Female civilian noninstitutionalized population: 50,988Huntington Beach, California · Insured share: 94.7% · Uninsured share: 5.3% · Male insured share: 94.1% · Female insured share: 95.2% · With health insurance: 185,070 · No health insurance: 10,458 · Civilian noninstitutionalized population: 195,528 · Population: 196,010 · Insured margin of error: 3,399 · Uninsured margin of error: 1,089 · Coverage universe margin of error: 3,569 · Population margin of error: 78 · Males with health insurance: 91,492 · Females with health insurance: 93,578 · Male civilian noninstitutionalized population: 97,205 · Female civilian noninstitutionalized population: 98,323Murrieta, California · Insured share: 94.7% · Uninsured share: 5.3% · Male insured share: 94.2% · Female insured share: 95.1% · With health insurance: 104,707 · No health insurance: 5,888 · Civilian noninstitutionalized population: 110,595 · Population: 111,621 · Insured margin of error: 2,842 · Uninsured margin of error: 795 · Coverage universe margin of error: 2,951 · Population margin of error: 63 · Males with health insurance: 49,976 · Females with health insurance: 54,731 · Male civilian noninstitutionalized population: 53,049 · Female civilian noninstitutionalized population: 57,546Lee's Summit, Missouri · Insured share: 94.7% · Uninsured share: 5.3% · Male insured share: 93.4% · Female insured share: 96.0% · With health insurance: 96,386 · No health insurance: 5,342 · Civilian noninstitutionalized population: 101,728 · Population: 102,583 · Insured margin of error: 2,272 · Uninsured margin of error: 684 · Coverage universe margin of error: 2,372 · Population margin of error: 51 · Males with health insurance: 46,263 · Females with health insurance: 50,123 · Male civilian noninstitutionalized population: 49,513 · Female civilian noninstitutionalized population: 52,215Arlington, Virginia · Insured share: 94.7% · Uninsured share: 5.3% · Male insured share: 94.5% · Female insured share: 95.0% · With health insurance: 218,740 · No health insurance: 12,180 · Civilian noninstitutionalized population: 230,920 · Population: 235,463 · Insured margin of error: 1,460 · Uninsured margin of error: 967 · Coverage universe margin of error: 1,751 · Males with health insurance: 108,818 · Females with health insurance: 109,922 · Male civilian noninstitutionalized population: 115,205 · Female civilian noninstitutionalized population: 115,715Pittsburgh, Pennsylvania · Insured share: 94.8% · Uninsured share: 5.2% · Male insured share: 94.1% · Female insured share: 95.4% · With health insurance: 283,620 · No health insurance: 15,602 · Civilian noninstitutionalized population: 299,222 · Population: 303,620 · Insured margin of error: 3,552 · Uninsured margin of error: 1,187 · Coverage universe margin of error: 3,746 · Population margin of error: 57 · Males with health insurance: 137,675 · Females with health insurance: 145,945 · Male civilian noninstitutionalized population: 146,239 · Female civilian noninstitutionalized population: 152,983Spokane, Washington · Insured share: 94.8% · Uninsured share: 5.2% · Male insured share: 93.7% · Female insured share: 96.0% · With health insurance: 214,539 · No health insurance: 11,710 · Civilian noninstitutionalized population: 226,249 · Population: 229,228 · Insured margin of error: 3,015 · Uninsured margin of error: 915 · Coverage universe margin of error: 3,151 · Population margin of error: 74 · Males with health insurance: 104,983 · Females with health insurance: 109,556 · Male civilian noninstitutionalized population: 112,070 · Female civilian noninstitutionalized population: 114,179Menifee, California · Insured share: 94.9% · Uninsured share: 5.1% · Male insured share: 94.8% · Female insured share: 94.9% · With health insurance: 100,891 · No health insurance: 5,425 · Civilian noninstitutionalized population: 106,316 · Population: 107,020 · Insured margin of error: 2,772 · Uninsured margin of error: 691 · Coverage universe margin of error: 2,857 · Population margin of error: 63 · Males with health insurance: 49,379 · Females with health insurance: 51,512 · Male civilian noninstitutionalized population: 52,062 · Female civilian noninstitutionalized population: 54,254Rancho Cucamonga, California · Insured share: 94.9% · Uninsured share: 5.1% · Male insured share: 94.7% · Female insured share: 95.0% · With health insurance: 163,008 · No health insurance: 8,833 · Civilian noninstitutionalized population: 171,841 · Population: 174,693 · Insured margin of error: 3,105 · Uninsured margin of error: 912 · Coverage universe margin of error: 3,237 · Population margin of error: 83 · Males with health insurance: 79,991 · Females with health insurance: 83,017 · Male civilian noninstitutionalized population: 84,500 · Female civilian noninstitutionalized population: 87,341Overland Park, Kansas · Insured share: 95.0% · Uninsured share: 5.0% · Male insured share: 94.3% · Female insured share: 95.8% · With health insurance: 186,151 · No health insurance: 9,706 · Civilian noninstitutionalized population: 195,857 · Population: 197,199 · Insured margin of error: 2,688 · Uninsured margin of error: 842 · Coverage universe margin of error: 2,816 · Population margin of error: 94 · Males with health insurance: 91,320 · Females with health insurance: 94,831 · Male civilian noninstitutionalized population: 96,845 · Female civilian noninstitutionalized population: 99,012San Jose, California · Insured share: 95.1% · Uninsured share: 4.9% · Male insured share: 94.4% · Female insured share: 95.8% · With health insurance: 937,870 · No health insurance: 48,342 · Civilian noninstitutionalized population: 986,212 · Population: 990,054 · Insured margin of error: 5,269 · Uninsured margin of error: 1,923 · Coverage universe margin of error: 5,609 · Population margin of error: 201 · Males with health insurance: 473,959 · Females with health insurance: 463,911 · Male civilian noninstitutionalized population: 501,971 · Female civilian noninstitutionalized population: 484,241New Bedford, Massachusetts · Insured share: 95.1% · Uninsured share: 4.9% · Male insured share: 93.8% · Female insured share: 96.5% · With health insurance: 94,776 · No health insurance: 4,845 · Civilian noninstitutionalized population: 99,621 · Population: 100,731 · Insured margin of error: 2,068 · Uninsured margin of error: 583 · Coverage universe margin of error: 2,149 · Population margin of error: 62 · Males with health insurance: 47,105 · Females with health insurance: 47,671 · Male civilian noninstitutionalized population: 50,245 · Female civilian noninstitutionalized population: 49,376Rochester, New York · Insured share: 95.1% · Uninsured share: 4.9% · Male insured share: 93.3% · Female insured share: 96.9% · With health insurance: 196,868 · No health insurance: 10,064 · Civilian noninstitutionalized population: 206,932 · Population: 209,720 · Insured margin of error: 2,765 · Uninsured margin of error: 906 · Coverage universe margin of error: 2,909 · Population margin of error: 114 · Males with health insurance: 92,912 · Females with health insurance: 103,956 · Male civilian noninstitutionalized population: 99,622 · Female civilian noninstitutionalized population: 107,310Syracuse, New York · Insured share: 95.1% · Uninsured share: 4.9% · Male insured share: 93.5% · Female insured share: 96.6% · With health insurance: 136,719 · No health insurance: 7,020 · Civilian noninstitutionalized population: 143,739 · Population: 146,211 · Insured margin of error: 2,393 · Uninsured margin of error: 748 · Coverage universe margin of error: 2,507 · Population margin of error: 65 · Males with health insurance: 64,795 · Females with health insurance: 71,924 · Male civilian noninstitutionalized population: 69,307 · Female civilian noninstitutionalized population: 74,432Santa Clarita, California · Insured share: 95.2% · Uninsured share: 4.8% · Male insured share: 94.5% · Female insured share: 96.0% · With health insurance: 217,784 · No health insurance: 10,945 · Civilian noninstitutionalized population: 228,729 · Population: 229,021 · Insured margin of error: 3,876 · Uninsured margin of error: 1,048 · Coverage universe margin of error: 4,015 · Population margin of error: 97 · Males with health insurance: 107,097 · Females with health insurance: 110,687 · Male civilian noninstitutionalized population: 113,376 · Female civilian noninstitutionalized population: 115,353Dearborn, Michigan · Insured share: 95.2% · Uninsured share: 4.8% · Male insured share: 94.3% · Female insured share: 96.0% · With health insurance: 102,396 · No health insurance: 5,217 · Civilian noninstitutionalized population: 107,613 · Population: 107,846 · Insured margin of error: 2,275 · Uninsured margin of error: 592 · Coverage universe margin of error: 2,351 · Population margin of error: 57 · Males with health insurance: 50,344 · Females with health insurance: 52,052 · Male civilian noninstitutionalized population: 53,374 · Female civilian noninstitutionalized population: 54,239Scottsdale, Arizona · Insured share: 95.3% · Uninsured share: 4.7% · Male insured share: 94.5% · Female insured share: 95.9% · With health insurance: 229,092 · No health insurance: 11,420 · Civilian noninstitutionalized population: 240,512 · Population: 242,169 · Insured margin of error: 4,066 · Uninsured margin of error: 1,079 · Coverage universe margin of error: 4,206 · Population margin of error: 118 · Males with health insurance: 110,222 · Females with health insurance: 118,870 · Male civilian noninstitutionalized population: 116,581 · Female civilian noninstitutionalized population: 123,931Thousand Oaks, California · Insured share: 95.3% · Uninsured share: 4.7% · Male insured share: 95.0% · Female insured share: 95.5% · With health insurance: 119,257 · No health insurance: 5,900 · Civilian noninstitutionalized population: 125,157 · Population: 125,676 · Insured margin of error: 2,385 · Uninsured margin of error: 701 · Coverage universe margin of error: 2,486 · Population margin of error: 60 · Males with health insurance: 59,175 · Females with health insurance: 60,082 · Male civilian noninstitutionalized population: 62,272 · Female civilian noninstitutionalized population: 62,885Arvada, Colorado · Insured share: 95.3% · Uninsured share: 4.7% · Male insured share: 94.7% · Female insured share: 95.9% · With health insurance: 116,579 · No health insurance: 5,757 · Civilian noninstitutionalized population: 122,336 · Population: 122,835 · Insured margin of error: 2,295 · Uninsured margin of error: 670 · Coverage universe margin of error: 2,391 · Population margin of error: 66 · Males with health insurance: 57,727 · Females with health insurance: 58,852 · Male civilian noninstitutionalized population: 60,971 · Female civilian noninstitutionalized population: 61,365Rio Rancho, New Mexico · Insured share: 95.3% · Uninsured share: 4.7% · Male insured share: 94.8% · Female insured share: 95.8% · With health insurance: 101,032 · No health insurance: 4,991 · Civilian noninstitutionalized population: 106,023 · Population: 106,533 · Insured margin of error: 1,453 · Uninsured margin of error: 666 · Coverage universe margin of error: 1,599 · Population margin of error: 72 · Males with health insurance: 49,780 · Females with health insurance: 51,252 · Male civilian noninstitutionalized population: 52,519 · Female civilian noninstitutionalized population: 53,504Albany, New York · Insured share: 95.3% · Uninsured share: 4.7% · Male insured share: 93.7% · Female insured share: 96.8% · With health insurance: 94,180 · No health insurance: 4,633 · Civilian noninstitutionalized population: 98,813 · Population: 100,081 · Insured margin of error: 2,150 · Uninsured margin of error: 651 · Coverage universe margin of error: 2,246 · Population margin of error: 48 · Males with health insurance: 44,158 · Females with health insurance: 50,022 · Male civilian noninstitutionalized population: 47,151 · Female civilian noninstitutionalized population: 51,662Columbia, Maryland · Insured share: 95.4% · Uninsured share: 4.6% · Male insured share: 94.8% · Female insured share: 95.9% · With health insurance: 100,003 · No health insurance: 4,847 · Civilian noninstitutionalized population: 104,850 · Population: 105,871 · Insured margin of error: 2,147 · Uninsured margin of error: 677 · Coverage universe margin of error: 2,251 · Population margin of error: 2,631 · Males with health insurance: 47,766 · Females with health insurance: 52,237 · Male civilian noninstitutionalized population: 50,406 · Female civilian noninstitutionalized population: 54,444Cedar Rapids, Iowa · Insured share: 95.5% · Uninsured share: 4.5% · Male insured share: 94.7% · Female insured share: 96.3% · With health insurance: 129,259 · No health insurance: 6,074 · Civilian noninstitutionalized population: 135,333 · Population: 136,859 · Insured margin of error: 1,922 · Uninsured margin of error: 760 · Coverage universe margin of error: 2,067 · Population margin of error: 60 · Males with health insurance: 63,186 · Females with health insurance: 66,073 · Male civilian noninstitutionalized population: 66,705 · Female civilian noninstitutionalized population: 68,628Brockton, Massachusetts · Insured share: 95.5% · Uninsured share: 4.5% · Male insured share: 94.7% · Female insured share: 96.2% · With health insurance: 99,336 · No health insurance: 4,707 · Civilian noninstitutionalized population: 104,043 · Population: 105,080 · Insured margin of error: 1,910 · Uninsured margin of error: 650 · Coverage universe margin of error: 2,018 · Population margin of error: 50 · Males with health insurance: 47,772 · Females with health insurance: 51,564 · Male civilian noninstitutionalized population: 50,419 · Female civilian noninstitutionalized population: 53,624Burbank, California · Insured share: 95.6% · Uninsured share: 4.4% · Male insured share: 94.9% · Female insured share: 96.3% · With health insurance: 100,178 · No health insurance: 4,627 · Civilian noninstitutionalized population: 104,805 · Population: 105,165 · Insured margin of error: 2,722 · Uninsured margin of error: 593 · Coverage universe margin of error: 2,786 · Population margin of error: 81 · Males with health insurance: 48,445 · Females with health insurance: 51,733 · Male civilian noninstitutionalized population: 51,061 · Female civilian noninstitutionalized population: 53,744Torrance, California · Insured share: 95.6% · Uninsured share: 4.4% · Male insured share: 94.7% · Female insured share: 96.5% · With health insurance: 136,186 · No health insurance: 6,226 · Civilian noninstitutionalized population: 142,412 · Population: 143,499 · Insured margin of error: 2,737 · Uninsured margin of error: 879 · Coverage universe margin of error: 2,875 · Population margin of error: 65 · Males with health insurance: 66,755 · Females with health insurance: 69,431 · Male civilian noninstitutionalized population: 70,482 · Female civilian noninstitutionalized population: 71,930Lynn, Massachusetts · Insured share: 95.6% · Uninsured share: 4.4% · Male insured share: 94.5% · Female insured share: 96.7% · With health insurance: 96,237 · No health insurance: 4,436 · Civilian noninstitutionalized population: 100,673 · Population: 100,905 · Insured margin of error: 2,382 · Uninsured margin of error: 601 · Coverage universe margin of error: 2,457 · Population margin of error: 83 · Males with health insurance: 47,654 · Females with health insurance: 48,583 · Male civilian noninstitutionalized population: 50,430 · Female civilian noninstitutionalized population: 50,243Bellevue, Washington · Insured share: 95.6% · Uninsured share: 4.4% · Male insured share: 95.3% · Female insured share: 96.0% · With health insurance: 144,119 · No health insurance: 6,636 · Civilian noninstitutionalized population: 150,755 · Population: 151,199 · Insured margin of error: 2,705 · Uninsured margin of error: 758 · Coverage universe margin of error: 2,810 · Population margin of error: 61 · Males with health insurance: 73,060 · Females with health insurance: 71,059 · Male civilian noninstitutionalized population: 76,703 · Female civilian noninstitutionalized population: 74,052Seattle, Washington · Insured share: 95.6% · Uninsured share: 4.4% · Male insured share: 94.8% · Female insured share: 96.5% · With health insurance: 703,515 · No health insurance: 32,117 · Civilian noninstitutionalized population: 735,632 · Population: 741,440 · Insured margin of error: 5,739 · Uninsured margin of error: 1,869 · Coverage universe margin of error: 6,036 · Population margin of error: 121 · Males with health insurance: 355,378 · Females with health insurance: 348,137 · Male civilian noninstitutionalized population: 374,719 · Female civilian noninstitutionalized population: 360,913Lancaster, California · Insured share: 95.7% · Uninsured share: 4.3% · Male insured share: 95.7% · Female insured share: 95.7% · With health insurance: 158,621 · No health insurance: 7,142 · Civilian noninstitutionalized population: 165,763 · Population: 170,013 · Insured margin of error: 3,596 · Uninsured margin of error: 713 · Coverage universe margin of error: 3,666 · Population margin of error: 62 · Males with health insurance: 76,777 · Females with health insurance: 81,844 · Male civilian noninstitutionalized population: 80,247 · Female civilian noninstitutionalized population: 85,516San Mateo, California · Insured share: 95.7% · Uninsured share: 4.3% · Male insured share: 94.8% · Female insured share: 96.5% · With health insurance: 98,822 · No health insurance: 4,482 · Civilian noninstitutionalized population: 103,304 · Population: 103,555 · Insured margin of error: 2,184 · Uninsured margin of error: 615 · Coverage universe margin of error: 2,269 · Population margin of error: 58 · Males with health insurance: 48,625 · Females with health insurance: 50,197 · Male civilian noninstitutionalized population: 51,276 · Female civilian noninstitutionalized population: 52,028Rochester, Minnesota · Insured share: 95.7% · Uninsured share: 4.3% · Male insured share: 95.8% · Female insured share: 95.6% · With health insurance: 114,722 · No health insurance: 5,149 · Civilian noninstitutionalized population: 119,871 · Population: 121,638 · Insured margin of error: 1,367 · Uninsured margin of error: 603 · Coverage universe margin of error: 1,494 · Population margin of error: 72 · Males with health insurance: 55,507 · Females with health insurance: 59,215 · Male civilian noninstitutionalized population: 57,913 · Female civilian noninstitutionalized population: 61,958Madison, Wisconsin · Insured share: 95.7% · Uninsured share: 4.3% · Male insured share: 94.9% · Female insured share: 96.5% · With health insurance: 262,217 · No health insurance: 11,798 · Civilian noninstitutionalized population: 274,015 · Population: 275,568 · Insured margin of error: 3,175 · Uninsured margin of error: 1,076 · Coverage universe margin of error: 3,352 · Population margin of error: 76 · Males with health insurance: 129,848 · Females with health insurance: 132,369 · Male civilian noninstitutionalized population: 136,777 · Female civilian noninstitutionalized population: 137,238Irvine, California · Insured share: 95.8% · Uninsured share: 4.2% · Male insured share: 95.6% · Female insured share: 96.1% · With health insurance: 294,964 · No health insurance: 12,809 · Civilian noninstitutionalized population: 307,773 · Population: 308,160 · Insured margin of error: 4,766 · Uninsured margin of error: 1,269 · Coverage universe margin of error: 4,932 · Population margin of error: 117 · Males with health insurance: 144,627 · Females with health insurance: 150,337 · Male civilian noninstitutionalized population: 151,254 · Female civilian noninstitutionalized population: 156,519Springfield, Illinois · Insured share: 95.8% · Uninsured share: 4.2% · Male insured share: 95.0% · Female insured share: 96.6% · With health insurance: 107,496 · No health insurance: 4,682 · Civilian noninstitutionalized population: 112,178 · Population: 113,714 · Insured margin of error: 1,586 · Uninsured margin of error: 553 · Coverage universe margin of error: 1,680 · Population margin of error: 376 · Males with health insurance: 51,256 · Females with health insurance: 56,240 · Male civilian noninstitutionalized population: 53,982 · Female civilian noninstitutionalized population: 58,196Carlsbad, California · Insured share: 95.9% · Uninsured share: 4.1% · Male insured share: 95.8% · Female insured share: 96.0% · With health insurance: 108,474 · No health insurance: 4,662 · Civilian noninstitutionalized population: 113,136 · Population: 114,500 · Insured margin of error: 2,614 · Uninsured margin of error: 739 · Coverage universe margin of error: 2,716 · Population margin of error: 85 · Males with health insurance: 53,178 · Females with health insurance: 55,296 · Male civilian noninstitutionalized population: 55,524 · Female civilian noninstitutionalized population: 57,612Lowell, Massachusetts · Insured share: 96.0% · Uninsured share: 4.0% · Male insured share: 94.5% · Female insured share: 97.5% · With health insurance: 109,298 · No health insurance: 4,540 · Civilian noninstitutionalized population: 113,838 · Population: 114,799 · Insured margin of error: 2,522 · Uninsured margin of error: 638 · Coverage universe margin of error: 2,601 · Population margin of error: 46 · Males with health insurance: 53,301 · Females with health insurance: 55,997 · Male civilian noninstitutionalized population: 56,431 · Female civilian noninstitutionalized population: 57,407Worcester, Massachusetts · Insured share: 96.1% · Uninsured share: 3.9% · Male insured share: 95.5% · Female insured share: 96.8% · With health insurance: 195,523 · No health insurance: 7,830 · Civilian noninstitutionalized population: 203,353 · Population: 205,501 · Insured margin of error: 3,095 · Uninsured margin of error: 858 · Coverage universe margin of error: 3,212 · Population margin of error: 74 · Males with health insurance: 96,336 · Females with health insurance: 99,187 · Male civilian noninstitutionalized population: 100,849 · Female civilian noninstitutionalized population: 102,504Centennial, Colorado · Insured share: 96.2% · Uninsured share: 3.8% · Male insured share: 96.0% · Female insured share: 96.3% · With health insurance: 101,980 · No health insurance: 4,071 · Civilian noninstitutionalized population: 106,051 · Population: 107,386 · Insured margin of error: 1,884 · Uninsured margin of error: 538 · Coverage universe margin of error: 1,959 · Population margin of error: 70 · Males with health insurance: 50,771 · Females with health insurance: 51,209 · Male civilian noninstitutionalized population: 52,871 · Female civilian noninstitutionalized population: 53,180Urban Honolulu, Hawaii · Insured share: 96.2% · Uninsured share: 3.8% · Male insured share: 96.0% · Female insured share: 96.4% · With health insurance: 321,801 · No health insurance: 12,697 · Civilian noninstitutionalized population: 334,498 · Population: 346,323 · Insured margin of error: 3,294 · Uninsured margin of error: 873 · Coverage universe margin of error: 3,408 · Population margin of error: 116 · Males with health insurance: 157,417 · Females with health insurance: 164,384 · Male civilian noninstitutionalized population: 163,927 · Female civilian noninstitutionalized population: 170,571Buffalo, New York · Insured share: 96.3% · Uninsured share: 3.7% · Male insured share: 95.3% · Female insured share: 97.2% · With health insurance: 264,458 · No health insurance: 10,198 · Civilian noninstitutionalized population: 274,656 · Population: 276,397 · Insured margin of error: 3,449 · Uninsured margin of error: 937 · Coverage universe margin of error: 3,574 · Population margin of error: 65 · Males with health insurance: 125,018 · Females with health insurance: 139,440 · Male civilian noninstitutionalized population: 131,241 · Female civilian noninstitutionalized population: 143,415Clovis, California · Insured share: 96.4% · Uninsured share: 3.6% · Male insured share: 95.7% · Female insured share: 97.0% · With health insurance: 117,783 · No health insurance: 4,411 · Civilian noninstitutionalized population: 122,194 · Population: 122,719 · Insured margin of error: 2,482 · Uninsured margin of error: 591 · Coverage universe margin of error: 2,551 · Population margin of error: 69 · Males with health insurance: 56,812 · Females with health insurance: 60,971 · Male civilian noninstitutionalized population: 59,341 · Female civilian noninstitutionalized population: 62,853Springfield, Massachusetts · Insured share: 96.4% · Uninsured share: 3.6% · Male insured share: 94.9% · Female insured share: 97.8% · With health insurance: 148,508 · No health insurance: 5,556 · Civilian noninstitutionalized population: 154,064 · Population: 154,751 · Insured margin of error: 2,521 · Uninsured margin of error: 759 · Coverage universe margin of error: 2,633 · Population margin of error: 91 · Males with health insurance: 69,707 · Females with health insurance: 78,801 · Male civilian noninstitutionalized population: 73,460 · Female civilian noninstitutionalized population: 80,604San Francisco, California · Insured share: 96.5% · Uninsured share: 3.5% · Male insured share: 95.9% · Female insured share: 97.3% · With health insurance: 803,423 · No health insurance: 28,786 · Civilian noninstitutionalized population: 832,209 · Population: 836,321 · Insured margin of error: 2,453 · Uninsured margin of error: 1,596 · Coverage universe margin of error: 2,926 · Males with health insurance: 409,880 · Females with health insurance: 393,543 · Male civilian noninstitutionalized population: 427,622 · Female civilian noninstitutionalized population: 404,587Boulder, Colorado · Insured share: 96.5% · Uninsured share: 3.5% · Male insured share: 96.0% · Female insured share: 97.0% · With health insurance: 101,501 · No health insurance: 3,677 · Civilian noninstitutionalized population: 105,178 · Population: 106,274 · Insured margin of error: 2,002 · Uninsured margin of error: 511 · Coverage universe margin of error: 2,066 · Population margin of error: 49 · Males with health insurance: 52,218 · Females with health insurance: 49,283 · Male civilian noninstitutionalized population: 54,366 · Female civilian noninstitutionalized population: 50,812Fishers, Indiana · Insured share: 96.5% · Uninsured share: 3.5% · Male insured share: 97.0% · Female insured share: 96.0% · With health insurance: 96,588 · No health insurance: 3,505 · Civilian noninstitutionalized population: 100,093 · Population: 100,918 · Insured margin of error: 2,663 · Uninsured margin of error: 639 · Coverage universe margin of error: 2,739 · Population margin of error: 35 · Males with health insurance: 47,933 · Females with health insurance: 48,655 · Male civilian noninstitutionalized population: 49,428 · Female civilian noninstitutionalized population: 50,665Quincy, Massachusetts · Insured share: 96.5% · Uninsured share: 3.5% · Male insured share: 95.8% · Female insured share: 97.3% · With health insurance: 97,227 · No health insurance: 3,495 · Civilian noninstitutionalized population: 100,722 · Population: 101,361 · Insured margin of error: 2,390 · Uninsured margin of error: 581 · Coverage universe margin of error: 2,460 · Population margin of error: 35 · Males with health insurance: 48,388 · Females with health insurance: 48,839 · Male civilian noninstitutionalized population: 50,520 · Female civilian noninstitutionalized population: 50,202Washington, District of Columbia · Insured share: 96.6% · Uninsured share: 3.4% · Male insured share: 95.8% · Female insured share: 97.3% · With health insurance: 640,379 · No health insurance: 22,635 · Civilian noninstitutionalized population: 663,014 · Population: 672,079 · Insured margin of error: 2,692 · Uninsured margin of error: 1,652 · Coverage universe margin of error: 3,158 · Males with health insurance: 300,267 · Females with health insurance: 340,112 · Male civilian noninstitutionalized population: 313,453 · Female civilian noninstitutionalized population: 349,561Highlands Ranch, Colorado · Insured share: 96.7% · Uninsured share: 3.3% · Male insured share: 96.8% · Female insured share: 96.6% · With health insurance: 97,499 · No health insurance: 3,308 · Civilian noninstitutionalized population: 100,807 · Population: 101,437 · Insured margin of error: 1,882 · Uninsured margin of error: 509 · Coverage universe margin of error: 1,949 · Population margin of error: 2,176 · Males with health insurance: 49,112 · Females with health insurance: 48,387 · Male civilian noninstitutionalized population: 50,714 · Female civilian noninstitutionalized population: 50,093Carmel, Indiana · Insured share: 96.7% · Uninsured share: 3.3% · Male insured share: 96.5% · Female insured share: 97.0% · With health insurance: 96,787 · No health insurance: 3,252 · Civilian noninstitutionalized population: 100,039 · Population: 100,501 · Insured margin of error: 2,207 · Uninsured margin of error: 562 · Coverage universe margin of error: 2,278 · Population margin of error: 198 · Males with health insurance: 46,430 · Females with health insurance: 50,357 · Male civilian noninstitutionalized population: 48,100 · Female civilian noninstitutionalized population: 51,939Santa Clara, California · Insured share: 96.9% · Uninsured share: 3.1% · Male insured share: 96.8% · Female insured share: 97.0% · With health insurance: 124,617 · No health insurance: 3,995 · Civilian noninstitutionalized population: 128,612 · Population: 129,239 · Insured margin of error: 2,730 · Uninsured margin of error: 541 · Coverage universe margin of error: 2,783 · Population margin of error: 65 · Males with health insurance: 64,756 · Females with health insurance: 59,861 · Male civilian noninstitutionalized population: 66,889 · Female civilian noninstitutionalized population: 61,723Sunnyvale, California · Insured share: 96.9% · Uninsured share: 3.1% · Male insured share: 96.5% · Female insured share: 97.3% · With health insurance: 147,881 · No health insurance: 4,799 · Civilian noninstitutionalized population: 152,680 · Population: 153,455 · Insured margin of error: 2,757 · Uninsured margin of error: 653 · Coverage universe margin of error: 2,833 · Population margin of error: 92 · Males with health insurance: 76,810 · Females with health insurance: 71,071 · Male civilian noninstitutionalized population: 79,629 · Female civilian noninstitutionalized population: 73,051Vacaville, California · Insured share: 97.0% · Uninsured share: 3.0% · Male insured share: 96.6% · Female insured share: 97.3% · With health insurance: 91,490 · No health insurance: 2,868 · Civilian noninstitutionalized population: 94,358 · Population: 102,085 · Insured margin of error: 2,101 · Uninsured margin of error: 445 · Coverage universe margin of error: 2,147 · Population margin of error: 63 · Males with health insurance: 43,704 · Females with health insurance: 47,786 · Male civilian noninstitutionalized population: 45,245 · Female civilian noninstitutionalized population: 49,113Boston, Massachusetts · Insured share: 97.0% · Uninsured share: 3.0% · Male insured share: 96.2% · Female insured share: 97.6% · With health insurance: 639,662 · No health insurance: 20,114 · Civilian noninstitutionalized population: 659,776 · Population: 663,972 · Insured margin of error: 3,420 · Uninsured margin of error: 1,261 · Coverage universe margin of error: 3,645 · Population margin of error: 76 · Males with health insurance: 304,741 · Females with health insurance: 334,921 · Male civilian noninstitutionalized population: 316,772 · Female civilian noninstitutionalized population: 343,004Berkeley, California · Insured share: 97.1% · Uninsured share: 2.9% · Male insured share: 96.6% · Female insured share: 97.6% · With health insurance: 116,467 · No health insurance: 3,434 · Civilian noninstitutionalized population: 119,901 · Population: 120,223 · Insured margin of error: 2,485 · Uninsured margin of error: 519 · Coverage universe margin of error: 2,539 · Population margin of error: 50 · Males with health insurance: 56,106 · Females with health insurance: 60,361 · Male civilian noninstitutionalized population: 58,055 · Female civilian noninstitutionalized population: 61,846Elk Grove, California · Insured share: 97.2% · Uninsured share: 2.8% · Male insured share: 96.6% · Female insured share: 97.8% · With health insurance: 171,948 · No health insurance: 4,911 · Civilian noninstitutionalized population: 176,859 · Population: 177,221 · Insured margin of error: 3,026 · Uninsured margin of error: 593 · Coverage universe margin of error: 3,083 · Population margin of error: 134 · Males with health insurance: 83,545 · Females with health insurance: 88,403 · Male civilian noninstitutionalized population: 86,503 · Female civilian noninstitutionalized population: 90,356Roseville, California · Insured share: 97.2% · Uninsured share: 2.8% · Male insured share: 96.7% · Female insured share: 97.6% · With health insurance: 147,242 · No health insurance: 4,278 · Civilian noninstitutionalized population: 151,520 · Population: 152,438 · Insured margin of error: 2,390 · Uninsured margin of error: 539 · Coverage universe margin of error: 2,450 · Population margin of error: 80 · Males with health insurance: 71,874 · Females with health insurance: 75,368 · Male civilian noninstitutionalized population: 74,300 · Female civilian noninstitutionalized population: 77,220Ann Arbor, Michigan · Insured share: 97.2% · Uninsured share: 2.8% · Male insured share: 96.9% · Female insured share: 97.5% · With health insurance: 117,248 · No health insurance: 3,386 · Civilian noninstitutionalized population: 120,634 · Population: 121,179 · Insured margin of error: 2,135 · Uninsured margin of error: 457 · Coverage universe margin of error: 2,183 · Population margin of error: 50 · Males with health insurance: 58,248 · Females with health insurance: 59,000 · Male civilian noninstitutionalized population: 60,131 · Female civilian noninstitutionalized population: 60,503Fremont, California · Insured share: 97.3% · Uninsured share: 2.7% · Male insured share: 97.2% · Female insured share: 97.5% · With health insurance: 221,557 · No health insurance: 6,140 · Civilian noninstitutionalized population: 227,697 · Population: 228,518 · Insured margin of error: 3,009 · Uninsured margin of error: 705 · Coverage universe margin of error: 3,090 · Population margin of error: 57 · Males with health insurance: 110,654 · Females with health insurance: 110,903 · Male civilian noninstitutionalized population: 113,893 · Female civilian noninstitutionalized population: 113,804Naperville, Illinois · Insured share: 97.5% · Uninsured share: 2.5% · Male insured share: 97.0% · Female insured share: 97.9% · With health insurance: 144,389 · No health insurance: 3,742 · Civilian noninstitutionalized population: 148,131 · Population: 149,424 · Insured margin of error: 2,375 · Uninsured margin of error: 526 · Coverage universe margin of error: 2,433 · Population margin of error: 393 · Males with health insurance: 71,473 · Females with health insurance: 72,916 · Male civilian noninstitutionalized population: 73,660 · Female civilian noninstitutionalized population: 74,471Cambridge, Massachusetts · Insured share: 98.2% · Uninsured share: 1.8% · Male insured share: 97.9% · Female insured share: 98.5% · With health insurance: 115,262 · No health insurance: 2,104 · Civilian noninstitutionalized population: 117,366 · Population: 117,794 · Insured margin of error: 2,340 · Uninsured margin of error: 422 · Coverage universe margin of error: 2,378 · Population margin of error: 60 · Males with health insurance: 57,319 · Females with health insurance: 57,943 · Male civilian noninstitutionalized population: 58,546 · Female civilian noninstitutionalized population: 58,820New YorkLos AngelesChicagoHoustonPhoenixSan FranciscoSeattleDenverDallasAtlantaMiamiBostonMinneapolisDetroitNew OrleansWashingtonPortlandLas VegasSalt Lake CityKansas CityJacksonvilleCharlotteAnchorageUrban HonoluluInsured share71.4%98.2%
Summary

Darker amber is a higher share of the civilian noninstitutionalized population with health insurance. Each city is a marked point on the US state map. Alaska and Hawaii are inset. Puerto Rico cities are in the ranking and table but are not drawn here.

Among the 346 US cities with at least 100,000 residents on the 2023 ACS five-year estimates, a typical city has 91.4% of its civilian noninstitutionalized population with health insurance, the midpoint of these city rates. Cambridge, Massachusetts has the highest insured share at 98.2%, and Brownsville, Texas has the lowest at 71.4%. 53 cities sit at or above 95% insured, while 123 sit below 90%. These are each city's own coverage rates, not a United States coverage rate.

In short

91.4%typical citymidpoint insured share, not an average
98.2%Cambridge, Massachusettshighest insured share
71.4%Brownsville, Texaslowest insured share in this set
53cities at or above 95% insuredof 346 cities with 100,000 or more people
8.6%typical uninsured sharemidpoint of the city uninsured rates
Figure 1

Insured share, all published cities

Insured share · all 346 · ranked high to low

346 items
View100%
DownloadPDFImageCSV
Insured share, all published citiesEvery incorporated or Census place with at least 100,000 residents, 346 in all. Cambridge, Massachusetts leads at 98.2% insured. Brownsville, Texas is lowest at 71.4%. The middle city sits at 91.4%. Shares are sums of B27001 age-by-sex leaf cells with coverage, divided by the civilian noninstitutionalized total.0.0%20.0%40.0%60.0%80.0%100.0%Insured share (%)98.2%Cambridge, Massachusetts97.5%Naperville, Illinois97.3%Fremont, California97.2%Ann Arbor, Michigan97.2%Elk Grove, California97.2%Roseville, California97.1%Berkeley, California97.0%Boston, Massachusetts97.0%Vacaville, California96.9%Santa Clara, California96.9%Sunnyvale, California96.7%Carmel, Indiana96.7%Highlands Ranch, Colorado96.6%Washington, District of Col…96.5%Boulder, Colorado96.5%Fishers, Indiana96.5%Quincy, Massachusetts96.5%San Francisco, California96.4%Clovis, California96.4%Springfield, Massachusetts96.3%Buffalo, New York96.2%Centennial, Colorado96.2%Urban Honolulu, Hawaii96.1%Worcester, Massachusetts96.0%Lowell, Massachusetts95.9%Carlsbad, California95.8%Irvine, California95.8%Springfield, Illinois95.7%Lancaster, California95.7%Madison, Wisconsin95.7%Ponce, Puerto Rico95.7%Rochester, Minnesota95.7%San Mateo, California95.6%Bellevue, Washington95.6%Burbank, California95.6%Lynn, Massachusetts95.6%Seattle, Washington95.6%Torrance, California95.5%Brockton, Massachusetts95.5%Cedar Rapids, Iowa95.4%Columbia, Maryland95.3%Albany, New York95.3%Arvada, Colorado95.3%Rio Rancho, New Mexico95.3%Scottsdale, Arizona95.3%Thousand Oaks, California95.2%Dearborn, Michigan95.2%Santa Clarita, California95.1%New Bedford, Massachusetts95.1%Rochester, New York95.1%San Jose, California95.1%Syracuse, New York95.0%Overland Park, Kansas94.9%Menifee, California94.9%Rancho Cucamonga, California94.8%Pittsburgh, Pennsylvania94.8%Spokane, Washington94.7%Arlington, Virginia94.7%Daly City, California94.7%Huntington Beach, California94.7%Lee's Summit, Missouri94.7%Murrieta, California94.6%Cary, North Carolina94.6%Modesto, California94.6%Simi Valley, California94.5%Eugene, Oregon94.5%Portland, Oregon94.5%Sacramento, California94.4%Fort Collins, Colorado94.3%Hayward, California94.3%San Buenaventura (Ventura),…94.2%Baltimore, Maryland94.2%Concord, California94.2%Louisville/Jefferson County…94.2%Sterling Heights, Michigan94.2%West Covina, California94.1%Fairfield, California94.1%Gilbert, Arizona94.1%Minneapolis, Minnesota94.1%Oakland, California94.1%Temecula, California94.1%Visalia, California93.9%Fargo, North Dakota93.8%Lansing, Michigan93.8%Orange, California93.7%Hillsboro, Oregon93.7%Pasadena, California93.7%Pueblo, Colorado93.7%San Diego, California93.7%Warren, Michigan93.6%Charleston, South Carolina93.6%Columbia, Missouri93.6%New York, New York93.6%Santa Rosa, California93.6%St. Paul, Minnesota93.6%Surprise, Arizona93.6%Toledo, Ohio93.6%Vallejo, California93.5%Chico, California93.5%El Cajon, California93.5%Fresno, California93.5%Spokane Valley, Washington93.5%Virginia Beach, Virginia93.5%Yonkers, New York93.4%Chesapeake, Virginia93.4%Frisco, Texas93.4%Meridian, Idaho93.3%Antioch, California93.3%Des Moines, Iowa93.3%Glendale, California93.3%Lincoln, Nebraska93.2%Bend, Oregon93.2%Henderson, Nevada93.2%Lexington-Fayette urban cou…93.2%Peoria, Illinois93.2%Stockton, California93.2%The Woodlands, Texas93.1%Billings, Montana93.1%Chula Vista, California93.1%Hampton, Virginia93.1%Olathe, Kansas93.0%Pearland, Texas93.0%Peoria, Arizona93.0%Rockford, Illinois92.9%Chandler, Arizona92.8%Bayamón, Puerto Rico92.8%Davenport, Iowa92.8%Philadelphia, Pennsylvania92.8%Tacoma, Washington92.8%Tuscaloosa, Alabama92.7%Fullerton, California92.6%Carolina, Puerto Rico92.6%Providence, Rhode Island92.6%Salem, Oregon92.6%Westminster, Colorado92.5%Detroit, Michigan92.5%New Haven, Connecticut92.5%Renton, Washington92.4%Cincinnati, Ohio92.4%Goodyear, Arizona92.4%Lakewood, Colorado92.4%Waterbury, Connecticut92.3%Boise City, Idaho92.3%Cleveland, Ohio92.3%Colorado Springs, Colorado92.3%Grand Rapids, Michigan92.3%Sugar Land, Texas92.2%Downey, California92.2%Sioux Falls, South Dakota92.1%Bakersfield, California92.1%Shreveport, Louisiana91.9%College Station, Texas91.9%Columbia, South Carolina91.9%Garden Grove, California91.9%Palmdale, California91.9%Tallahassee, Florida91.8%Gainesville, Florida91.8%Richmond, California91.8%Sandy Springs, Georgia91.7%Albuquerque, New Mexico91.7%Concord, North Carolina91.7%Dayton, Ohio91.7%Gresham, Oregon91.6%Allen, Texas91.6%Corona, California91.6%Enterprise, Nevada91.6%Green Bay, Wisconsin91.6%Jersey City, New Jersey91.6%New Orleans, Louisiana91.6%Vancouver, Washington91.5%Riverview, Florida91.5%West Jordan, Utah91.4%Akron, Ohio91.4%Kent, Washington91.4%McKinney, Texas91.3%Alexandria, Virginia91.3%Las Cruces, New Mexico91.3%League City, Texas91.3%Newport News, Virginia91.3%San Juan, Puerto Rico91.2%Denver, Colorado91.2%Evansville, Indiana91.2%Everett, Washington91.2%Joliet, Illinois91.2%Manchester, New Hampshire91.2%San Tan Valley, Arizona91.1%Murfreesboro, Tennessee91.0%Indianapolis city (balance)…91.0%Long Beach, California90.9%Greensboro, North Carolina90.9%Milwaukee, Wisconsin90.9%Norfolk, Virginia90.9%Oceanside, California90.9%South Bend, Indiana90.8%Fontana, California90.8%Stamford, Connecticut90.8%Victorville, California90.7%Clarksville, Tennessee90.7%Ontario, California90.7%Riverside, California90.7%St. Louis, Missouri90.6%Fort Wayne, Indiana90.6%Huntsville, Alabama90.6%Provo, Utah90.5%Lafayette, Louisiana90.5%Thornton, Colorado90.4%Metairie, Louisiana90.4%Norwalk, California90.4%Pembroke Pines, Florida90.3%Aurora, Illinois90.3%Hartford, Connecticut90.3%Omaha, Nebraska90.3%Sparks, Nevada90.2%Chicago, Illinois90.2%Columbus, Ohio90.2%Richmond, Virginia90.1%Norman, Oklahoma90.1%South Fulton, Georgia90.1%Topeka, Kansas90.0%Anchorage, Alaska90.0%Little Rock, Arkansas90.0%Los Angeles, California90.0%Tempe, Arizona89.9%Raleigh, North Carolina89.8%Nampa, Idaho89.7%Broken Arrow, Oklahoma89.7%Moreno Valley, California89.6%Hesperia, California89.6%Inglewood, California89.5%Atlanta, Georgia89.5%Mobile, Alabama89.5%Reno, Nevada89.5%Rialto, California89.5%St. Petersburg, Florida89.4%Anaheim, California89.4%Costa Mesa, California89.4%Greeley, Colorado89.3%Baton Rouge, Louisiana89.2%Allentown, Pennsylvania89.2%Fayetteville, North Carolina89.2%Port St. Lucie, Florida89.2%San Bernardino, California89.1%Elgin, Illinois89.0%Pomona, California89.0%Salt Lake City, Utah89.0%Tampa, Florida89.0%Tucson, Arizona88.9%Mesa, Arizona88.9%Round Rock, Texas88.8%Athens-Clarke County unifie…88.7%Columbus, Georgia88.7%Kansas City, Missouri88.7%Knoxville, Tennessee88.7%Lakeland, Florida88.7%Montgomery, Alabama88.6%Plano, Texas88.5%Augusta-Richmond County con…88.5%Escondido, California88.5%High Point, North Carolina88.4%Cape Coral, Florida88.4%Durham, North Carolina88.4%Wilmington, North Carolina88.3%Chattanooga, Tennessee88.3%Jacksonville, Florida88.2%Spring Hill, Florida88.1%Coral Springs, Florida88.1%Winston-Salem, North Caroli…87.9%Palm Bay, Florida87.8%Jurupa Valley, California87.8%Miramar, Florida87.6%Austin, Texas87.6%Santa Ana, California87.6%Spring Valley, Nevada87.6%Wichita, Kansas87.5%Birmingham, Alabama87.4%Nashville-Davidson metropol…87.4%Salinas, California87.1%Brandon, Florida87.1%Charlotte, North Carolina87.0%Aurora, Colorado86.9%El Monte, California86.9%Independence, Missouri86.9%North Las Vegas, Nevada86.9%Richardson, Texas86.8%Glendale, Arizona86.8%Las Vegas, Nevada86.7%Davie, Florida86.5%Lubbock, Texas86.4%Macon-Bibb County, Georgia86.2%Savannah, Georgia86.1%Orlando, Florida86.0%Oklahoma City, Oklahoma85.9%Clearwater, Florida85.9%Fort Lauderdale, Florida85.9%Springfield, Missouri85.6%Bridgeport, Connecticut85.5%Phoenix, Arizona85.5%Waco, Texas85.4%Jackson, Mississippi85.4%Paradise, Nevada85.2%Memphis, Tennessee85.2%Midland, Texas85.2%West Palm Beach, Florida85.0%Oxnard, California84.9%Abilene, Texas84.8%Denton, Texas84.7%East Los Angeles, California84.6%Carrollton, Texas84.5%Santa Maria, California84.3%Hialeah, Florida84.3%Killeen, Texas84.2%Amarillo, Texas83.9%Lewisville, Texas83.6%Wichita Falls, Texas83.5%Tulsa, Oklahoma83.3%Hollywood, Florida83.2%North Charleston, South Car…82.5%San Antonio, Texas82.4%Miami, Florida82.2%Corpus Christi, Texas82.2%Odessa, Texas82.2%Tyler, Texas82.1%Lehigh Acres, Florida82.1%West Valley City, Utah81.9%Sunrise Manor, Nevada81.6%Grand Prairie, Texas81.6%Kansas City, Kansas81.4%Fort Worth, Texas81.3%Arlington, Texas80.9%Newark, New Jersey80.9%Paterson, New Jersey80.6%Miami Gardens, Florida79.0%El Paso, Texas78.9%Pompano Beach, Florida78.6%Mesquite, Texas78.5%Beaumont, Texas78.4%Irving, Texas77.1%Elizabeth, New Jersey77.0%Dallas, Texas76.0%Houston, Texas74.3%Edinburg, Texas74.2%Garland, Texas74.2%McAllen, Texas72.0%Pasadena, Texas71.6%Laredo, Texas71.4%Brownsville, Texas
Summary

Every incorporated or Census place with at least 100,000 residents, 346 in all. Cambridge, Massachusetts leads at 98.2% insured. Brownsville, Texas is lowest at 71.4%. The middle city sits at 91.4%. Shares are sums of B27001 age-by-sex leaf cells with coverage, divided by the civilian noninstitutionalized total.

Figure 2

Male insured share, all published cities

Male insured share · all 346 · ranked high to low

346 items
View100%
DownloadPDFImageCSV
Male insured share, all published citiesMale insured share for every city of 100,000 or more, from B27001 male age-band leaf cells. The overall city ranking above uses both sexes; this figure isolates males.0.0%20.0%40.0%60.0%80.0%100.0%Male insured share (%)97.9%Cambridge, Massachusetts97.2%Fremont, California97.0%Naperville, Illinois97.0%Fishers, Indiana96.9%Ann Arbor, Michigan96.8%Santa Clara, California96.8%Highlands Ranch, Colorado96.7%Roseville, California96.6%Elk Grove, California96.6%Berkeley, California96.6%Vacaville, California96.5%Sunnyvale, California96.5%Carmel, Indiana96.2%Boston, Massachusetts96.0%Boulder, Colorado96.0%Centennial, Colorado96.0%Urban Honolulu, Hawaii95.9%San Francisco, California95.8%Washington, District of Col…95.8%Quincy, Massachusetts95.8%Carlsbad, California95.8%Rochester, Minnesota95.7%Clovis, California95.7%Lancaster, California95.6%Irvine, California95.5%Worcester, Massachusetts95.3%Buffalo, New York95.3%Bellevue, Washington95.0%Springfield, Illinois95.0%Thousand Oaks, California94.9%Springfield, Massachusetts94.9%Madison, Wisconsin94.9%Burbank, California94.8%San Mateo, California94.8%Seattle, Washington94.8%Columbia, Maryland94.8%Rio Rancho, New Mexico94.8%Menifee, California94.7%Torrance, California94.7%Brockton, Massachusetts94.7%Cedar Rapids, Iowa94.7%Arvada, Colorado94.7%Rancho Cucamonga, California94.5%Lowell, Massachusetts94.5%Lynn, Massachusetts94.5%Scottsdale, Arizona94.5%Santa Clarita, California94.5%Arlington, Virginia94.4%San Jose, California94.3%Dearborn, Michigan94.3%Overland Park, Kansas94.2%Murrieta, California94.1%Ponce, Puerto Rico94.1%Pittsburgh, Pennsylvania94.1%Huntington Beach, California93.9%Cary, North Carolina93.8%New Bedford, Massachusetts93.8%Daly City, California93.8%Fort Collins, Colorado93.7%Albany, New York93.7%Spokane, Washington93.7%Temecula, California93.6%Eugene, Oregon93.6%Sterling Heights, Michigan93.6%Gilbert, Arizona93.5%Syracuse, New York93.5%Portland, Oregon93.5%Sacramento, California93.4%Lee's Summit, Missouri93.4%Modesto, California93.4%Simi Valley, California93.4%Concord, California93.4%Minneapolis, Minnesota93.4%Surprise, Arizona93.3%Rochester, New York93.3%San Buenaventura (Ventura),…93.3%Fairfield, California93.2%Frisco, Texas93.1%Hayward, California93.1%Oakland, California93.1%Visalia, California93.1%El Cajon, California93.1%Lincoln, Nebraska93.0%Louisville/Jefferson County…93.0%San Diego, California92.9%West Covina, California92.8%Baltimore, Maryland92.8%Orange, California92.8%Hillsboro, Oregon92.7%Fargo, North Dakota92.7%Pueblo, Colorado92.7%Chesapeake, Virginia92.7%Goodyear, Arizona92.6%Pasadena, California92.6%Virginia Beach, Virginia92.6%Henderson, Nevada92.5%Yonkers, New York92.5%Glendale, California92.5%Peoria, Illinois92.4%Warren, Michigan92.4%St. Paul, Minnesota92.4%Chico, California92.4%Chula Vista, California92.4%Pearland, Texas92.4%Peoria, Arizona92.3%Spokane Valley, Washington92.3%Meridian, Idaho92.3%Olathe, Kansas92.3%Chandler, Arizona92.2%Columbia, Missouri92.2%New York, New York92.2%Vallejo, California92.2%Fresno, California92.2%Bend, Oregon92.2%The Woodlands, Texas92.1%Charleston, South Carolina92.1%Toledo, Ohio92.1%Antioch, California92.0%Santa Rosa, California92.0%Tuscaloosa, Alabama91.9%Lansing, Michigan91.9%Des Moines, Iowa91.9%Hampton, Virginia91.8%Stockton, California91.8%Lakewood, Colorado91.7%Fullerton, California91.7%Providence, Rhode Island91.7%Sugar Land, Texas91.7%Allen, Texas91.6%Rockford, Illinois91.6%Tacoma, Washington91.6%New Haven, Connecticut91.5%Lexington-Fayette urban cou…91.5%Billings, Montana91.5%Downey, California91.4%Philadelphia, Pennsylvania91.4%Renton, Washington91.4%League City, Texas91.3%College Station, Texas91.3%Enterprise, Nevada91.2%Salem, Oregon91.2%Colorado Springs, Colorado91.2%Corona, California91.1%Davenport, Iowa91.1%Cincinnati, Ohio91.1%Waterbury, Connecticut91.1%Sioux Falls, South Dakota91.1%Tallahassee, Florida91.0%Westminster, Colorado91.0%Boise City, Idaho91.0%Grand Rapids, Michigan91.0%Garden Grove, California90.9%Palmdale, California90.7%Bakersfield, California90.7%Shreveport, Louisiana90.7%Sandy Springs, Georgia90.7%Jersey City, New Jersey90.7%Riverview, Florida90.7%Las Cruces, New Mexico90.6%Carolina, Puerto Rico90.6%Detroit, Michigan90.6%Concord, North Carolina90.6%West Jordan, Utah90.6%McKinney, Texas90.6%Alexandria, Virginia90.5%Bayamón, Puerto Rico90.5%Kent, Washington90.5%Manchester, New Hampshire90.5%Sparks, Nevada90.4%Albuquerque, New Mexico90.4%Gresham, Oregon90.4%San Tan Valley, Arizona90.3%Dayton, Ohio90.3%Vancouver, Washington90.2%Cleveland, Ohio90.2%Gainesville, Florida90.2%Green Bay, Wisconsin90.2%Murfreesboro, Tennessee90.2%Thornton, Colorado90.1%Denver, Colorado90.1%Fontana, California90.1%Ontario, California90.0%Columbia, South Carolina90.0%Richmond, California90.0%Long Beach, California89.9%Oceanside, California89.9%Victorville, California89.9%Huntsville, Alabama89.8%Akron, Ohio89.8%Joliet, Illinois89.8%Greensboro, North Carolina89.8%Provo, Utah89.7%Everett, Washington89.7%Port St. Lucie, Florida89.6%Newport News, Virginia89.6%Indianapolis city (balance)…89.6%Pembroke Pines, Florida89.6%Omaha, Nebraska89.5%South Bend, Indiana89.5%Riverside, California89.4%Evansville, Indiana89.4%South Fulton, Georgia89.3%Norwalk, California89.3%Tempe, Arizona89.2%Fort Wayne, Indiana89.1%San Juan, Puerto Rico89.1%Milwaukee, Wisconsin89.1%Aurora, Illinois89.0%St. Louis, Missouri89.0%Lafayette, Louisiana88.9%Clarksville, Tennessee88.9%Chicago, Illinois88.8%Broken Arrow, Oklahoma88.8%Moreno Valley, California88.8%Elgin, Illinois88.7%New Orleans, Louisiana88.7%Norman, Oklahoma88.6%Topeka, Kansas88.6%Anchorage, Alaska88.5%Stamford, Connecticut88.5%Hartford, Connecticut88.4%Nampa, Idaho88.4%Rialto, California88.3%Costa Mesa, California88.2%Norfolk, Virginia88.2%Columbus, Ohio88.2%Los Angeles, California88.2%Raleigh, North Carolina88.2%Atlanta, Georgia88.2%Reno, Nevada88.2%Salt Lake City, Utah88.1%Athens-Clarke County unifie…88.0%Richmond, Virginia88.0%Little Rock, Arkansas88.0%Anaheim, California87.9%Round Rock, Texas87.9%Kansas City, Missouri87.8%Mobile, Alabama87.8%St. Petersburg, Florida87.8%Greeley, Colorado87.8%Plano, Texas87.7%Fayetteville, North Carolina87.7%Mesa, Arizona87.7%Columbus, Georgia87.6%Metairie, Louisiana87.6%Hesperia, California87.6%San Bernardino, California87.6%Tampa, Florida87.6%Montgomery, Alabama87.6%High Point, North Carolina87.4%Baton Rouge, Louisiana87.4%Tucson, Arizona87.4%Lakeland, Florida87.3%Spring Hill, Florida87.2%Augusta-Richmond County con…87.1%Inglewood, California87.1%Coral Springs, Florida87.0%Richardson, Texas86.9%Allentown, Pennsylvania86.9%Knoxville, Tennessee86.9%Durham, North Carolina86.9%Jurupa Valley, California86.9%Miramar, Florida86.8%Pomona, California86.7%Escondido, California86.7%Cape Coral, Florida86.6%Jacksonville, Florida86.6%Austin, Texas86.6%Santa Ana, California86.6%Wichita, Kansas86.5%Glendale, Arizona86.3%North Las Vegas, Nevada86.1%Chattanooga, Tennessee86.1%Winston-Salem, North Caroli…86.1%Independence, Missouri86.0%Spring Valley, Nevada86.0%Charlotte, North Carolina85.9%Palm Bay, Florida85.8%Davie, Florida85.8%Midland, Texas85.7%Salinas, California85.6%Brandon, Florida85.6%Lubbock, Texas85.5%Nashville-Davidson metropol…85.5%Las Vegas, Nevada85.4%Aurora, Colorado85.0%Orlando, Florida85.0%Fort Lauderdale, Florida84.9%Birmingham, Alabama84.9%Waco, Texas84.8%Wilmington, North Carolina84.6%Paradise, Nevada84.5%Macon-Bibb County, Georgia84.5%Oklahoma City, Oklahoma84.4%Savannah, Georgia84.4%Phoenix, Arizona84.3%El Monte, California83.9%Springfield, Missouri83.6%Clearwater, Florida83.5%Carrollton, Texas83.4%Abilene, Texas83.3%Denton, Texas83.3%East Los Angeles, California83.2%Lewisville, Texas83.1%Bridgeport, Connecticut83.1%Jackson, Mississippi83.0%Killeen, Texas82.9%Oxnard, California82.7%Amarillo, Texas82.6%Wichita Falls, Texas82.6%Odessa, Texas82.5%Memphis, Tennessee82.3%Santa Maria, California81.9%West Palm Beach, Florida81.9%Tulsa, Oklahoma81.3%Hollywood, Florida81.3%Tyler, Texas81.0%West Valley City, Utah80.8%Hialeah, Florida80.7%Corpus Christi, Texas80.7%Sunrise Manor, Nevada80.6%North Charleston, South Car…80.6%San Antonio, Texas80.5%Grand Prairie, Texas80.4%Fort Worth, Texas80.0%Arlington, Texas79.9%Kansas City, Kansas79.8%Miami, Florida79.7%Lehigh Acres, Florida79.0%Miami Gardens, Florida78.3%Newark, New Jersey78.2%El Paso, Texas77.8%Irving, Texas77.5%Paterson, New Jersey77.3%Beaumont, Texas77.0%Mesquite, Texas75.8%Pompano Beach, Florida75.0%Dallas, Texas74.6%Edinburg, Texas74.4%Elizabeth, New Jersey73.9%Houston, Texas73.8%McAllen, Texas72.8%Garland, Texas72.2%Laredo, Texas71.3%Pasadena, Texas70.9%Brownsville, Texas
Summary

Male insured share for every city of 100,000 or more, from B27001 male age-band leaf cells. The overall city ranking above uses both sexes; this figure isolates males.

Figure 3

Female insured share, all published cities

Female insured share · all 346 · ranked high to low

346 items
View100%
DownloadPDFImageCSV
Female insured share, all published citiesFemale insured share for every city of 100,000 or more, from B27001 female age-band leaf cells. The overall city ranking above uses both sexes; this figure isolates females.0.0%20.0%40.0%60.0%80.0%100.0%Female insured share (%)98.5%Cambridge, Massachusetts97.9%Naperville, Illinois97.8%Elk Grove, California97.8%Springfield, Massachusetts97.6%Roseville, California97.6%Berkeley, California97.6%Boston, Massachusetts97.5%Fremont, California97.5%Ann Arbor, Michigan97.5%Lowell, Massachusetts97.3%Vacaville, California97.3%Sunnyvale, California97.3%Washington, District of Col…97.3%Quincy, Massachusetts97.3%San Francisco, California97.2%Buffalo, New York97.0%Santa Clara, California97.0%Carmel, Indiana97.0%Boulder, Colorado97.0%Clovis, California97.0%Ponce, Puerto Rico96.9%Rochester, New York96.8%Worcester, Massachusetts96.8%Albany, New York96.7%Lynn, Massachusetts96.6%Highlands Ranch, Colorado96.6%Springfield, Illinois96.6%Syracuse, New York96.5%Madison, Wisconsin96.5%San Mateo, California96.5%Seattle, Washington96.5%Torrance, California96.5%New Bedford, Massachusetts96.4%Urban Honolulu, Hawaii96.3%Centennial, Colorado96.3%Burbank, California96.3%Cedar Rapids, Iowa96.2%Brockton, Massachusetts96.1%Irvine, California96.0%Fishers, Indiana96.0%Carlsbad, California96.0%Bellevue, Washington96.0%Dearborn, Michigan96.0%Santa Clarita, California96.0%Spokane, Washington96.0%Lee's Summit, Missouri95.9%Columbia, Maryland95.9%Arvada, Colorado95.9%Scottsdale, Arizona95.8%Rio Rancho, New Mexico95.8%San Jose, California95.8%Overland Park, Kansas95.8%Modesto, California95.7%Lancaster, California95.7%Simi Valley, California95.6%Rochester, Minnesota95.6%Lansing, Michigan95.5%Thousand Oaks, California95.5%Daly City, California95.5%Portland, Oregon95.5%Sacramento, California95.4%Pittsburgh, Pennsylvania95.4%Eugene, Oregon95.4%Hayward, California95.4%Baltimore, Maryland95.3%San Buenaventura (Ventura),…95.3%West Covina, California95.2%Huntington Beach, California95.2%Cary, North Carolina95.2%Louisville/Jefferson County…95.2%Visalia, California95.1%Murrieta, California95.1%Concord, California95.1%Oakland, California95.1%Fargo, North Dakota95.1%Vallejo, California95.0%Rancho Cucamonga, California95.0%Arlington, Virginia95.0%Fort Collins, Colorado95.0%Warren, Michigan95.0%Santa Rosa, California95.0%Toledo, Ohio94.9%Menifee, California94.9%Fairfield, California94.9%Orange, California94.9%Charleston, South Carolina94.9%Columbia, Missouri94.9%New York, New York94.8%Minneapolis, Minnesota94.8%Fresno, California94.8%Spokane Valley, Washington94.8%Des Moines, Iowa94.8%Billings, Montana94.7%Sterling Heights, Michigan94.7%Hillsboro, Oregon94.7%Pasadena, California94.7%Pueblo, Colorado94.7%St. Paul, Minnesota94.7%Lexington-Fayette urban cou…94.7%Bayamón, Puerto Rico94.6%Chico, California94.6%Davenport, Iowa94.5%Gilbert, Arizona94.5%Yonkers, New York94.5%Stockton, California94.4%Temecula, California94.4%San Diego, California94.4%Virginia Beach, Virginia94.4%Meridian, Idaho94.3%Antioch, California94.3%Bend, Oregon94.3%Carolina, Puerto Rico94.2%The Woodlands, Texas94.2%Rockford, Illinois94.2%Philadelphia, Pennsylvania94.2%Detroit, Michigan94.2%Cleveland, Ohio94.1%Hampton, Virginia94.1%Westminster, Colorado94.1%New Orleans, Louisiana94.0%Chesapeake, Virginia94.0%Glendale, California94.0%Tacoma, Washington93.9%El Cajon, California93.9%Chula Vista, California93.9%Olathe, Kansas93.9%Salem, Oregon93.8%Henderson, Nevada93.8%Peoria, Illinois93.8%Waterbury, Connecticut93.7%Surprise, Arizona93.7%Cincinnati, Ohio93.7%Boise City, Idaho93.6%Frisco, Texas93.6%Pearland, Texas93.6%Peoria, Arizona93.6%Fullerton, California93.6%Grand Rapids, Michigan93.6%Columbia, South Carolina93.5%Chandler, Arizona93.5%Tuscaloosa, Alabama93.5%Renton, Washington93.5%Bakersfield, California93.4%Lincoln, Nebraska93.4%Providence, Rhode Island93.4%Richmond, California93.3%New Haven, Connecticut93.3%Colorado Springs, Colorado93.3%Shreveport, Louisiana93.3%Gainesville, Florida93.3%Norfolk, Virginia93.2%Sioux Falls, South Dakota93.1%Dayton, Ohio93.1%San Juan, Puerto Rico93.1%Metairie, Louisiana93.0%Lakewood, Colorado93.0%Sugar Land, Texas93.0%Albuquerque, New Mexico93.0%Akron, Ohio93.0%Evansville, Indiana93.0%Stamford, Connecticut92.9%Palmdale, California92.9%Gresham, Oregon92.9%Green Bay, Wisconsin92.9%Vancouver, Washington92.8%Garden Grove, California92.8%Sandy Springs, Georgia92.8%Concord, North Carolina92.8%Newport News, Virginia92.8%Everett, Washington92.7%Downey, California92.6%Tallahassee, Florida92.5%College Station, Texas92.5%Jersey City, New Jersey92.5%Joliet, Illinois92.5%Milwaukee, Wisconsin92.4%West Jordan, Utah92.4%Kent, Washington92.4%Denver, Colorado92.4%Indianapolis city (balance)…92.3%Clarksville, Tennessee92.2%Goodyear, Arizona92.2%Riverview, Florida92.2%South Bend, Indiana92.2%St. Louis, Missouri92.2%Columbus, Ohio92.1%McKinney, Texas92.1%San Tan Valley, Arizona92.1%Richmond, Virginia92.0%Enterprise, Nevada92.0%Murfreesboro, Tennessee92.0%Long Beach, California92.0%Greensboro, North Carolina92.0%Inglewood, California91.9%Corona, California91.9%Fort Wayne, Indiana91.9%Hartford, Connecticut91.8%Alexandria, Virginia91.8%Las Cruces, New Mexico91.8%Manchester, New Hampshire91.8%Oceanside, California91.8%Riverside, California91.8%Lafayette, Louisiana91.7%Victorville, California91.7%Little Rock, Arkansas91.7%Los Angeles, California91.7%Hesperia, California91.6%Raleigh, North Carolina91.5%Allen, Texas91.5%Fontana, California91.5%Norwalk, California91.5%Topeka, Kansas91.5%Wilmington, North Carolina91.4%Aurora, Illinois91.4%Chicago, Illinois91.4%Norman, Oklahoma91.4%Allentown, Pennsylvania91.3%Ontario, California91.3%Huntsville, Alabama91.3%Provo, Utah91.3%Anchorage, Alaska91.2%Nampa, Idaho91.2%Pomona, California91.1%League City, Texas91.1%Pembroke Pines, Florida91.0%Omaha, Nebraska91.0%St. Petersburg, Florida91.0%Greeley, Colorado91.0%Baton Rouge, Louisiana90.9%Thornton, Colorado90.9%Mobile, Alabama90.8%South Fulton, Georgia90.8%Tempe, Arizona90.8%San Bernardino, California90.7%Moreno Valley, California90.7%Atlanta, Georgia90.7%Reno, Nevada90.6%Broken Arrow, Oklahoma90.6%Anaheim, California90.5%Rialto, California90.5%Costa Mesa, California90.5%Fayetteville, North Carolina90.5%Tucson, Arizona90.4%Knoxville, Tennessee90.4%Escondido, California90.4%Chattanooga, Tennessee90.3%Tampa, Florida90.2%Sparks, Nevada90.1%Mesa, Arizona90.1%Cape Coral, Florida90.0%Jacksonville, Florida89.9%Salt Lake City, Utah89.9%Round Rock, Texas89.9%Lakeland, Florida89.8%Winston-Salem, North Caroli…89.7%Montgomery, Alabama89.7%Durham, North Carolina89.7%Palm Bay, Florida89.7%Birmingham, Alabama89.6%Columbus, Georgia89.6%Augusta-Richmond County con…89.5%Kansas City, Missouri89.5%El Monte, California89.4%Elgin, Illinois89.4%Athens-Clarke County unifie…89.4%Plano, Texas89.4%High Point, North Carolina89.2%Spring Valley, Nevada89.2%Nashville-Davidson metropol…89.1%Salinas, California89.0%Spring Hill, Florida88.9%Coral Springs, Florida88.8%Port St. Lucie, Florida88.8%Jurupa Valley, California88.6%Miramar, Florida88.6%Austin, Texas88.6%Santa Ana, California88.6%Wichita, Kansas88.6%Aurora, Colorado88.5%West Palm Beach, Florida88.4%Brandon, Florida88.2%Charlotte, North Carolina88.2%Clearwater, Florida88.1%Las Vegas, Nevada88.1%Macon-Bibb County, Georgia88.0%Bridgeport, Connecticut87.9%Springfield, Missouri87.7%Independence, Missouri87.7%Savannah, Georgia87.7%Hialeah, Florida87.6%Memphis, Tennessee87.5%North Las Vegas, Nevada87.5%Davie, Florida87.4%Oklahoma City, Oklahoma87.3%Lubbock, Texas87.3%Jackson, Mississippi87.2%Orlando, Florida87.1%Glendale, Arizona87.1%Oxnard, California86.9%Fort Lauderdale, Florida86.8%Richardson, Texas86.6%Phoenix, Arizona86.6%Santa Maria, California86.3%Denton, Texas86.2%Paradise, Nevada86.2%East Los Angeles, California86.1%Abilene, Texas86.0%Waco, Texas85.6%Amarillo, Texas85.6%North Charleston, South Car…85.5%Carrollton, Texas85.4%Killeen, Texas85.3%Hollywood, Florida85.0%Tulsa, Oklahoma85.0%Miami, Florida84.7%Midland, Texas84.7%Wichita Falls, Texas84.6%Lewisville, Texas84.5%Lehigh Acres, Florida84.2%San Antonio, Texas84.2%Paterson, New Jersey83.7%Corpus Christi, Texas83.4%Newark, New Jersey83.3%Kansas City, Kansas83.2%West Valley City, Utah83.1%Tyler, Texas83.1%Sunrise Manor, Nevada82.8%Grand Prairie, Texas82.4%Fort Worth, Texas82.4%Arlington, Texas82.4%Pompano Beach, Florida82.2%Miami Gardens, Florida81.8%Odessa, Texas80.0%Mesquite, Texas79.9%El Paso, Texas79.8%Elizabeth, New Jersey79.7%Beaumont, Texas79.0%Irving, Texas79.0%Dallas, Texas78.1%Houston, Texas75.6%Garland, Texas74.5%McAllen, Texas74.1%Edinburg, Texas72.6%Pasadena, Texas71.8%Brownsville, Texas71.0%Laredo, Texas
Summary

Female insured share for every city of 100,000 or more, from B27001 female age-band leaf cells. The overall city ranking above uses both sexes; this figure isolates females.

Figure 4

Male against female insured share

Female insured share against male insured share · one point per row, 346 of 346 plotted

346 items
View100%
DownloadPDFImageCSV
Male against female insured shareEach point is a city of 100,000 or more. The horizontal axis is the male insured share; the vertical axis is the female insured share. Cities near the diagonal have similar coverage for both sexes.70.0%80.0%90.0%100.0%70.0%80.0%90.0%100.0%Female insured share (%)Male insured share (%)
Summary

Each point is a city of 100,000 or more. The horizontal axis is the male insured share; the vertical axis is the female insured share. Cities near the diagonal have similar coverage for both sexes.

Table 1

All cities

346 rows · 17 columns · sorted by insured share, high to low

346 rows
View100%
DownloadPDFImageCSV
Summary

Population, insured and uninsured counts and shares, and male and female insured shares for every US city of 100,000 or more on the 2023 ACS five-year estimates. Sort any column or use the filter box to jump to a city by name. A midpoint of city coverage rates is not a United States coverage rate.

All cities
????????????
Cambridge, Massachusetts98.2%1.8%97.9%98.5%115,2622,104117,366117,7942,3404222,3786057,31957,94358,54658,820
Naperville, Illinois97.5%2.5%97.0%97.9%144,3893,742148,131149,4242,3755262,43339371,47372,91673,66074,471
Fremont, California97.3%2.7%97.2%97.5%221,5576,140227,697228,5183,0097053,09057110,654110,903113,893113,804
Ann Arbor, Michigan97.2%2.8%96.9%97.5%117,2483,386120,634121,1792,1354572,1835058,24859,00060,13160,503
Elk Grove, California97.2%2.8%96.6%97.8%171,9484,911176,859177,2213,0265933,08313483,54588,40386,50390,356
Roseville, California97.2%2.8%96.7%97.6%147,2424,278151,520152,4382,3905392,4508071,87475,36874,30077,220
Berkeley, California97.1%2.9%96.6%97.6%116,4673,434119,901120,2232,4855192,5395056,10660,36158,05561,846
Boston, Massachusetts97.0%3.0%96.2%97.6%639,66220,114659,776663,9723,4201,2613,64576304,741334,921316,772343,004
Vacaville, California97.0%3.0%96.6%97.3%91,4902,86894,358102,0852,1014452,1476343,70447,78645,24549,113
Santa Clara, California96.9%3.1%96.8%97.0%124,6173,995128,612129,2392,7305412,7836564,75659,86166,88961,723
Sunnyvale, California96.9%3.1%96.5%97.3%147,8814,799152,680153,4552,7576532,8339276,81071,07179,62973,051
Carmel, Indiana96.7%3.3%96.5%97.0%96,7873,252100,039100,5012,2075622,27819846,43050,35748,10051,939
Highlands Ranch, Colorado96.7%3.3%96.8%96.6%97,4993,308100,807101,4371,8825091,9492,17649,11248,38750,71450,093
Washington, District of Columbia96.6%3.4%95.8%97.3%640,37922,635663,014672,0792,6921,6523,158, 300,267340,112313,453349,561
Boulder, Colorado96.5%3.5%96.0%97.0%101,5013,677105,178106,2742,0025112,0664952,21849,28354,36650,812
Fishers, Indiana96.5%3.5%97.0%96.0%96,5883,505100,093100,9182,6636392,7393547,93348,65549,42850,665
Quincy, Massachusetts96.5%3.5%95.8%97.3%97,2273,495100,722101,3612,3905812,4603548,38848,83950,52050,202
San Francisco, California96.5%3.5%95.9%97.3%803,42328,786832,209836,3212,4531,5962,926, 409,880393,543427,622404,587
Clovis, California96.4%3.6%95.7%97.0%117,7834,411122,194122,7192,4825912,5516956,81260,97159,34162,853
Springfield, Massachusetts96.4%3.6%94.9%97.8%148,5085,556154,064154,7512,5217592,6339169,70778,80173,46080,604
Buffalo, New York96.3%3.7%95.3%97.2%264,45810,198274,656276,3973,4499373,57465125,018139,440131,241143,415
Centennial, Colorado96.2%3.8%96.0%96.3%101,9804,071106,051107,3861,8845381,9597050,77151,20952,87153,180
Urban Honolulu, Hawaii96.2%3.8%96.0%96.4%321,80112,697334,498346,3233,2948733,408116157,417164,384163,927170,571
Worcester, Massachusetts96.1%3.9%95.5%96.8%195,5237,830203,353205,5013,0958583,2127496,33699,187100,849102,504
Lowell, Massachusetts96.0%4.0%94.5%97.5%109,2984,540113,838114,7992,5226382,6014653,30155,99756,43157,407
Carlsbad, California95.9%4.1%95.8%96.0%108,4744,662113,136114,5002,6147392,7168553,17855,29655,52457,612
Irvine, California95.8%4.2%95.6%96.1%294,96412,809307,773308,1604,7661,2694,932117144,627150,337151,254156,519
Springfield, Illinois95.8%4.2%95.0%96.6%107,4964,682112,178113,7141,5865531,68037651,25656,24053,98258,196
Lancaster, California95.7%4.3%95.7%95.7%158,6217,142165,763170,0133,5967133,6666276,77781,84480,24785,516
Madison, Wisconsin95.7%4.3%94.9%96.5%262,21711,798274,015275,5683,1751,0763,35276129,848132,369136,777137,238
Ponce, Puerto Rico95.7%4.3%94.1%97.0%104,2124,706108,918109,7651,4315201,5221,85847,11757,09550,07858,840
Rochester, Minnesota95.7%4.3%95.8%95.6%114,7225,149119,871121,6381,3676031,4947255,50759,21557,91361,958
San Mateo, California95.7%4.3%94.8%96.5%98,8224,482103,304103,5552,1846152,2695848,62550,19751,27652,028
Bellevue, Washington95.6%4.4%95.3%96.0%144,1196,636150,755151,1992,7057582,8106173,06071,05976,70374,052
Burbank, California95.6%4.4%94.9%96.3%100,1784,627104,805105,1652,7225932,7868148,44551,73351,06153,744
Lynn, Massachusetts95.6%4.4%94.5%96.7%96,2374,436100,673100,9052,3826012,4578347,65448,58350,43050,243
Seattle, Washington95.6%4.4%94.8%96.5%703,51532,117735,632741,4405,7391,8696,036121355,378348,137374,719360,913
Torrance, California95.6%4.4%94.7%96.5%136,1866,226142,412143,4992,7378792,8756566,75569,43170,48271,930
Brockton, Massachusetts95.5%4.5%94.7%96.2%99,3364,707104,043105,0801,9106502,0185047,77251,56450,41953,624
Cedar Rapids, Iowa95.5%4.5%94.7%96.3%129,2596,074135,333136,8591,9227602,0676063,18666,07366,70568,628
Columbia, Maryland95.4%4.6%94.8%95.9%100,0034,847104,850105,8712,1476772,2512,63147,76652,23750,40654,444
Albany, New York95.3%4.7%93.7%96.8%94,1804,63398,813100,0812,1506512,2464844,15850,02247,15151,662
Arvada, Colorado95.3%4.7%94.7%95.9%116,5795,757122,336122,8352,2956702,3916657,72758,85260,97161,365
Rio Rancho, New Mexico95.3%4.7%94.8%95.8%101,0324,991106,023106,5331,4536661,5997249,78051,25252,51953,504
Scottsdale, Arizona95.3%4.7%94.5%95.9%229,09211,420240,512242,1694,0661,0794,206118110,222118,870116,581123,931
Thousand Oaks, California95.3%4.7%95.0%95.5%119,2575,900125,157125,6762,3857012,4866059,17560,08262,27262,885
Dearborn, Michigan95.2%4.8%94.3%96.0%102,3965,217107,613107,8462,2755922,3515750,34452,05253,37454,239
Santa Clarita, California95.2%4.8%94.5%96.0%217,78410,945228,729229,0213,8761,0484,01597107,097110,687113,376115,353
New Bedford, Massachusetts95.1%4.9%93.8%96.5%94,7764,84599,621100,7312,0685832,1496247,10547,67150,24549,376
Rochester, New York95.1%4.9%93.3%96.9%196,86810,064206,932209,7202,7659062,90911492,912103,95699,622107,310
San Jose, California95.1%4.9%94.4%95.8%937,87048,342986,212990,0545,2691,9235,609201473,959463,911501,971484,241
Syracuse, New York95.1%4.9%93.5%96.6%136,7197,020143,739146,2112,3937482,5076564,79571,92469,30774,432
Overland Park, Kansas95.0%5.0%94.3%95.8%186,1519,706195,857197,1992,6888422,8169491,32094,83196,84599,012
Menifee, California94.9%5.1%94.8%94.9%100,8915,425106,316107,0202,7726912,8576349,37951,51252,06254,254
Rancho Cucamonga, California94.9%5.1%94.7%95.0%163,0088,833171,841174,6933,1059123,2378379,99183,01784,50087,341
Pittsburgh, Pennsylvania94.8%5.2%94.1%95.4%283,62015,602299,222303,6203,5521,1873,74657137,675145,945146,239152,983
Spokane, Washington94.8%5.2%93.7%96.0%214,53911,710226,249229,2283,0159153,15174104,983109,556112,070114,179
Arlington, Virginia94.7%5.3%94.5%95.0%218,74012,180230,920235,4631,4609671,751, 108,818109,922115,205115,715
Daly City, California94.7%5.3%93.8%95.5%96,4265,447101,873102,5602,2447522,3665247,72048,70650,88550,988
Huntington Beach, California94.7%5.3%94.1%95.2%185,07010,458195,528196,0103,3991,0893,5697891,49293,57897,20598,323
Lee's Summit, Missouri94.7%5.3%93.4%96.0%96,3865,342101,728102,5832,2726842,3725146,26350,12349,51352,215
Murrieta, California94.7%5.3%94.2%95.1%104,7075,888110,595111,6212,8427952,9516349,97654,73153,04957,546
Cary, North Carolina94.6%5.4%93.9%95.2%166,8289,527176,355176,6863,1539663,29713981,91984,90987,19589,160
Modesto, California94.6%5.4%93.4%95.8%205,55211,737217,289218,6142,9709083,10591100,359105,193107,442109,847
Simi Valley, California94.6%5.4%93.4%95.7%118,6626,773125,435125,7692,3487312,4597757,74260,92061,80963,626
Eugene, Oregon94.5%5.5%93.6%95.4%166,6299,727176,356177,5202,4689372,6407080,77085,85986,31690,040
Portland, Oregon94.5%5.5%93.5%95.5%602,90935,060637,969642,7153,6261,5253,934699296,108306,801316,758321,211
Sacramento, California94.5%5.5%93.5%95.5%491,89528,733520,628524,8024,7531,5384,996252240,521251,374257,362263,266
Fort Collins, Colorado94.4%5.6%93.8%95.0%158,4519,455167,906169,7052,5198622,6626378,24780,20483,45184,455
Hayward, California94.3%5.7%93.1%95.4%148,9979,082158,079159,2012,7348202,8546974,16574,83279,62378,456
San Buenaventura (Ventura), California94.3%5.7%93.3%95.3%102,3276,164108,491109,9002,3856732,4786250,28852,03953,89554,596
Baltimore, Maryland94.2%5.8%92.8%95.4%536,72932,918569,647577,1932,4971,6272,980, 244,890291,839263,761305,886
Concord, California94.2%5.8%93.4%95.1%116,4027,107123,509124,2602,7368012,8514257,83158,57161,94261,567
Louisville/Jefferson County metro government (balance), Kentucky94.2%5.8%93.0%95.2%584,00836,243620,251627,2103,5351,8243,978145280,442303,566301,429318,822
Sterling Heights, Michigan94.2%5.8%93.6%94.7%125,0317,763132,794133,4732,4987862,6197360,75664,27564,90367,891
West Covina, California94.2%5.8%92.9%95.3%100,7586,214106,972107,4362,2836652,3787647,80052,95851,42955,543
Fairfield, California94.1%5.9%93.3%94.9%110,2496,872117,121119,9852,2518122,3935053,32056,92957,13259,989
Gilbert, Arizona94.1%5.9%93.6%94.5%254,74216,076270,818271,1183,6001,2033,796101125,811128,931134,381136,437
Minneapolis, Minnesota94.1%5.9%93.4%94.8%397,82124,917422,738426,8453,9941,3954,23169202,024195,797216,284206,454
Oakland, California94.1%5.9%93.1%95.1%410,12025,773435,893438,0724,1161,3344,32758200,566209,554215,497220,396
Temecula, California94.1%5.9%93.7%94.4%102,5166,461108,977110,4042,6507752,7616449,85852,65853,19955,778
Visalia, California94.1%5.9%93.1%95.2%133,4308,298141,728142,6492,7141,1162,9341,06564,80668,62469,63372,095
Fargo, North Dakota93.9%6.1%92.7%95.1%119,6497,800127,449129,0641,9758402,1464959,49660,15364,20363,246
Lansing, Michigan93.8%6.2%91.9%95.6%105,3816,966112,347112,5461,9847312,1146651,00054,38155,47156,876
Orange, California93.8%6.2%92.8%94.9%127,1378,391135,528138,7232,7937262,8856862,63064,50767,52268,006
Hillsboro, Oregon93.7%6.3%92.8%94.7%99,4726,662106,134107,0502,4488232,5824349,82749,64553,69952,435
Pasadena, California93.7%6.3%92.6%94.7%126,6958,573135,268136,4622,5838012,7056361,82164,87466,76468,504
Pueblo, Colorado93.7%6.3%92.7%94.7%100,9256,777107,702111,5141,6316501,7565149,45851,46753,35754,345
San Diego, California93.7%6.3%93.0%94.4%1,253,62283,8631,337,4851,385,0617,3902,8627,925147618,734634,888665,219672,266
Warren, Michigan93.7%6.3%92.4%95.0%128,4648,625137,089138,1282,5048152,6335662,15766,30767,29269,797
Charleston, South Carolina93.6%6.4%92.1%94.9%140,3159,661149,976152,0142,9319723,0887765,29475,02170,90379,073
Columbia, Missouri93.6%6.4%92.2%94.9%117,9668,065126,031127,2001,9237982,0826455,76062,20660,50365,528
New York, New York93.6%6.4%92.2%94.9%7,916,800543,4468,460,2468,516,20210,1937,23912,502, 3,739,1304,177,6704,055,9054,404,341
Santa Rosa, California93.6%6.4%92.0%95.0%164,17011,300175,470177,2162,6599432,8215478,09086,08084,90690,564
St. Paul, Minnesota93.6%6.4%92.4%94.7%285,58919,604305,193307,7622,9581,2223,20048139,005146,584150,444154,749
Surprise, Arizona93.6%6.4%93.4%93.7%138,6119,544148,155149,5193,1161,3243,3856465,36473,24770,00778,148
Toledo, Ohio93.6%6.4%92.1%95.0%248,81217,018265,830268,4612,6301,1022,85264118,943129,869129,118136,712
Vallejo, California93.6%6.4%92.2%95.1%115,9457,862123,807124,6372,2208192,3667055,81560,13060,55563,252
Chico, California93.5%6.5%92.4%94.6%94,7116,560101,271102,0321,8217761,9805745,47449,23749,23052,041
El Cajon, California93.5%6.5%93.1%93.9%96,1986,715102,913104,9092,6377992,7559447,01849,18050,52352,390
Fresno, California93.5%6.5%92.2%94.8%503,12834,924538,052543,6154,3011,7484,643107245,721257,407266,643271,409
Spokane Valley, Washington93.5%6.5%92.3%94.8%97,8816,755104,636105,4602,3617422,4747147,96049,92151,97552,661
Virginia Beach, Virginia93.5%6.5%92.6%94.4%404,48627,930432,416457,0662,1861,5142,660, 189,519214,967204,665227,751
Yonkers, New York93.5%6.5%92.5%94.5%195,15213,551208,703209,5293,6271,2823,8478192,972102,180100,554108,149
Chesapeake, Virginia93.4%6.6%92.7%94.0%223,31915,854239,173251,1531,5991,2162,008, 105,536117,783113,899125,274
Frisco, Texas93.4%6.6%93.2%93.6%195,82913,896209,725210,2383,4271,1343,61016297,37598,454104,517105,208
Meridian, Idaho93.4%6.6%92.3%94.4%115,9398,249124,188124,8652,8509853,0157556,97858,96161,70362,485
Antioch, California93.3%6.7%92.1%94.3%107,6957,756115,451115,7592,7479742,91411049,88457,81154,14361,308
Des Moines, Iowa93.3%6.7%91.9%94.8%196,80614,067210,873212,4642,7129812,88418596,026100,780104,515106,358
Glendale, California93.3%6.7%92.5%94.0%178,09812,828190,926192,2703,3721,0233,5246784,66393,43591,56599,361
Lincoln, Nebraska93.3%6.7%93.1%93.4%267,97919,394287,373291,9321,8291,1612,16671133,456134,523143,375143,998
Bend, Oregon93.2%6.8%92.2%94.3%94,3266,867101,193101,4722,0498592,2227646,85447,47250,82850,365
Henderson, Nevada93.2%6.8%92.6%93.8%300,75421,831322,585324,5234,1841,4154,41751148,012152,742159,765162,820
Lexington-Fayette urban county, Kentucky93.2%6.8%91.5%94.7%295,01121,680316,691321,1221,7511,2972,180, 142,018152,993155,197161,494
Peoria, Illinois93.2%6.8%92.5%93.8%103,2517,575110,826112,1261,6537581,81942949,84353,40853,88056,946
Stockton, California93.2%6.8%91.8%94.5%296,88021,621318,501320,4703,5011,3863,765131142,468154,412155,123163,378
The Woodlands, Texas93.2%6.8%92.2%94.2%108,4767,929116,405116,9163,3001,0113,4525,15453,31555,16157,85158,554
Billings, Montana93.1%6.9%91.5%94.8%108,3877,971116,358118,3211,7168121,8984352,87855,50957,79258,566
Chula Vista, California93.1%6.9%92.4%93.9%250,43818,451268,889275,0304,2941,3114,49061121,488128,950131,493137,396
Hampton, Virginia93.1%6.9%91.9%94.1%121,3199,020130,339137,3341,2889141,580, 55,69665,62360,60769,732
Olathe, Kansas93.1%6.9%92.3%93.9%132,6409,829142,469143,7202,5039092,6636365,75566,88571,21171,258
Pearland, Texas93.0%7.0%92.4%93.6%116,4388,773125,211125,9832,8149272,9637555,88160,55760,48264,729
Peoria, Arizona93.0%7.0%92.4%93.6%179,15913,474192,633194,3383,5001,0973,66720786,38392,77693,48399,150
Rockford, Illinois93.0%7.0%91.6%94.2%134,85010,178145,028147,6491,9578632,13930064,50470,34670,38674,642
Chandler, Arizona92.9%7.1%92.3%93.5%257,75519,757277,512278,1233,9521,4104,19677128,346129,409139,098138,414
Bayamón, Puerto Rico92.8%7.2%90.5%94.7%150,78411,783162,567167,3121,4768101,6841,54567,03383,75174,10088,467
Davenport, Iowa92.8%7.2%91.1%94.6%92,6247,15099,774101,0831,4927211,6573445,01247,61249,42350,351
Philadelphia, Pennsylvania92.8%7.2%91.4%94.2%1,457,523112,5791,570,1021,582,4324,7723,7506,070, 677,929779,594742,078828,024
Tacoma, Washington92.8%7.2%91.6%94.0%200,14315,490215,633220,4823,0811,1233,2797397,883102,260106,874108,759
Tuscaloosa, Alabama92.8%7.2%92.0%93.5%98,8237,659106,482107,6992,6289302,7884646,80552,01850,87155,611
Fullerton, California92.7%7.3%91.7%93.6%130,17510,265140,440141,2782,9751,1173,1786564,17366,00269,96170,479
Carolina, Puerto Rico92.6%7.4%90.6%94.3%128,24110,219138,460139,0511,3908811,6451,35456,33471,90762,20476,256
Providence, Rhode Island92.6%7.4%91.7%93.4%173,71013,910187,620190,2143,2751,3253,5326184,64289,06892,25595,365
Salem, Oregon92.6%7.4%91.2%93.9%158,58512,729171,314176,6662,6821,1262,9099677,12981,45684,58686,728
Westminster, Colorado92.6%7.4%91.0%94.1%106,4398,546114,985115,5462,4599152,6248352,62053,81957,79757,188
Detroit, Michigan92.5%7.5%90.6%94.2%584,08647,538631,624636,6444,3432,0204,790159270,801313,285299,022332,602
New Haven, Connecticut92.5%7.5%91.6%93.3%121,8109,887131,697132,8932,8009302,9517657,36864,44262,62769,070
Renton, Washington92.5%7.5%91.4%93.5%97,0207,905104,925105,2792,4798752,6297047,96849,05252,48352,442
Cincinnati, Ohio92.4%7.6%91.1%93.7%281,83923,060304,899309,5953,6761,5293,98163133,168148,671146,223158,676
Goodyear, Arizona92.4%7.6%92.7%92.2%90,1157,37997,494102,8912,6159742,7916245,06545,05048,63548,859
Lakewood, Colorado92.4%7.6%91.8%93.0%142,90111,750154,651156,3092,5539892,73815471,05071,85177,43077,221
Waterbury, Connecticut92.4%7.6%91.1%93.8%104,9298,573113,502114,3562,5239132,6833950,28754,64255,22658,276
Boise City, Idaho92.3%7.7%91.0%93.7%215,25417,860233,114235,7013,0871,2093,31654106,412108,842116,943116,171
Cleveland, Ohio92.3%7.7%90.2%94.2%334,10927,948362,057367,5233,8601,5224,14961157,378176,731174,522187,535
Colorado Springs, Colorado92.3%7.7%91.2%93.3%430,39935,929466,328483,0993,7871,7214,16079208,214222,185228,202238,126
Grand Rapids, Michigan92.3%7.7%91.0%93.6%179,47514,966194,441197,7682,9751,1423,1868886,39593,08094,98999,452
Sugar Land, Texas92.3%7.7%91.7%93.0%101,1038,394109,497109,7352,6131,0852,8296448,97552,12853,42556,072
Downey, California92.2%7.8%91.5%92.7%102,3748,716111,090111,7932,4697762,5886148,81353,56153,32257,768
Sioux Falls, South Dakota92.2%7.8%91.1%93.2%179,46915,254194,723197,6422,0141,1252,3076689,02390,44697,71897,005
Bakersfield, California92.1%7.9%90.7%93.5%374,49431,941406,435408,3664,4011,8124,76097182,391192,103201,054205,381
Shreveport, Louisiana92.1%7.9%90.7%93.3%164,47514,107178,582183,4832,2261,3102,5836075,68188,79483,45695,126
College Station, Texas91.9%8.1%91.3%92.5%112,0689,868121,936122,2802,1919302,3806657,23054,83862,65059,286
Columbia, South Carolina91.9%8.1%90.0%93.6%111,4129,772121,184138,0192,6789742,85018751,57759,83557,28663,898
Garden Grove, California91.9%8.1%91.0%92.8%156,12513,795169,920170,6032,7098992,8548577,31278,81384,95884,962
Palmdale, California91.9%8.1%90.9%92.9%151,96513,380165,345165,4873,0991,0183,2626673,94178,02481,31984,026
Tallahassee, Florida91.9%8.1%91.1%92.6%180,56715,896196,463199,6962,5061,2422,79711883,58996,97891,745104,718
Gainesville, Florida91.8%8.2%90.2%93.3%130,19911,597141,796143,6112,4451,1212,6909860,87169,32867,46274,334
Richmond, California91.8%8.2%90.0%93.4%105,1629,443114,605115,3962,5649432,7325450,91254,25056,54858,057
Sandy Springs, Georgia91.8%8.2%90.7%92.8%97,8628,756106,618107,1982,8471,0693,0414046,26851,59451,00155,617
Albuquerque, New Mexico91.7%8.3%90.4%93.0%511,40146,270557,671562,4883,3752,0753,962118246,156265,245272,320285,351
Concord, North Carolina91.7%8.3%90.6%92.8%96,5298,720105,249106,5182,1809522,3784946,00550,52450,77754,472
Dayton, Ohio91.7%8.3%90.3%93.1%122,82511,047133,872136,7412,6509142,8037059,71663,10966,11067,762
Gresham, Oregon91.7%8.3%90.4%92.9%102,8169,358112,174112,8182,6441,0502,8455850,89151,92556,28855,886
Allen, Texas91.6%8.4%91.7%91.5%98,3129,038107,350107,6842,7221,1022,9364449,07249,24053,52053,830
Corona, California91.6%8.4%91.2%91.9%144,77013,279158,049158,8392,8341,0263,0149772,06972,70178,98079,069
Enterprise, Nevada91.6%8.4%91.3%92.0%212,28119,385231,666232,0434,0831,4884,3465,278104,944107,337114,974116,692
Green Bay, Wisconsin91.6%8.4%90.2%92.9%96,7618,922105,683106,5851,8977682,0469147,11849,64352,21853,465
Jersey City, New Jersey91.6%8.4%90.7%92.5%264,54024,303288,843289,6913,4931,4183,77057132,211132,329145,825143,018
New Orleans, Louisiana91.6%8.4%88.7%94.1%340,15731,392371,549376,0352,0831,5832,616, 154,545185,612174,233197,316
Vancouver, Washington91.6%8.4%90.3%92.9%175,04316,015191,058192,6962,6221,1322,85611085,09389,95094,23096,828
Riverview, Florida91.5%8.5%90.7%92.2%97,6699,106106,775107,7763,2261,3103,4823,79446,64151,02851,43155,344
West Jordan, Utah91.5%8.5%90.6%92.4%105,8849,869115,753116,2772,4249432,6017353,70752,17759,29556,458
Akron, Ohio91.4%8.6%89.8%93.0%171,65716,100187,757189,5262,6661,1802,9157681,44190,21690,70997,048
Kent, Washington91.4%8.6%90.5%92.4%122,36911,519133,888135,0152,7169622,8817361,25961,11067,72266,166
McKinney, Texas91.4%8.6%90.6%92.1%183,32417,301200,625202,3143,4231,4393,7146590,85992,465100,261100,364
Alexandria, Virginia91.3%8.7%90.6%91.8%139,16213,339152,501156,7881,4501,1021,821, 66,09273,07072,92979,572
Las Cruces, New Mexico91.3%8.7%90.7%91.8%101,6269,696111,322112,6122,4801,0122,6798649,59352,03354,66256,660
League City, Texas91.3%8.7%91.4%91.1%104,0939,965114,058114,8852,6331,0002,81711952,20551,88857,10356,955
Newport News, Virginia91.3%8.7%89.6%92.8%159,48515,182174,667184,7741,5661,0921,909, 73,14386,34281,67592,992
San Juan, Puerto Rico91.3%8.7%89.1%93.1%289,78427,765317,549320,6912,2451,4302,6621,975128,319161,465144,070173,479
Denver, Colorado91.2%8.8%90.1%92.4%644,52862,025706,553713,7343,1362,2893,882, 320,339324,189355,688350,865
Evansville, Indiana91.2%8.8%89.4%93.0%104,21610,031114,247116,4411,6948851,9113449,80254,41455,72558,522
Everett, Washington91.2%8.8%89.7%92.8%98,6499,499108,148111,0832,4339232,6028049,47349,17655,13353,015
Joliet, Illinois91.2%8.8%89.8%92.5%134,69613,038147,734149,7852,4729442,64691465,71668,98073,14374,591
Manchester, New Hampshire91.2%8.8%90.5%91.8%103,67410,021113,695115,4152,2789972,4876150,95152,72356,27257,423
San Tan Valley, Arizona91.2%8.8%90.4%92.1%95,8989,198105,096105,2312,5721,0502,7782,93246,96948,92951,98053,116
Murfreesboro, Tennessee91.1%8.9%90.2%92.0%142,46913,868156,337157,5472,8331,3973,1585369,10373,36676,58379,754
Indianapolis city (balance), Indiana91.0%9.0%89.6%92.4%794,79478,581873,375882,0434,2562,8535,124878379,558415,236423,817449,558
Long Beach, California91.0%9.0%90.0%92.0%414,20940,969455,178458,4914,9941,7685,29771202,547211,662225,161230,017
Greensboro, North Carolina90.9%9.1%89.8%92.0%268,85326,769295,622298,5643,4921,6143,847102122,435146,418136,388159,234
Milwaukee, Wisconsin90.9%9.1%89.1%92.5%513,86751,731565,598569,7563,5291,9074,01149243,169270,698272,914292,684
Norfolk, Virginia90.9%9.1%88.2%93.3%189,28119,017208,298235,0371,7531,1812,113, 86,809102,47298,451109,847
Oceanside, California90.9%9.1%89.9%91.8%153,15515,348168,503172,5423,0291,2013,2597675,12578,03083,54684,957
South Bend, Indiana90.9%9.1%89.5%92.2%92,1069,228101,334102,8661,8137811,97461242,92549,18147,98353,351
Fontana, California90.8%9.2%90.1%91.5%192,06219,462211,524211,9213,4321,1953,6349896,37395,689106,992104,532
Stamford, Connecticut90.8%9.2%88.5%93.0%122,75212,445135,197135,8062,5811,1652,8324058,33364,41965,94869,249
Victorville, California90.8%9.2%89.9%91.7%119,39912,085131,484135,9833,3901,1483,5798058,22461,17564,74766,737
Clarksville, Tennessee90.7%9.3%88.9%92.3%144,39114,814159,205171,8972,2771,2042,5755167,16177,23075,55083,655
Ontario, California90.7%9.3%90.1%91.3%161,33716,564177,901178,3473,1211,0483,2936678,48682,85187,14690,755
Riverside, California90.7%9.3%89.5%91.8%284,79529,254314,049316,2414,0611,4984,329115139,852144,943156,218157,831
St. Louis, Missouri90.7%9.3%89.0%92.2%262,20127,004289,205293,1091,7951,4902,332, 124,079138,122139,410149,795
Fort Wayne, Indiana90.6%9.4%89.2%91.9%238,51924,852263,371266,2352,4891,3612,837395114,674123,845128,562134,809
Huntsville, Alabama90.6%9.4%89.9%91.3%194,73420,180214,914218,8142,9241,4133,2486193,727101,007104,267110,647
Provo, Utah90.6%9.4%89.8%91.3%102,85010,710113,560114,3031,8728322,0484849,96652,88455,62757,933
Lafayette, Louisiana90.5%9.5%89.0%91.8%108,51111,433119,944121,5372,4421,0762,6687551,46357,04857,81362,131
Thornton, Colorado90.5%9.5%90.2%90.9%128,82113,474142,295142,8782,5521,2062,8237764,41464,40771,45270,843
Metairie, Louisiana90.4%9.6%87.6%93.1%125,09513,312138,407138,9952,7041,1762,9493,01659,27765,81867,68170,726
Norwalk, California90.4%9.6%89.3%91.5%90,1529,54899,700100,7132,1657942,3065944,85645,29650,22049,480
Pembroke Pines, Florida90.4%9.6%89.6%91.1%153,33016,315169,645170,5573,6891,4063,9486471,86281,46880,20489,441
Aurora, Illinois90.3%9.7%89.1%91.4%161,61217,427179,039179,8672,9171,1583,13948079,27282,34088,92490,115
Hartford, Connecticut90.3%9.7%88.5%91.9%106,50311,445117,948119,9702,5119912,6995349,87756,62656,33761,611
Omaha, Nebraska90.3%9.7%89.6%91.0%435,69646,771482,467488,1972,6641,7493,18768213,588222,108238,470243,997
Sparks, Nevada90.3%9.7%90.5%90.2%98,18310,502108,685109,1062,4059512,5867550,06448,11955,33753,348
Chicago, Illinois90.2%9.8%88.9%91.4%2,420,422263,4882,683,9102,707,6489,6575,00410,876721,153,9841,266,4381,297,6441,386,266
Columbus, Ohio90.2%9.8%88.2%92.2%812,68287,901900,583906,4805,3042,8806,036134390,118422,564442,219458,364
Richmond, Virginia90.2%9.8%88.0%92.1%203,02822,135225,163227,5951,6651,3662,154, 93,427109,601106,216118,947
Norman, Oklahoma90.1%9.9%88.7%91.4%114,45012,622127,072128,7142,3701,1782,6467655,56358,88762,67364,399
South Fulton, Georgia90.1%9.9%89.4%90.8%97,99410,717108,711109,1573,6011,4593,8855144,53153,46349,83058,881
Topeka, Kansas90.1%9.9%88.6%91.5%110,81812,164122,982126,1031,6399141,8774352,25558,56358,98563,997
Anchorage, Alaska90.0%10.0%88.6%91.3%248,75627,758276,514289,0695,2731,9815,633, 122,008126,748137,629138,885
Little Rock, Arkansas90.0%10.0%88.0%91.7%180,10320,066200,169202,7393,2261,5183,5657882,72597,37894,021106,148
Los Angeles, California90.0%10.0%88.2%91.7%3,446,637383,2263,829,8633,857,89711,4435,10112,528751,679,1431,767,4941,902,7971,927,066
Tempe, Arizona90.0%10.0%89.3%90.8%167,20618,576185,782186,4193,7491,3573,9878187,86579,34198,37487,408
Raleigh, North Carolina89.9%10.1%88.2%91.6%417,76646,782464,548470,7634,9862,4435,553429198,280219,486224,825239,723
Nampa, Idaho89.8%10.2%88.4%91.2%94,53710,761105,298106,2892,2409272,4245246,05148,48652,12253,176
Broken Arrow, Oklahoma89.7%10.3%88.8%90.6%103,35111,865115,216115,9191,7586441,8728550,09753,25456,44758,769
Moreno Valley, California89.7%10.3%88.8%90.7%188,23021,596209,826210,3783,1401,2293,3726892,95695,274104,735105,091
Hesperia, California89.6%10.4%87.6%91.7%89,66810,378100,046100,1412,5931,0492,7984444,77844,89051,09548,951
Inglewood, California89.6%10.4%87.1%92.0%94,04010,910104,950105,5752,5839482,7515744,42549,61550,99253,958
Atlanta, Georgia89.5%10.5%88.2%90.7%439,86651,593491,459499,2875,7552,7616,38390208,783231,083236,697254,762
Mobile, Alabama89.5%10.5%87.8%90.9%162,85619,147182,003185,0972,7561,3333,0615274,20088,65684,48497,519
Reno, Nevada89.5%10.5%88.2%90.7%238,29428,053266,347268,9593,0351,5413,404101118,518119,776134,344132,003
Rialto, California89.5%10.5%88.4%90.5%92,54910,909103,458103,8662,3309472,5156044,91547,63450,83252,626
St. Petersburg, Florida89.5%10.5%87.8%91.0%229,63426,945256,579260,6463,5141,5293,83254107,628122,006122,526134,053
Anaheim, California89.4%10.6%88.0%90.6%306,24336,500342,743344,5534,4221,7354,750138146,956159,287166,908175,835
Costa Mesa, California89.4%10.6%88.3%90.5%98,42311,689110,112110,5382,4549842,6448349,54548,87856,13053,982
Greeley, Colorado89.4%10.6%87.8%91.0%96,35211,432107,784109,4212,1591,0242,3906247,39648,95654,00353,781
Baton Rouge, Louisiana89.3%10.7%87.4%91.0%197,85123,655221,506223,6993,7072,0254,2245891,707106,144104,918116,588
Allentown, Pennsylvania89.2%10.8%86.9%91.4%110,06913,330123,399125,3202,2791,1392,5475352,21357,85660,07063,329
Fayetteville, North Carolina89.2%10.8%87.7%90.5%160,82519,413180,238209,6921,9769582,1968771,04289,78381,03699,202
Port St. Lucie, Florida89.2%10.8%89.7%88.8%195,87423,716219,590220,4533,0031,7113,4567396,11099,764107,190112,400
San Bernardino, California89.2%10.8%87.6%90.8%192,83823,302216,140221,7743,5111,3803,7728893,46999,369106,684109,456
Elgin, Illinois89.1%10.9%88.8%89.4%100,44412,286112,730114,1062,5151,0172,71339950,57149,87356,94255,788
Pomona, California89.0%11.0%86.8%91.2%130,71516,080146,795148,3912,7391,0662,9395463,06267,65372,62874,167
Salt Lake City, Utah89.0%11.0%88.2%89.9%180,35822,321202,679203,8883,1051,4323,4207791,91788,441104,25198,428
Tampa, Florida89.0%11.0%87.6%90.3%345,90042,805388,705393,3894,5021,9834,919134170,160175,740194,169194,536
Tucson, Arizona89.0%11.0%87.4%90.5%467,95157,763525,714543,3484,3522,1404,85098223,212244,739255,322270,392
Mesa, Arizona88.9%11.1%87.7%90.1%448,60555,934504,539507,4785,2002,0705,59787220,552228,053251,442253,097
Round Rock, Texas88.9%11.1%87.9%89.9%109,97613,667123,643124,2882,9021,2153,14689853,42156,55560,75362,890
Athens-Clarke County unified government (balance), Georgia88.8%11.2%88.1%89.4%111,93414,147126,081126,9871,6111,1041,95368852,64759,28759,74366,338
Columbus, Georgia88.7%11.3%87.7%89.6%172,84921,952194,801204,3831,8641,5492,424, 79,05493,79590,142104,659
Kansas City, Missouri88.7%11.3%87.9%89.5%447,09656,892503,988508,2334,1232,1784,663121213,750233,346243,303260,685
Knoxville, Tennessee88.7%11.3%86.9%90.4%170,45121,656192,107193,7212,7571,3463,0688081,07289,37993,26698,841
Lakeland, Florida88.7%11.3%87.4%89.9%102,16113,069115,230117,0302,6381,0952,8566450,05852,10357,24757,983
Montgomery, Alabama88.7%11.3%87.6%89.7%171,52121,865193,386198,4402,0231,3562,4354077,87493,64788,935104,451
Plano, Texas88.6%11.4%87.8%89.4%253,69832,618286,316287,3393,6261,8284,06174124,423129,275141,660144,656
Augusta-Richmond County consolidated government (balance), Georgia88.5%11.5%87.2%89.6%167,97121,917189,888201,5041,9361,4412,4142076,91091,06188,238101,650
Escondido, California88.5%11.5%86.7%90.4%131,50517,041148,546149,9132,9901,2233,2308364,58666,91974,51674,030
High Point, North Carolina88.5%11.5%87.6%89.4%101,00413,064114,068115,2632,5311,0742,7496348,61752,38755,49658,572
Cape Coral, Florida88.4%11.6%86.7%90.1%181,74023,850205,590206,3873,4321,9093,9274289,25492,486102,946102,644
Durham, North Carolina88.4%11.6%86.9%89.7%253,01633,245286,261288,4652,6571,8803,255163117,446135,570135,148151,113
Wilmington, North Carolina88.4%11.6%84.8%91.5%104,09213,722117,814118,5782,3211,3232,6715346,66257,43055,03662,778
Chattanooga, Tennessee88.3%11.7%86.1%90.4%158,98920,967179,956182,8322,5971,3352,9207974,43384,55686,44193,515
Jacksonville, Florida88.3%11.7%86.6%90.0%828,413109,302937,715961,7394,5653,6165,82452388,986439,427449,301488,414
Spring Hill, Florida88.2%11.8%87.3%89.0%103,54013,853117,393118,8141,9881,0802,2632,31049,18554,35556,34061,053
Coral Springs, Florida88.1%11.9%87.1%88.9%117,75415,953133,707133,9622,9951,4453,3266455,22162,53363,36970,338
Winston-Salem, North Carolina88.1%11.9%86.1%89.8%218,81229,561248,373250,8872,7121,6703,1856899,342119,470115,315133,058
Palm Bay, Florida87.9%12.1%85.9%89.7%109,20615,046124,252125,2732,7561,2973,04610451,96857,23860,47563,777
Jurupa Valley, California87.8%12.2%86.9%88.8%92,78812,852105,640106,2442,3199632,5115445,74147,04752,64053,000
Miramar, Florida87.8%12.2%86.9%88.6%119,22616,583135,809135,9863,6791,4123,9406357,22861,99865,82269,987
Austin, Texas87.6%12.4%86.6%88.6%843,230119,482962,712967,8626,2563,9447,395373426,511416,719492,253470,459
Santa Ana, California87.6%12.4%86.6%88.6%271,10038,429309,529311,6393,6961,6564,05089137,520133,580158,824150,705
Spring Valley, Nevada87.6%12.4%86.0%89.2%192,41627,261219,677219,9133,7831,6384,1235,13995,47396,943111,008108,669
Wichita, Kansas87.6%12.4%86.6%88.6%342,37848,419390,797396,4882,9651,7593,44882167,590174,788193,456197,341
Birmingham, Alabama87.5%12.5%84.9%89.7%171,41924,564195,983199,3223,2771,4393,57964678,14593,27492,037103,946
Nashville-Davidson metropolitan government (balance), Tennessee87.4%12.6%85.5%89.2%593,15585,424678,579684,2983,6292,8554,61877280,545312,610328,103350,476
Salinas, California87.4%12.6%85.7%89.1%140,79720,262161,059161,9932,3051,2272,61110969,79371,00481,41279,647
Brandon, Florida87.1%12.9%85.6%88.4%98,80814,670113,478116,3652,7571,3003,0483,13746,72352,08554,58558,893
Charlotte, North Carolina87.1%12.9%86.0%88.2%767,919113,278881,197886,2834,7783,0525,670226365,257402,662424,543456,654
Aurora, Colorado87.0%13.0%85.4%88.6%336,43350,302386,735390,2013,6172,0774,171117165,753170,680194,047192,688
El Monte, California86.9%13.1%84.3%89.5%92,26813,952106,220107,0662,1591,0142,38511345,35646,91253,79452,426
Independence, Missouri86.9%13.1%86.1%87.7%105,02915,773120,802121,9442,4541,3452,7997450,87254,15759,07361,729
North Las Vegas, Nevada86.9%13.1%86.3%87.5%231,56034,880266,440270,7733,9841,7744,36164111,802119,758129,595136,845
Richardson, Texas86.9%13.1%87.0%86.8%102,30915,434117,743118,2692,7681,4353,1179149,03953,27056,34461,399
Glendale, Arizona86.8%13.2%86.5%87.1%214,49832,517247,015250,1933,8321,6964,19186103,971110,527120,178126,837
Las Vegas, Nevada86.8%13.2%85.5%88.1%556,98484,624641,608650,8735,3002,7255,960108272,452284,532318,802322,806
Davie, Florida86.7%13.3%85.8%87.5%92,01114,148106,159106,4122,6851,3533,0066245,21346,79852,67553,484
Lubbock, Texas86.5%13.5%85.6%87.3%222,98034,806257,786261,0782,4631,6822,98249108,149114,831126,297131,489
Macon-Bibb County, Georgia86.4%13.6%84.5%88.1%132,32120,810153,131156,5431,4721,2911,958, 60,26672,05571,34481,787
Savannah, Georgia86.2%13.8%84.4%87.7%122,09119,496141,587147,5462,5851,2362,8658554,04968,04264,03877,549
Orlando, Florida86.1%13.9%85.0%87.2%266,32842,985309,313311,7325,1182,5865,734141129,557136,771152,391156,922
Oklahoma City, Oklahoma86.0%14.0%84.5%87.4%582,74494,705677,449688,6934,2682,6175,006148280,822301,922332,146345,303
Clearwater, Florida85.9%14.1%83.6%88.2%99,18216,216115,398117,0752,6151,3182,9285847,64951,53356,97758,421
Fort Lauderdale, Florida85.9%14.1%85.0%86.9%155,54425,504181,048183,0323,6441,7434,0405680,19375,35194,36486,684
Springfield, Missouri85.9%14.1%83.9%87.9%142,90523,386166,291169,4322,3221,3272,6759267,65175,25480,65985,632
Bridgeport, Connecticut85.6%14.4%83.1%88.0%125,58921,077146,666148,0122,4111,2932,73610059,19666,39371,21475,452
Phoenix, Arizona85.5%14.5%84.4%86.6%1,378,353233,6371,611,9901,624,8328,4904,5459,630112679,903698,450805,390806,600
Waco, Texas85.5%14.5%84.9%86.0%118,84820,211139,059141,9252,3321,3492,69413756,40362,44566,41372,646
Jackson, Mississippi85.4%14.6%83.1%87.3%126,67821,729148,407149,8272,0791,3522,4807056,34970,32967,83180,576
Paradise, Nevada85.4%14.6%84.6%86.2%158,41327,112185,525186,1783,4221,4973,7364,60179,70878,70594,18991,336
Memphis, Tennessee85.2%14.8%82.5%87.6%528,04191,917619,958629,0634,8372,9615,67184240,942287,099292,037327,921
Midland, Texas85.2%14.8%85.8%84.7%113,29019,606132,896133,9982,5071,5892,9684758,16655,12467,77865,118
West Palm Beach, Florida85.2%14.8%81.9%88.5%100,50917,427117,936119,5082,9651,4383,29611747,82452,68558,37259,564
Oxnard, California85.0%15.0%82.9%87.1%169,74629,960199,706201,0142,6511,4963,0446283,16586,581100,35099,356
Abilene, Texas84.9%15.1%83.4%86.1%97,60617,408115,014127,1301,7031,0892,02126245,35952,24754,36060,654
Denton, Texas84.8%15.2%83.3%86.3%123,15822,081145,239146,9873,0711,5573,4436859,60963,54971,58873,651
East Los Angeles, California84.7%15.3%83.3%86.2%96,96517,505114,470114,6172,4121,1192,6593,05848,36748,59858,09156,379
Carrollton, Texas84.6%15.4%83.5%85.5%111,70020,410132,110132,7412,6801,3362,99417054,81856,88265,61666,494
Santa Maria, California84.5%15.5%82.3%86.6%92,19816,969109,167109,8802,2001,1742,4944844,76247,43654,41754,750
Hialeah, Florida84.3%15.7%80.8%87.7%186,27434,571220,845221,9013,5701,7983,9986786,63199,643107,261113,584
Killeen, Texas84.3%15.7%83.0%85.4%121,93922,763144,702156,1442,6561,6493,1276056,99064,94968,63076,072
Amarillo, Texas84.2%15.8%82.7%85.6%167,56831,486199,054200,9452,2931,5402,7624381,03686,53297,937101,117
Lewisville, Texas83.9%16.1%83.2%84.6%107,29020,526127,816128,3132,6731,3302,98547051,56355,72761,96865,848
Wichita Falls, Texas83.6%16.4%82.6%84.7%76,37114,92891,299102,5581,4311,0261,7613936,30040,07143,97047,329
Tulsa, Oklahoma83.5%16.5%81.9%85.0%340,75767,316408,073412,3222,5011,3992,866129163,076177,681199,106208,967
Hollywood, Florida83.3%16.7%81.3%85.3%126,33525,383151,718152,9353,0251,8053,5236062,55563,78076,92374,795
North Charleston, South Carolina83.2%16.8%80.6%85.6%93,31118,904112,215117,4602,7201,4523,0838044,00349,30854,58457,631
San Antonio, Texas82.5%17.5%80.6%84.2%1,183,490251,8861,435,3761,458,9547,4304,9108,905118569,651613,839706,578728,798
Miami, Florida82.4%17.6%79.8%85.0%363,35377,600440,953446,6635,5712,8936,27777177,475185,878222,383218,570
Corpus Christi, Texas82.2%17.8%80.7%83.7%256,10955,387311,496317,3832,6902,0163,36178124,043132,066153,791157,705
Odessa, Texas82.2%17.8%82.6%81.8%92,70420,064112,768114,0802,4521,4542,8514946,99845,70656,88655,882
Tyler, Texas82.2%17.8%81.3%83.1%86,79818,795105,593107,7182,1361,2372,4696341,07345,72550,54655,047
Lehigh Acres, Florida82.1%17.9%79.7%84.5%104,51022,725127,235127,3912,6241,4883,0173,33949,35655,15461,94065,295
West Valley City, Utah82.1%17.9%81.0%83.2%112,87324,575137,448137,9552,8361,4513,1865556,45556,41869,65667,792
Sunrise Manor, Nevada81.9%18.1%80.7%83.1%162,76735,939198,706199,0993,2681,7483,7063,94078,62784,14097,464101,242
Grand Prairie, Texas81.6%18.4%80.5%82.8%161,70936,380198,089198,5643,5711,9504,0699278,20883,50197,212100,877
Kansas City, Kansas81.6%18.4%79.9%83.3%125,38828,237153,625154,7761,5601,2011,9692661,52363,86576,97576,650
Fort Worth, Texas81.4%18.6%80.4%82.4%756,882172,533929,415941,3117,0224,3118,240527364,941391,941453,985475,430
Arlington, Texas81.3%18.7%80.0%82.4%319,61973,748393,367394,7694,6412,7885,414103154,757164,862193,396199,971
Newark, New Jersey80.9%19.1%78.3%83.4%242,60657,137299,743307,1883,8882,2644,49949113,628128,978145,177154,566
Paterson, New Jersey80.9%19.1%77.5%84.2%126,89129,942156,833157,6602,3431,5592,81413759,71667,17577,02279,811
Miami Gardens, Florida80.6%19.4%79.0%82.2%89,62621,529111,155111,2642,6271,5253,03711142,87546,75154,29956,856
El Paso, Texas79.0%21.0%78.2%79.9%523,617138,812662,429678,1474,7213,4405,841153250,758272,859320,741341,688
Pompano Beach, Florida78.9%21.1%75.8%82.4%86,38123,045109,426112,2122,6671,6683,1468043,38342,99857,23052,196
Mesquite, Texas78.6%21.4%77.0%80.0%116,50631,770148,276148,8483,3371,9083,84447354,52361,98370,81477,462
Beaumont, Texas78.5%21.5%77.3%79.7%88,27624,150112,426113,7102,1601,4382,5956342,60745,66955,10757,319
Irving, Texas78.4%21.6%77.8%79.0%199,36054,998254,358255,0363,6802,3074,34357100,52498,836129,232125,126
Elizabeth, New Jersey77.1%22.9%74.4%79.8%104,03430,925134,959135,8872,3651,6762,8997950,30153,73367,63667,323
Dallas, Texas77.0%23.0%75.0%79.0%993,057296,8031,289,8601,299,5537,9805,2629,559141480,169512,888640,337649,523
Houston, Texas76.0%24.0%73.9%78.1%1,734,218547,5132,281,7312,300,41910,7377,54113,121172831,061903,1571,125,0681,156,663
Edinburg, Texas74.3%25.7%74.6%74.1%73,21325,28398,496102,5612,9242,0183,5535135,66537,54847,80550,691
Garland, Texas74.2%25.8%72.8%75.6%181,58463,125244,709245,2983,9932,8534,90814588,19193,393121,138123,571
McAllen, Texas74.2%25.8%73.8%74.5%105,93236,888142,820143,7892,7921,9913,4305652,17053,76270,68272,138
Pasadena, Texas72.0%28.0%71.3%72.6%106,82541,592148,417149,3452,9171,9783,5245952,04754,77872,98075,437
Laredo, Texas71.6%28.4%72.2%71.0%182,07472,184254,258255,9492,5322,2513,3884190,75091,324125,609128,649
Brownsville, Texas71.4%28.6%70.9%71.8%133,30453,428186,732188,0232,7701,9513,3899063,71569,58989,85396,879

Image files

Download all

Figure 2

Insured share, all published cities

Figure 2: Insured share, all published cities
DownloadPDFImageCSV

Figure 3

Male insured share, all published cities

Figure 3: Male insured share, all published cities
DownloadPDFImageCSV

Figure 4

Female insured share, all published cities

Figure 4: Female insured share, all published cities
DownloadPDFImageCSV

Figure 5

Male against female insured share

Figure 5: Male against female insured share
DownloadPDFImageCSV

About this data

  • A city is included when the ACS published at least 100,000 residents in the 2023 five-year estimates (table B01003). Smaller places are left out.
  • Health insurance coverage status comes from ACS detailed table B27001 (Health Insurance Coverage Status by Sex by Age) for the civilian noninstitutionalized population.
  • Insured and uninsured counts are the sums of the age-by-sex leaf cells in B27001. Male and female shares use the male and female leaf cells only. Shares are those counts divided by the matching coverage universe for each city.
  • A city coverage rate is that city's own share, so the city rates cannot be averaged to produce a United States figure.
  • ACS special values such as -555555555 on a margin of error mean the estimate is controlled and has no sampling MOE; those cells are stored as blank.
  • The map covers the 48 contiguous states. Cities in Alaska, Hawaii and Puerto Rico stay in the ranking and table.
  • Place names drop a trailing city, town, village, CDP, municipality or zona urbana so the plugin city map can join them. Consolidated and metro government (balance) labels are kept as Census published them.