Health insurance by US state

Summary

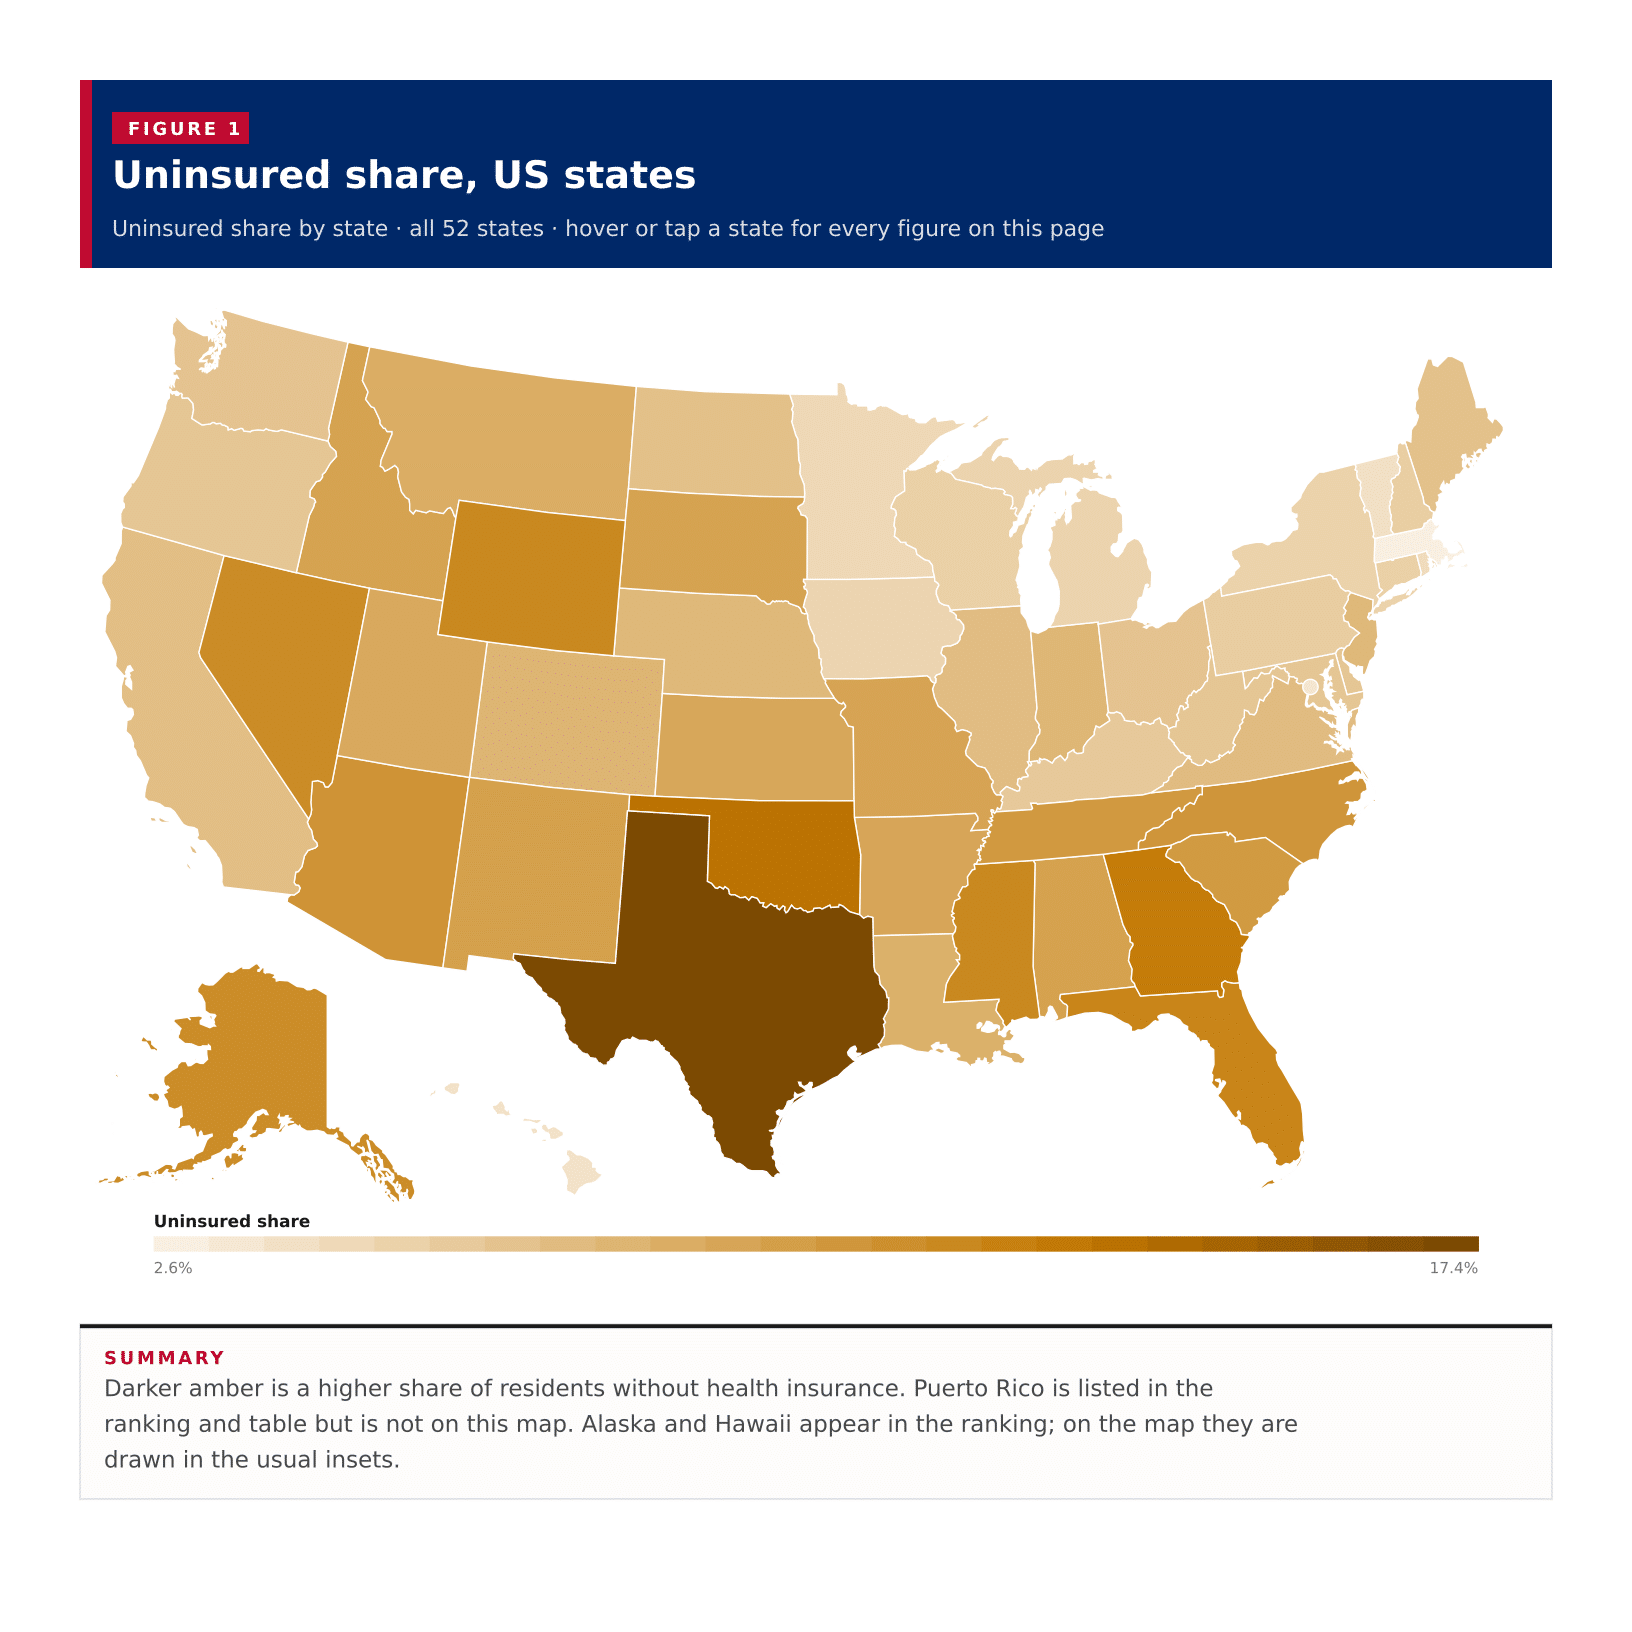
Uninsured share, US states

Uninsured share by state · all 52 states · hover or tap a state for every figure on this page

52 items
View100%
DownloadPDFImageCSV
StatesTexas
Uninsured share, US statesDarker amber is a higher share of residents without health insurance. Puerto Rico is listed in the ranking and table but is not on this map. Alaska and Hawaii appear in the ranking; on the map they are drawn in the usual insets.Alabama · Civilian noninstitutionalized population: 4,969,866 · Population margin of error: 971 · With health insurance: 4,502,444 · Insured margin of error: 8,460 · No health insurance: 467,422 · Uninsured margin of error: 6,259 · Insured share: 90.6% · Uninsured share: 9.4%Alaska · Civilian noninstitutionalized population: 704,133 · Population margin of error: 1,934 · With health insurance: 625,240 · Insured margin of error: 3,498 · No health insurance: 78,893 · Uninsured margin of error: 2,083 · Insured share: 88.8% · Uninsured share: 11.2%Arizona · Civilian noninstitutionalized population: 7,154,961 · Population margin of error: 1,212 · With health insurance: 6,394,964 · Insured margin of error: 9,668 · No health insurance: 759,997 · Uninsured margin of error: 7,737 · Insured share: 89.4% · Uninsured share: 10.6%Arkansas · Civilian noninstitutionalized population: 2,977,706 · Population margin of error: 755 · With health insurance: 2,709,989 · Insured margin of error: 6,145 · No health insurance: 267,717 · Uninsured margin of error: 4,615 · Insured share: 91.0% · Uninsured share: 9.0%California · Civilian noninstitutionalized population: 38,761,738 · Population margin of error: 3,244 · With health insurance: 36,079,006 · Insured margin of error: 19,875 · No health insurance: 2,682,732 · Uninsured margin of error: 14,900 · Insured share: 93.1% · Uninsured share: 6.9%Colorado · Civilian noninstitutionalized population: 5,713,803 · Population margin of error: 1,552 · With health insurance: 5,274,083 · Insured margin of error: 8,298 · No health insurance: 439,720 · Uninsured margin of error: 6,162 · Insured share: 92.3% · Uninsured share: 7.7%Connecticut · Civilian noninstitutionalized population: 3,555,703 · Population margin of error: 718 · With health insurance: 3,367,143 · Insured margin of error: 5,761 · No health insurance: 188,560 · Uninsured margin of error: 4,168 · Insured share: 94.7% · Uninsured share: 5.3%Delaware · Civilian noninstitutionalized population: 992,298 · Population margin of error: 677 · With health insurance: 930,621 · Insured margin of error: 3,048 · No health insurance: 61,677 · Uninsured margin of error: 2,377 · Insured share: 93.8% · Uninsured share: 6.2%Florida · Civilian noninstitutionalized population: 21,591,588 · Population margin of error: 2,889 · With health insurance: 19,021,878 · Insured margin of error: 19,655 · No health insurance: 2,569,710 · Uninsured margin of error: 17,154 · Insured share: 88.1% · Uninsured share: 11.9%Georgia · Civilian noninstitutionalized population: 10,627,519 · Population margin of error: 1,963 · With health insurance: 9,288,560 · Insured margin of error: 14,358 · No health insurance: 1,338,959 · Uninsured margin of error: 11,537 · Insured share: 87.4% · Uninsured share: 12.6%Hawaii · Civilian noninstitutionalized population: 1,386,108 · Population margin of error: 1,240 · With health insurance: 1,334,667 · Insured margin of error: 3,069 · No health insurance: 51,441 · Uninsured margin of error: 1,867 · Insured share: 96.3% · Uninsured share: 3.7%Idaho · Civilian noninstitutionalized population: 1,866,785 · Population margin of error: 530 · With health insurance: 1,693,438 · Insured margin of error: 5,066 · No health insurance: 173,347 · Uninsured margin of error: 3,618 · Insured share: 90.7% · Uninsured share: 9.3%Illinois · Civilian noninstitutionalized population: 12,522,498 · Population margin of error: 1,034 · With health insurance: 11,651,895 · Insured margin of error: 11,097 · No health insurance: 870,603 · Uninsured margin of error: 8,556 · Insured share: 93.0% · Uninsured share: 7.0%Indiana · Civilian noninstitutionalized population: 6,714,911 · Population margin of error: 753 · With health insurance: 6,206,576 · Insured margin of error: 8,575 · No health insurance: 508,335 · Uninsured margin of error: 6,321 · Insured share: 92.4% · Uninsured share: 7.6%Iowa · Civilian noninstitutionalized population: 3,149,616 · Population margin of error: 467 · With health insurance: 2,996,553 · Insured margin of error: 4,637 · No health insurance: 153,063 · Uninsured margin of error: 3,003 · Insured share: 95.1% · Uninsured share: 4.9%Kansas · Civilian noninstitutionalized population: 2,875,799 · Population margin of error: 1,003 · With health insurance: 2,620,949 · Insured margin of error: 5,603 · No health insurance: 254,850 · Uninsured margin of error: 3,934 · Insured share: 91.1% · Uninsured share: 8.9%Kentucky · Civilian noninstitutionalized population: 4,429,333 · Population margin of error: 712 · With health insurance: 4,168,419 · Insured margin of error: 6,530 · No health insurance: 260,914 · Uninsured margin of error: 4,317 · Insured share: 94.1% · Uninsured share: 5.9%Louisiana · Civilian noninstitutionalized population: 4,523,071 · Population margin of error: 1,047 · With health insurance: 4,157,196 · Insured margin of error: 8,447 · No health insurance: 365,875 · Uninsured margin of error: 6,178 · Insured share: 91.9% · Uninsured share: 8.1%Maine · Civilian noninstitutionalized population: 1,359,807 · Population margin of error: 336 · With health insurance: 1,269,445 · Insured margin of error: 3,431 · No health insurance: 90,362 · Uninsured margin of error: 2,287 · Insured share: 93.4% · Uninsured share: 6.6%Maryland · Civilian noninstitutionalized population: 6,079,418 · Population margin of error: 1,477 · With health insurance: 5,704,097 · Insured margin of error: 7,735 · No health insurance: 375,321 · Uninsured margin of error: 5,585 · Insured share: 93.8% · Uninsured share: 6.2%Massachusetts · Civilian noninstitutionalized population: 6,926,890 · Population margin of error: 600 · With health insurance: 6,743,422 · Insured margin of error: 7,169 · No health insurance: 183,468 · Uninsured margin of error: 4,101 · Insured share: 97.4% · Uninsured share: 2.6%Michigan · Civilian noninstitutionalized population: 9,944,298 · Population margin of error: 562 · With health insurance: 9,445,063 · Insured margin of error: 8,721 · No health insurance: 499,235 · Uninsured margin of error: 5,768 · Insured share: 95.0% · Uninsured share: 5.0%Minnesota · Civilian noninstitutionalized population: 5,652,888 · Population margin of error: 617 · With health insurance: 5,392,634 · Insured margin of error: 6,094 · No health insurance: 260,254 · Uninsured margin of error: 4,108 · Insured share: 95.4% · Uninsured share: 4.6%Mississippi · Civilian noninstitutionalized population: 2,884,445 · Population margin of error: 1,001 · With health insurance: 2,549,529 · Insured margin of error: 6,956 · No health insurance: 334,916 · Uninsured margin of error: 5,069 · Insured share: 88.4% · Uninsured share: 11.6%Missouri · Civilian noninstitutionalized population: 6,062,789 · Population margin of error: 972 · With health insurance: 5,506,609 · Insured margin of error: 8,115 · No health insurance: 556,180 · Uninsured margin of error: 6,555 · Insured share: 90.8% · Uninsured share: 9.2%Montana · Civilian noninstitutionalized population: 1,088,176 · Population margin of error: 351 · With health insurance: 996,355 · Insured margin of error: 3,255 · No health insurance: 91,821 · Uninsured margin of error: 2,336 · Insured share: 91.6% · Uninsured share: 8.4%Nebraska · Civilian noninstitutionalized population: 1,937,542 · Population margin of error: 526 · With health insurance: 1,793,644 · Insured margin of error: 3,807 · No health insurance: 143,898 · Uninsured margin of error: 2,801 · Insured share: 92.6% · Uninsured share: 7.4%Nevada · Civilian noninstitutionalized population: 3,103,042 · Population margin of error: 1,002 · With health insurance: 2,751,977 · Insured margin of error: 6,537 · No health insurance: 351,065 · Uninsured margin of error: 5,491 · Insured share: 88.7% · Uninsured share: 11.3%New Hampshire · Civilian noninstitutionalized population: 1,371,503 · Population margin of error: 406 · With health insurance: 1,295,633 · Insured margin of error: 3,295 · No health insurance: 75,870 · Uninsured margin of error: 2,425 · Insured share: 94.5% · Uninsured share: 5.5%New Jersey · Civilian noninstitutionalized population: 9,174,408 · Population margin of error: 1,011 · With health insurance: 8,492,142 · Insured margin of error: 9,443 · No health insurance: 682,266 · Uninsured margin of error: 7,568 · Insured share: 92.6% · Uninsured share: 7.4%New Mexico · Civilian noninstitutionalized population: 2,077,871 · Population margin of error: 868 · With health insurance: 1,880,950 · Insured margin of error: 5,473 · No health insurance: 196,921 · Uninsured margin of error: 4,241 · Insured share: 90.5% · Uninsured share: 9.5%New York · Civilian noninstitutionalized population: 19,674,246 · Population margin of error: 1,225 · With health insurance: 18,672,073 · Insured margin of error: 13,507 · No health insurance: 1,002,173 · Uninsured margin of error: 9,542 · Insured share: 94.9% · Uninsured share: 5.1%North Carolina · Civilian noninstitutionalized population: 10,366,704 · Population margin of error: 2,441 · With health insurance: 9,292,781 · Insured margin of error: 12,074 · No health insurance: 1,073,923 · Uninsured margin of error: 9,455 · Insured share: 89.6% · Uninsured share: 10.4%North Dakota · Civilian noninstitutionalized population: 761,569 · Population margin of error: 628 · With health insurance: 710,591 · Insured margin of error: 2,950 · No health insurance: 50,978 · Uninsured margin of error: 1,938 · Insured share: 93.3% · Uninsured share: 6.7%Ohio · Civilian noninstitutionalized population: 11,612,784 · Population margin of error: 927 · With health insurance: 10,873,657 · Insured margin of error: 11,088 · No health insurance: 739,127 · Uninsured margin of error: 7,809 · Insured share: 93.6% · Uninsured share: 6.4%Oklahoma · Civilian noninstitutionalized population: 3,906,785 · Population margin of error: 1,020 · With health insurance: 3,381,417 · Insured margin of error: 5,853 · No health insurance: 525,368 · Uninsured margin of error: 4,584 · Insured share: 86.6% · Uninsured share: 13.4%Oregon · Civilian noninstitutionalized population: 4,196,946 · Population margin of error: 703 · With health insurance: 3,935,623 · Insured margin of error: 6,293 · No health insurance: 261,323 · Uninsured margin of error: 4,403 · Insured share: 93.8% · Uninsured share: 6.2%Pennsylvania · Civilian noninstitutionalized population: 12,800,535 · Population margin of error: 906 · With health insurance: 12,085,040 · Insured margin of error: 10,264 · No health insurance: 715,495 · Uninsured margin of error: 7,746 · Insured share: 94.4% · Uninsured share: 5.6%Rhode Island · Civilian noninstitutionalized population: 1,078,696 · Population margin of error: 459 · With health insurance: 1,031,803 · Insured margin of error: 3,336 · No health insurance: 46,893 · Uninsured margin of error: 2,180 · Insured share: 95.7% · Uninsured share: 4.3%South Carolina · Civilian noninstitutionalized population: 5,113,158 · Population margin of error: 1,698 · With health insurance: 4,602,401 · Insured margin of error: 8,713 · No health insurance: 510,757 · Uninsured margin of error: 6,822 · Insured share: 90.0% · Uninsured share: 10.0%South Dakota · Civilian noninstitutionalized population: 879,723 · Population margin of error: 421 · With health insurance: 798,136 · Insured margin of error: 2,972 · No health insurance: 81,587 · Uninsured margin of error: 2,032 · Insured share: 90.7% · Uninsured share: 9.3%Tennessee · Civilian noninstitutionalized population: 6,888,125 · Population margin of error: 1,234 · With health insurance: 6,192,106 · Insured margin of error: 9,692 · No health insurance: 696,019 · Uninsured margin of error: 7,625 · Insured share: 89.9% · Uninsured share: 10.1%Texas · Civilian noninstitutionalized population: 29,157,945 · Population margin of error: 2,821 · With health insurance: 24,096,694 · Insured margin of error: 26,665 · No health insurance: 5,061,251 · Uninsured margin of error: 23,024 · Insured share: 82.6% · Uninsured share: 17.4%Utah · Civilian noninstitutionalized population: 3,304,468 · Population margin of error: 814 · With health insurance: 3,018,624 · Insured margin of error: 6,141 · No health insurance: 285,844 · Uninsured margin of error: 4,683 · Insured share: 91.3% · Uninsured share: 8.7%Vermont · Civilian noninstitutionalized population: 639,109 · Population margin of error: 287 · With health insurance: 613,866 · Insured margin of error: 2,095 · No health insurance: 25,243 · Uninsured margin of error: 1,154 · Insured share: 96.1% · Uninsured share: 3.9%Virginia · Civilian noninstitutionalized population: 8,429,141 · Population margin of error: 2,675 · With health insurance: 7,831,367 · Insured margin of error: 10,281 · No health insurance: 597,774 · Uninsured margin of error: 7,111 · Insured share: 92.9% · Uninsured share: 7.1%Washington · Civilian noninstitutionalized population: 7,623,297 · Population margin of error: 1,796 · With health insurance: 7,138,620 · Insured margin of error: 8,504 · No health insurance: 484,677 · Uninsured margin of error: 6,270 · Insured share: 93.6% · Uninsured share: 6.4%West Virginia · Civilian noninstitutionalized population: 1,750,730 · Population margin of error: 415 · With health insurance: 1,642,273 · Insured margin of error: 4,145 · No health insurance: 108,457 · Uninsured margin of error: 2,812 · Insured share: 93.8% · Uninsured share: 6.2%Wisconsin · Civilian noninstitutionalized population: 5,828,067 · Population margin of error: 403 · With health insurance: 5,518,182 · Insured margin of error: 6,160 · No health insurance: 309,885 · Uninsured margin of error: 4,072 · Insured share: 94.7% · Uninsured share: 5.3%Wyoming · Civilian noninstitutionalized population: 569,723 · Population margin of error: 457 · With health insurance: 503,648 · Insured margin of error: 2,729 · No health insurance: 66,075 · Uninsured margin of error: 2,039 · Insured share: 88.4% · Uninsured share: 11.6%District of Columbia · Civilian noninstitutionalized population: 663,014 · Population margin of error: 407 · With health insurance: 640,379 · Insured margin of error: 2,692 · No health insurance: 22,635 · Uninsured margin of error: 1,652 · Insured share: 96.6% · Uninsured share: 3.4%District of Columbia · Civilian noninstitutionalized population: 663,014 · Population margin of error: 407 · With health insurance: 640,379 · Insured margin of error: 2,692 · No health insurance: 22,635 · Uninsured margin of error: 1,652 · Insured share: 96.6% · Uninsured share: 3.4%Uninsured share2.6%17.4%
Summary

Darker amber is a higher share of residents without health insurance. Puerto Rico is listed in the ranking and table but is not on this map. Alaska and Hawaii appear in the ranking; on the map they are drawn in the usual insets.

Among the 50 states, the District of Columbia and Puerto Rico on the 2023 ACS five-year estimates, a typical published area has 7.3% of residents without health insurance, the midpoint of the 52 areas. Texas has the highest uninsured share at 17.4%, and Massachusetts has the lowest at 2.6%. 12 published areas sit at or above 10% uninsured, while 7 sit below 5%. These are each area's own coverage rates for the civilian noninstitutionalized population, not a national average of state rates.
In short

7.3%typical published areamidpoint uninsured share, not an average
17.4%Texashighest uninsured share
2.6%Massachusettslowest uninsured share
12areas at or above 10% uninsuredof 52 published areas
92.8%typical insured sharemidpoint of the 52 published insured rates
Figure 1

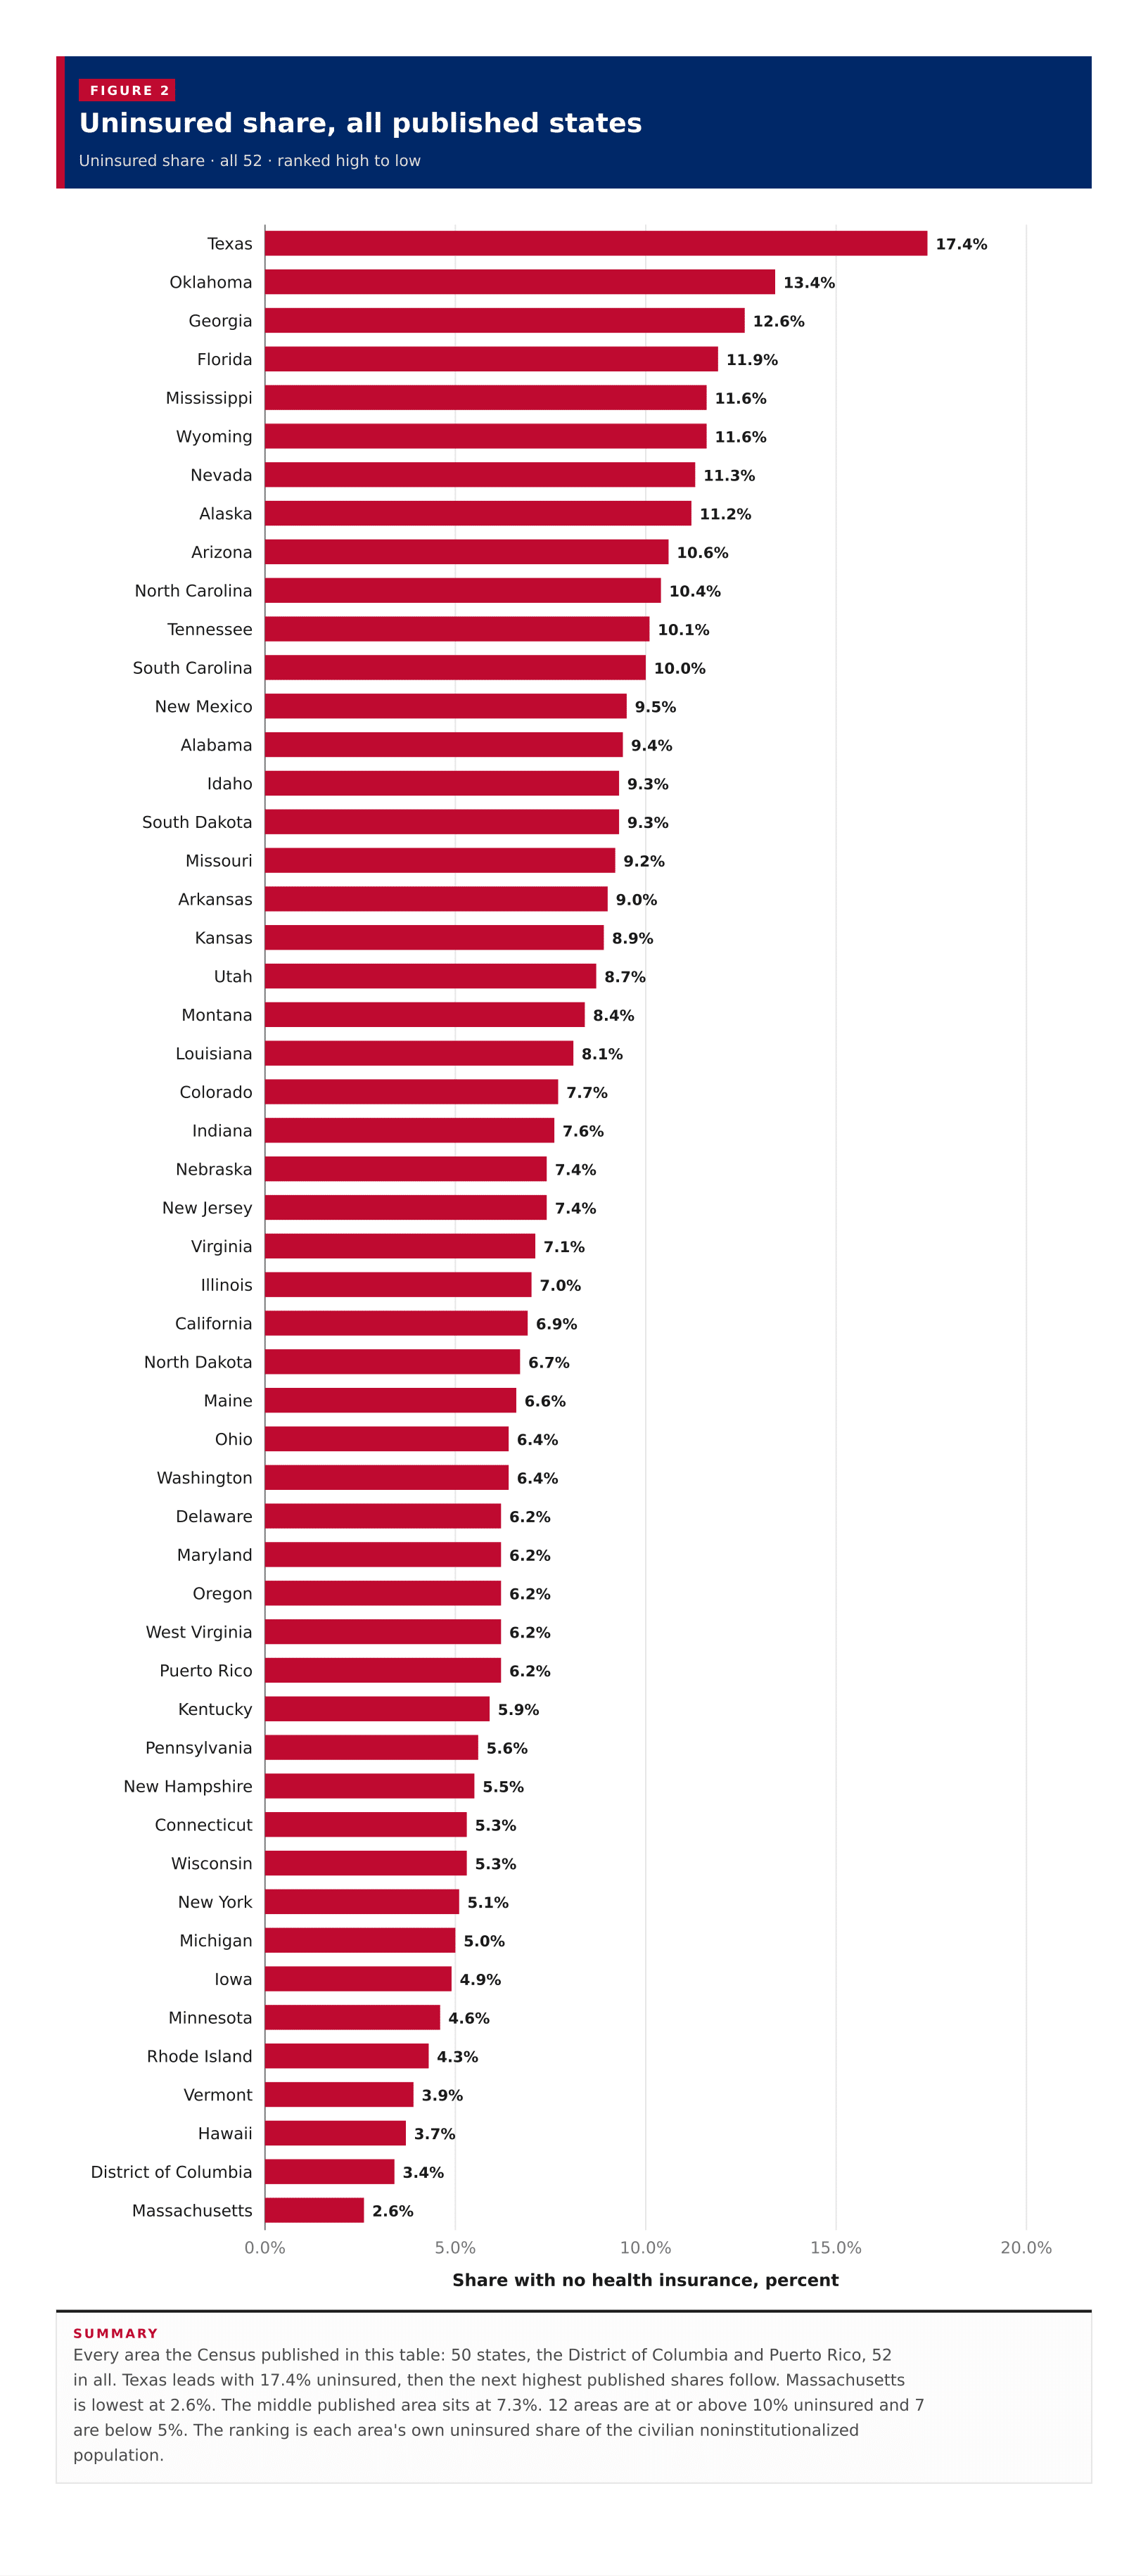
Uninsured share, all published states

Uninsured share · all 52 · ranked high to low

52 items
View100%
DownloadPDFImageCSV
Uninsured share, all published statesEvery area the Census published in this table: 50 states, the District of Columbia and Puerto Rico, 52 in all. Texas leads with 17.4% uninsured, then the next highest published shares follow. Massachusetts is lowest at 2.6%. The middle published area sits at 7.3%. 12 areas are at or above 10% uninsured and 7 are below 5%. The ranking is each area's own uninsured share of the civilian noninstitutionalized population.0.0%5.0%10.0%15.0%20.0%Share with no health insurance, percent17.4%Texas13.4%Oklahoma12.6%Georgia11.9%Florida11.6%Mississippi11.6%Wyoming11.3%Nevada11.2%Alaska10.6%Arizona10.4%North Carolina10.1%Tennessee10.0%South Carolina9.5%New Mexico9.4%Alabama9.3%Idaho9.3%South Dakota9.2%Missouri9.0%Arkansas8.9%Kansas8.7%Utah8.4%Montana8.1%Louisiana7.7%Colorado7.6%Indiana7.4%Nebraska7.4%New Jersey7.1%Virginia7.0%Illinois6.9%California6.7%North Dakota6.6%Maine6.4%Ohio6.4%Washington6.2%Delaware6.2%Maryland6.2%Oregon6.2%West Virginia6.2%Puerto Rico5.9%Kentucky5.6%Pennsylvania5.5%New Hampshire5.3%Connecticut5.3%Wisconsin5.1%New York5.0%Michigan4.9%Iowa4.6%Minnesota4.3%Rhode Island3.9%Vermont3.7%Hawaii3.4%District of Columbia2.6%Massachusetts
Summary

Every area the Census published in this table: 50 states, the District of Columbia and Puerto Rico, 52 in all. Texas leads with 17.4% uninsured, then the next highest published shares follow. Massachusetts is lowest at 2.6%. The middle published area sits at 7.3%. 12 areas are at or above 10% uninsured and 7 are below 5%. The ranking is each area's own uninsured share of the civilian noninstitutionalized population.

Figure 2

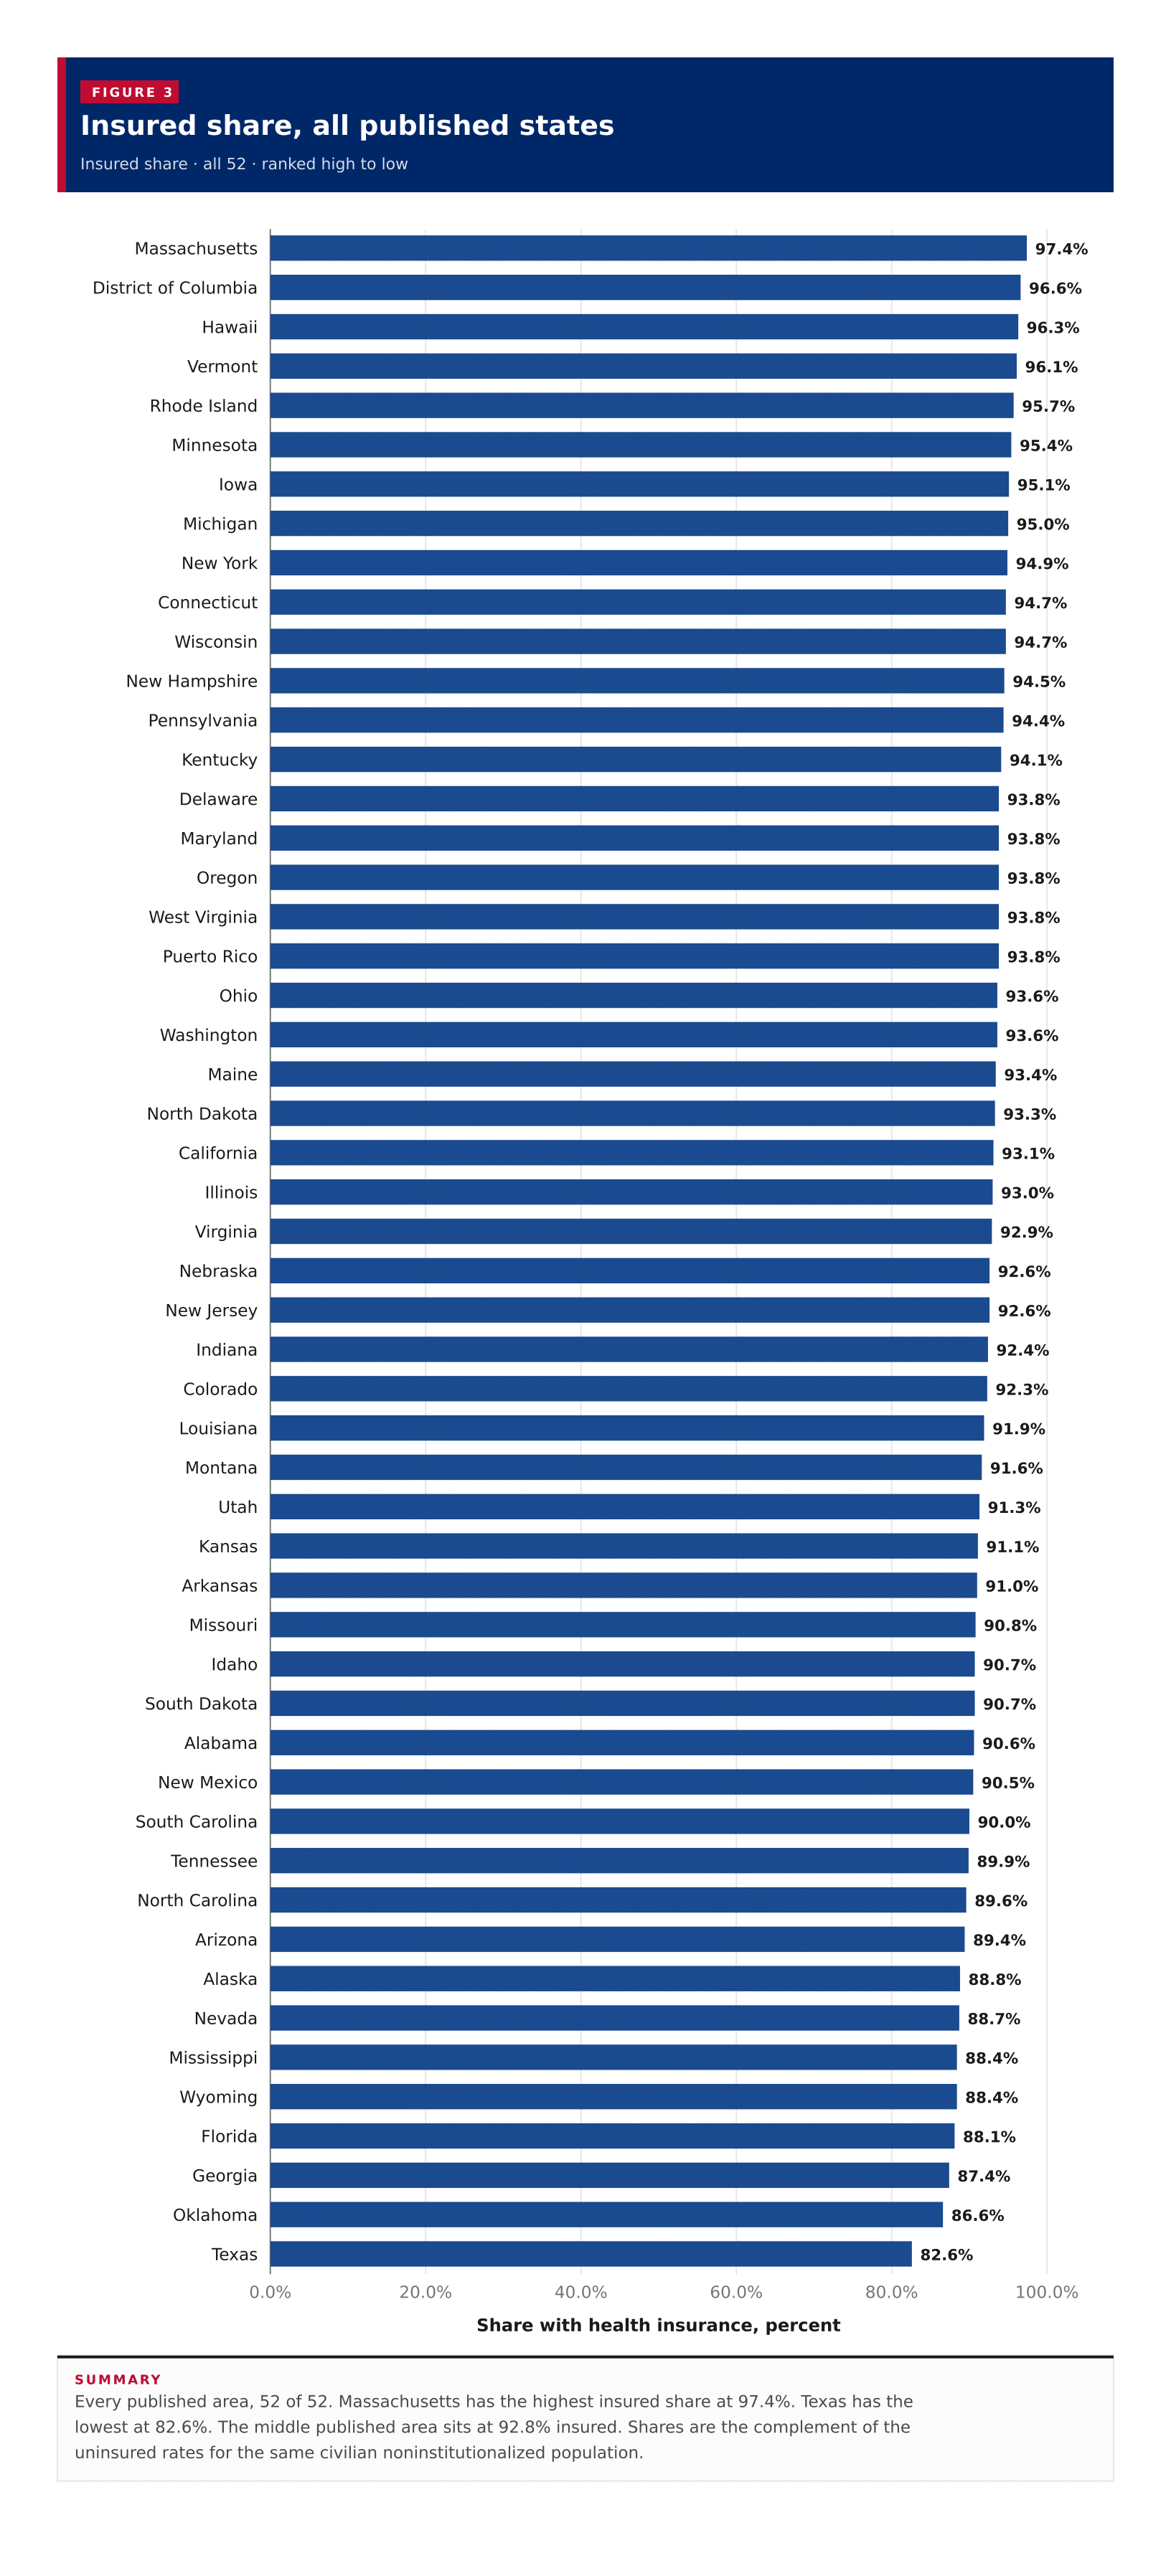
Insured share, all published states

Insured share · all 52 · ranked high to low

52 items
View100%
DownloadPDFImageCSV
Insured share, all published statesEvery published area, 52 of 52. Massachusetts has the highest insured share at 97.4%. Texas has the lowest at 82.6%. The middle published area sits at 92.8% insured. Shares are the complement of the uninsured rates for the same civilian noninstitutionalized population.0.0%20.0%40.0%60.0%80.0%100.0%Share with health insurance, percent97.4%Massachusetts96.6%District of Columbia96.3%Hawaii96.1%Vermont95.7%Rhode Island95.4%Minnesota95.1%Iowa95.0%Michigan94.9%New York94.7%Connecticut94.7%Wisconsin94.5%New Hampshire94.4%Pennsylvania94.1%Kentucky93.8%Delaware93.8%Maryland93.8%Oregon93.8%West Virginia93.8%Puerto Rico93.6%Ohio93.6%Washington93.4%Maine93.3%North Dakota93.1%California93.0%Illinois92.9%Virginia92.6%Nebraska92.6%New Jersey92.4%Indiana92.3%Colorado91.9%Louisiana91.6%Montana91.3%Utah91.1%Kansas91.0%Arkansas90.8%Missouri90.7%Idaho90.7%South Dakota90.6%Alabama90.5%New Mexico90.0%South Carolina89.9%Tennessee89.6%North Carolina89.4%Arizona88.8%Alaska88.7%Nevada88.4%Mississippi88.4%Wyoming88.1%Florida87.4%Georgia86.6%Oklahoma82.6%Texas
Summary

Every published area, 52 of 52. Massachusetts has the highest insured share at 97.4%. Texas has the lowest at 82.6%. The middle published area sits at 92.8% insured. Shares are the complement of the uninsured rates for the same civilian noninstitutionalized population.

Table 1

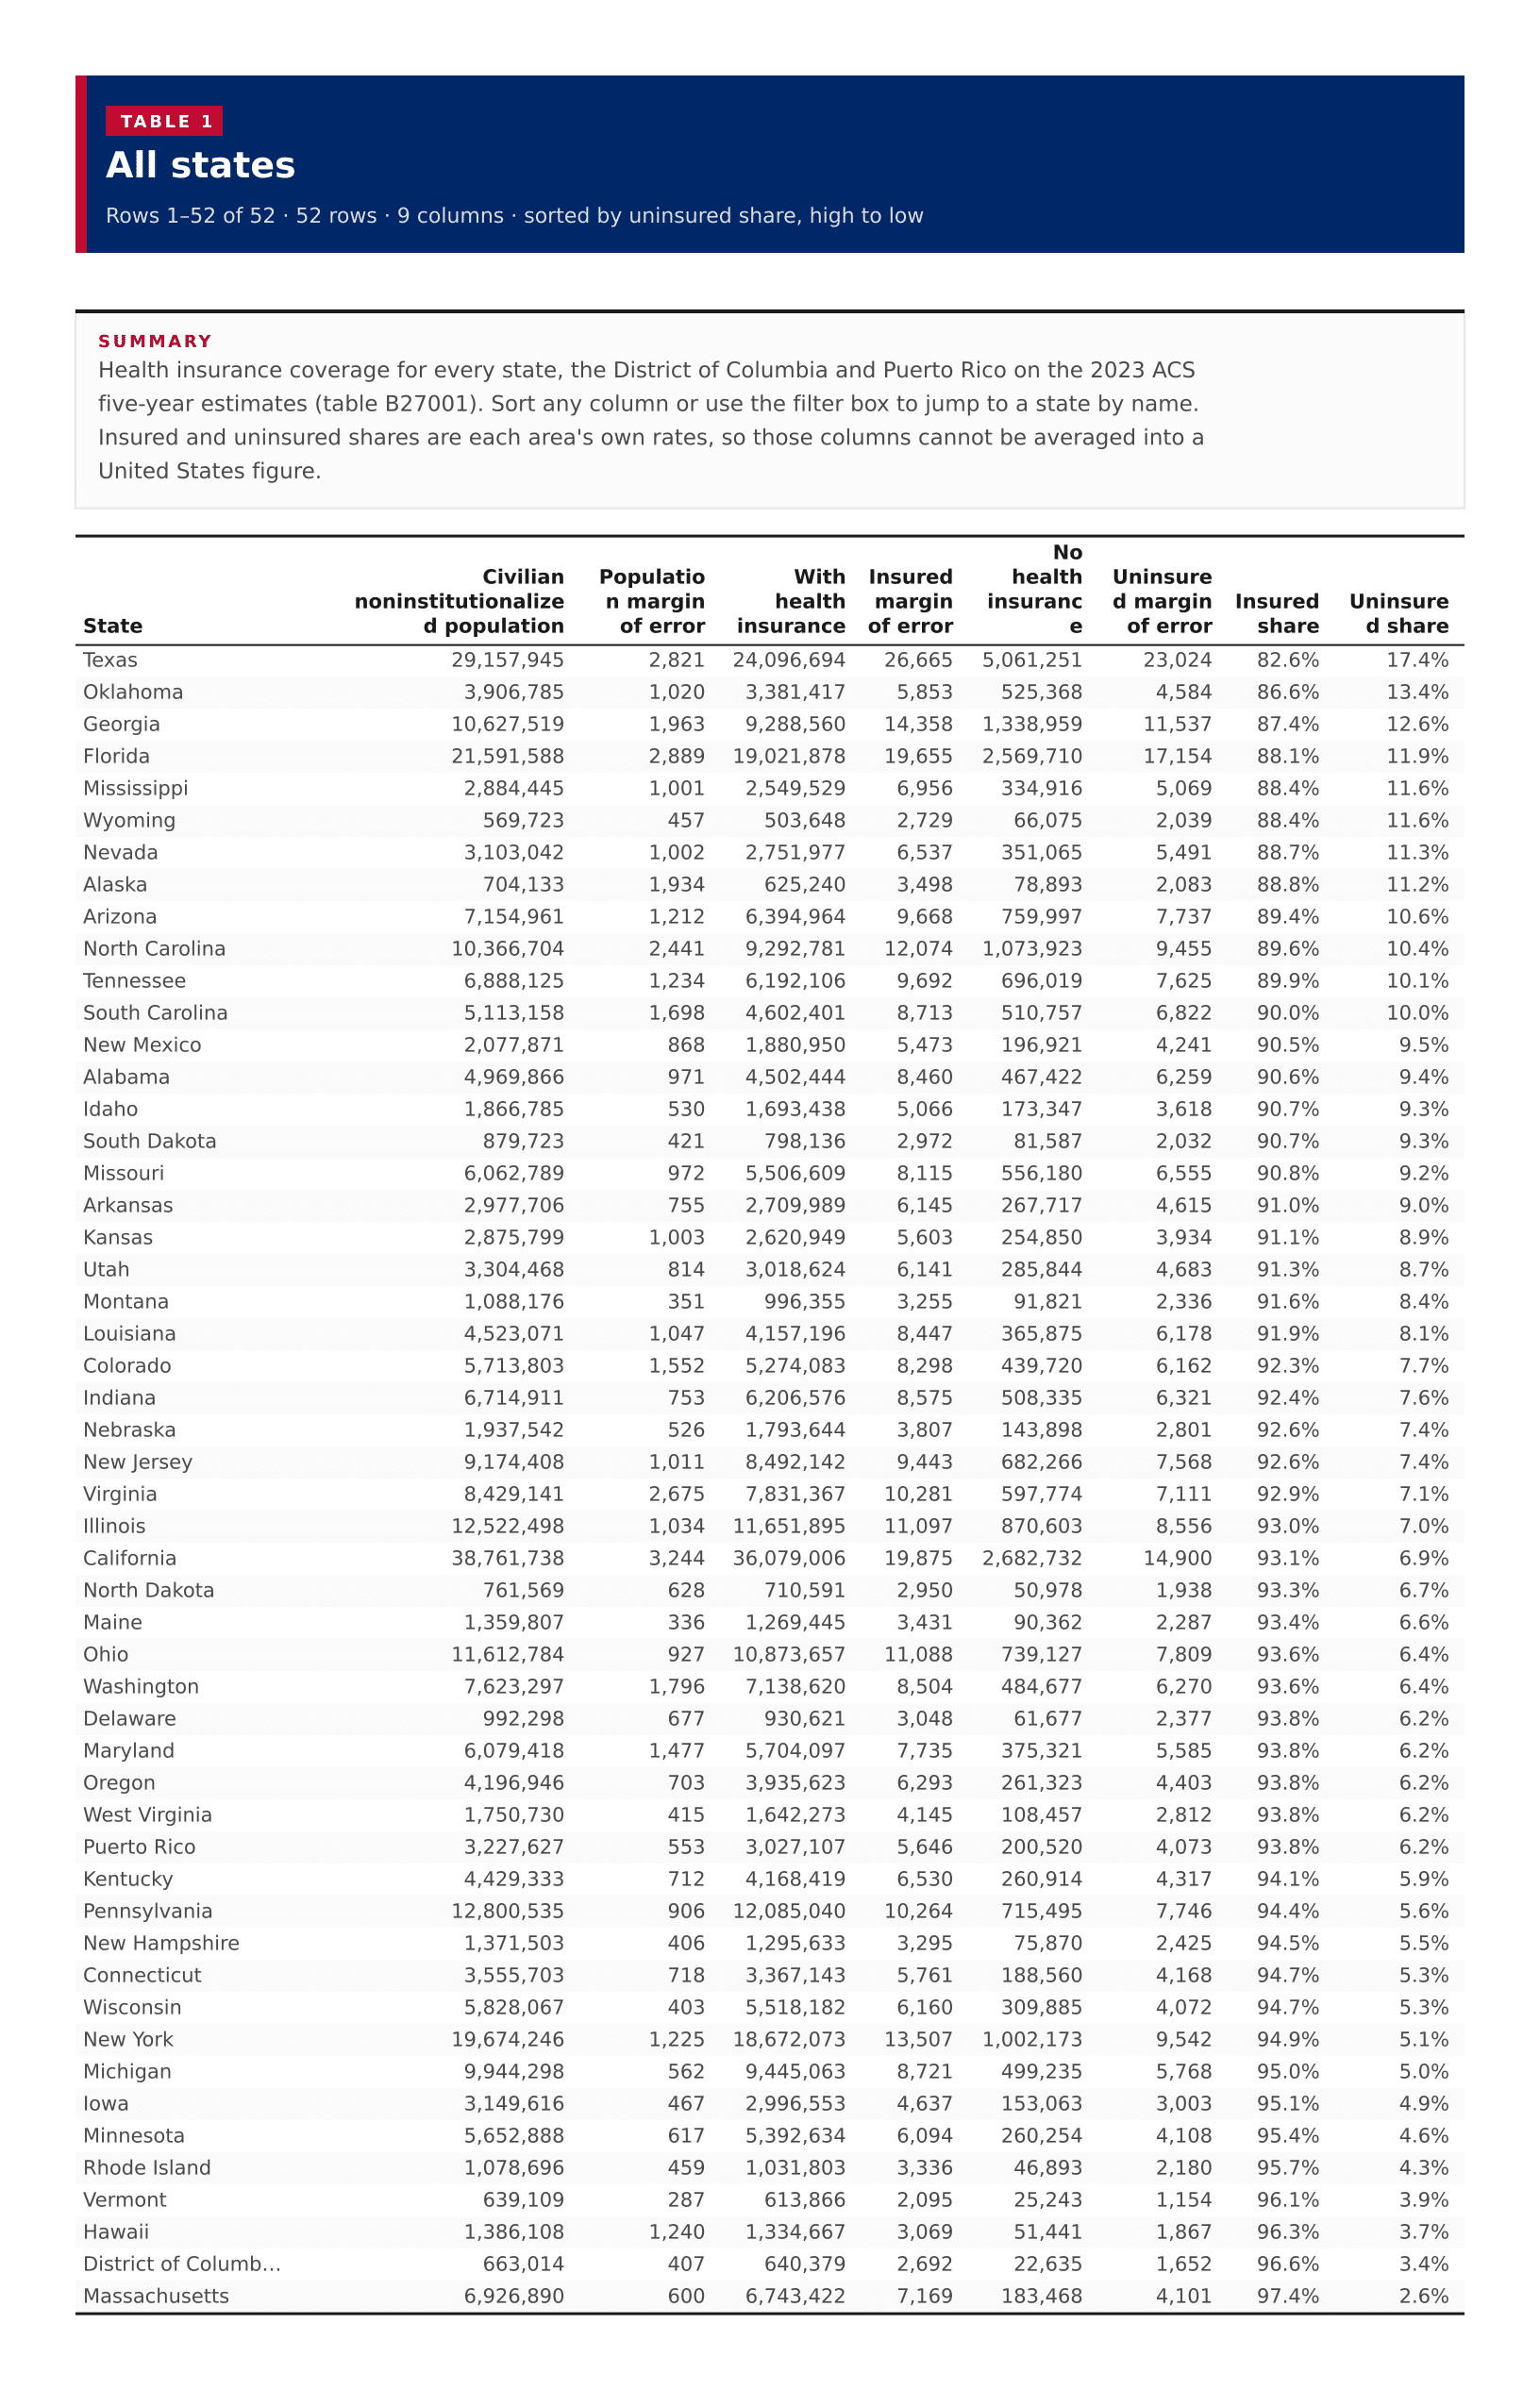
All states

52 rows · 9 columns · sorted by uninsured share, high to low

52 rows
View100%
DownloadPDFImageCSV
Summary

Health insurance coverage for every state, the District of Columbia and Puerto Rico on the 2023 ACS five-year estimates (table B27001). Sort any column or use the filter box to jump to a state by name. Insured and uninsured shares are each area's own rates, so those columns cannot be averaged into a United States figure.

All states
????????
Texas29,157,9452,82124,096,69426,6655,061,25123,02482.6%17.4%
Oklahoma3,906,7851,0203,381,4175,853525,3684,58486.6%13.4%
Georgia10,627,5191,9639,288,56014,3581,338,95911,53787.4%12.6%
Florida21,591,5882,88919,021,87819,6552,569,71017,15488.1%11.9%
Mississippi2,884,4451,0012,549,5296,956334,9165,06988.4%11.6%
Wyoming569,723457503,6482,72966,0752,03988.4%11.6%
Nevada3,103,0421,0022,751,9776,537351,0655,49188.7%11.3%
Alaska704,1331,934625,2403,49878,8932,08388.8%11.2%
Arizona7,154,9611,2126,394,9649,668759,9977,73789.4%10.6%
North Carolina10,366,7042,4419,292,78112,0741,073,9239,45589.6%10.4%
Tennessee6,888,1251,2346,192,1069,692696,0197,62589.9%10.1%
South Carolina5,113,1581,6984,602,4018,713510,7576,82290.0%10.0%
New Mexico2,077,8718681,880,9505,473196,9214,24190.5%9.5%
Alabama4,969,8669714,502,4448,460467,4226,25990.6%9.4%
Idaho1,866,7855301,693,4385,066173,3473,61890.7%9.3%
South Dakota879,723421798,1362,97281,5872,03290.7%9.3%
Missouri6,062,7899725,506,6098,115556,1806,55590.8%9.2%
Arkansas2,977,7067552,709,9896,145267,7174,61591.0%9.0%
Kansas2,875,7991,0032,620,9495,603254,8503,93491.1%8.9%
Utah3,304,4688143,018,6246,141285,8444,68391.3%8.7%
Montana1,088,176351996,3553,25591,8212,33691.6%8.4%
Louisiana4,523,0711,0474,157,1968,447365,8756,17891.9%8.1%
Colorado5,713,8031,5525,274,0838,298439,7206,16292.3%7.7%
Indiana6,714,9117536,206,5768,575508,3356,32192.4%7.6%
Nebraska1,937,5425261,793,6443,807143,8982,80192.6%7.4%
New Jersey9,174,4081,0118,492,1429,443682,2667,56892.6%7.4%
Virginia8,429,1412,6757,831,36710,281597,7747,11192.9%7.1%
Illinois12,522,4981,03411,651,89511,097870,6038,55693.0%7.0%
California38,761,7383,24436,079,00619,8752,682,73214,90093.1%6.9%
North Dakota761,569628710,5912,95050,9781,93893.3%6.7%
Maine1,359,8073361,269,4453,43190,3622,28793.4%6.6%
Ohio11,612,78492710,873,65711,088739,1277,80993.6%6.4%
Washington7,623,2971,7967,138,6208,504484,6776,27093.6%6.4%
Delaware992,298677930,6213,04861,6772,37793.8%6.2%
Maryland6,079,4181,4775,704,0977,735375,3215,58593.8%6.2%
Oregon4,196,9467033,935,6236,293261,3234,40393.8%6.2%
West Virginia1,750,7304151,642,2734,145108,4572,81293.8%6.2%
Puerto Rico3,227,6275533,027,1075,646200,5204,07393.8%6.2%
Kentucky4,429,3337124,168,4196,530260,9144,31794.1%5.9%
Pennsylvania12,800,53590612,085,04010,264715,4957,74694.4%5.6%
New Hampshire1,371,5034061,295,6333,29575,8702,42594.5%5.5%
Connecticut3,555,7037183,367,1435,761188,5604,16894.7%5.3%
Wisconsin5,828,0674035,518,1826,160309,8854,07294.7%5.3%
New York19,674,2461,22518,672,07313,5071,002,1739,54294.9%5.1%
Michigan9,944,2985629,445,0638,721499,2355,76895.0%5.0%
Iowa3,149,6164672,996,5534,637153,0633,00395.1%4.9%
Minnesota5,652,8886175,392,6346,094260,2544,10895.4%4.6%
Rhode Island1,078,6964591,031,8033,33646,8932,18095.7%4.3%
Vermont639,109287613,8662,09525,2431,15496.1%3.9%
Hawaii1,386,1081,2401,334,6673,06951,4411,86796.3%3.7%
District of Columbia663,014407640,3792,69222,6351,65296.6%3.4%
Massachusetts6,926,8906006,743,4227,169183,4684,10197.4%2.6%

Image files

Download all

Figure 2

Uninsured share, all published states

Figure 2: Uninsured share, all published states
DownloadPDFImageCSV

Figure 3

Insured share, all published states

Figure 3: Insured share, all published states
DownloadPDFImageCSV

About this data

  • Health insurance coverage status comes from ACS detailed table B27001 (Health Insurance Coverage Status by Sex by Age) for the civilian noninstitutionalized population.
  • Insured and uninsured counts are the sums of the age-by-sex leaf cells in B27001. Shares are those counts divided by the table total for each area.
  • A state coverage rate is that state's own share, so the 52 rates cannot be averaged to produce a national figure.
  • The Census published 50 states, the District of Columbia and Puerto Rico. None of the coverage totals were suppressed.
  • ACS special values such as -555555555 on a margin of error mean the estimate is controlled and has no sampling MOE; those cells are stored as blank.
  • Puerto Rico is in the ranking and table. On the US state map it is omitted; Alaska and Hawaii use the usual insets.