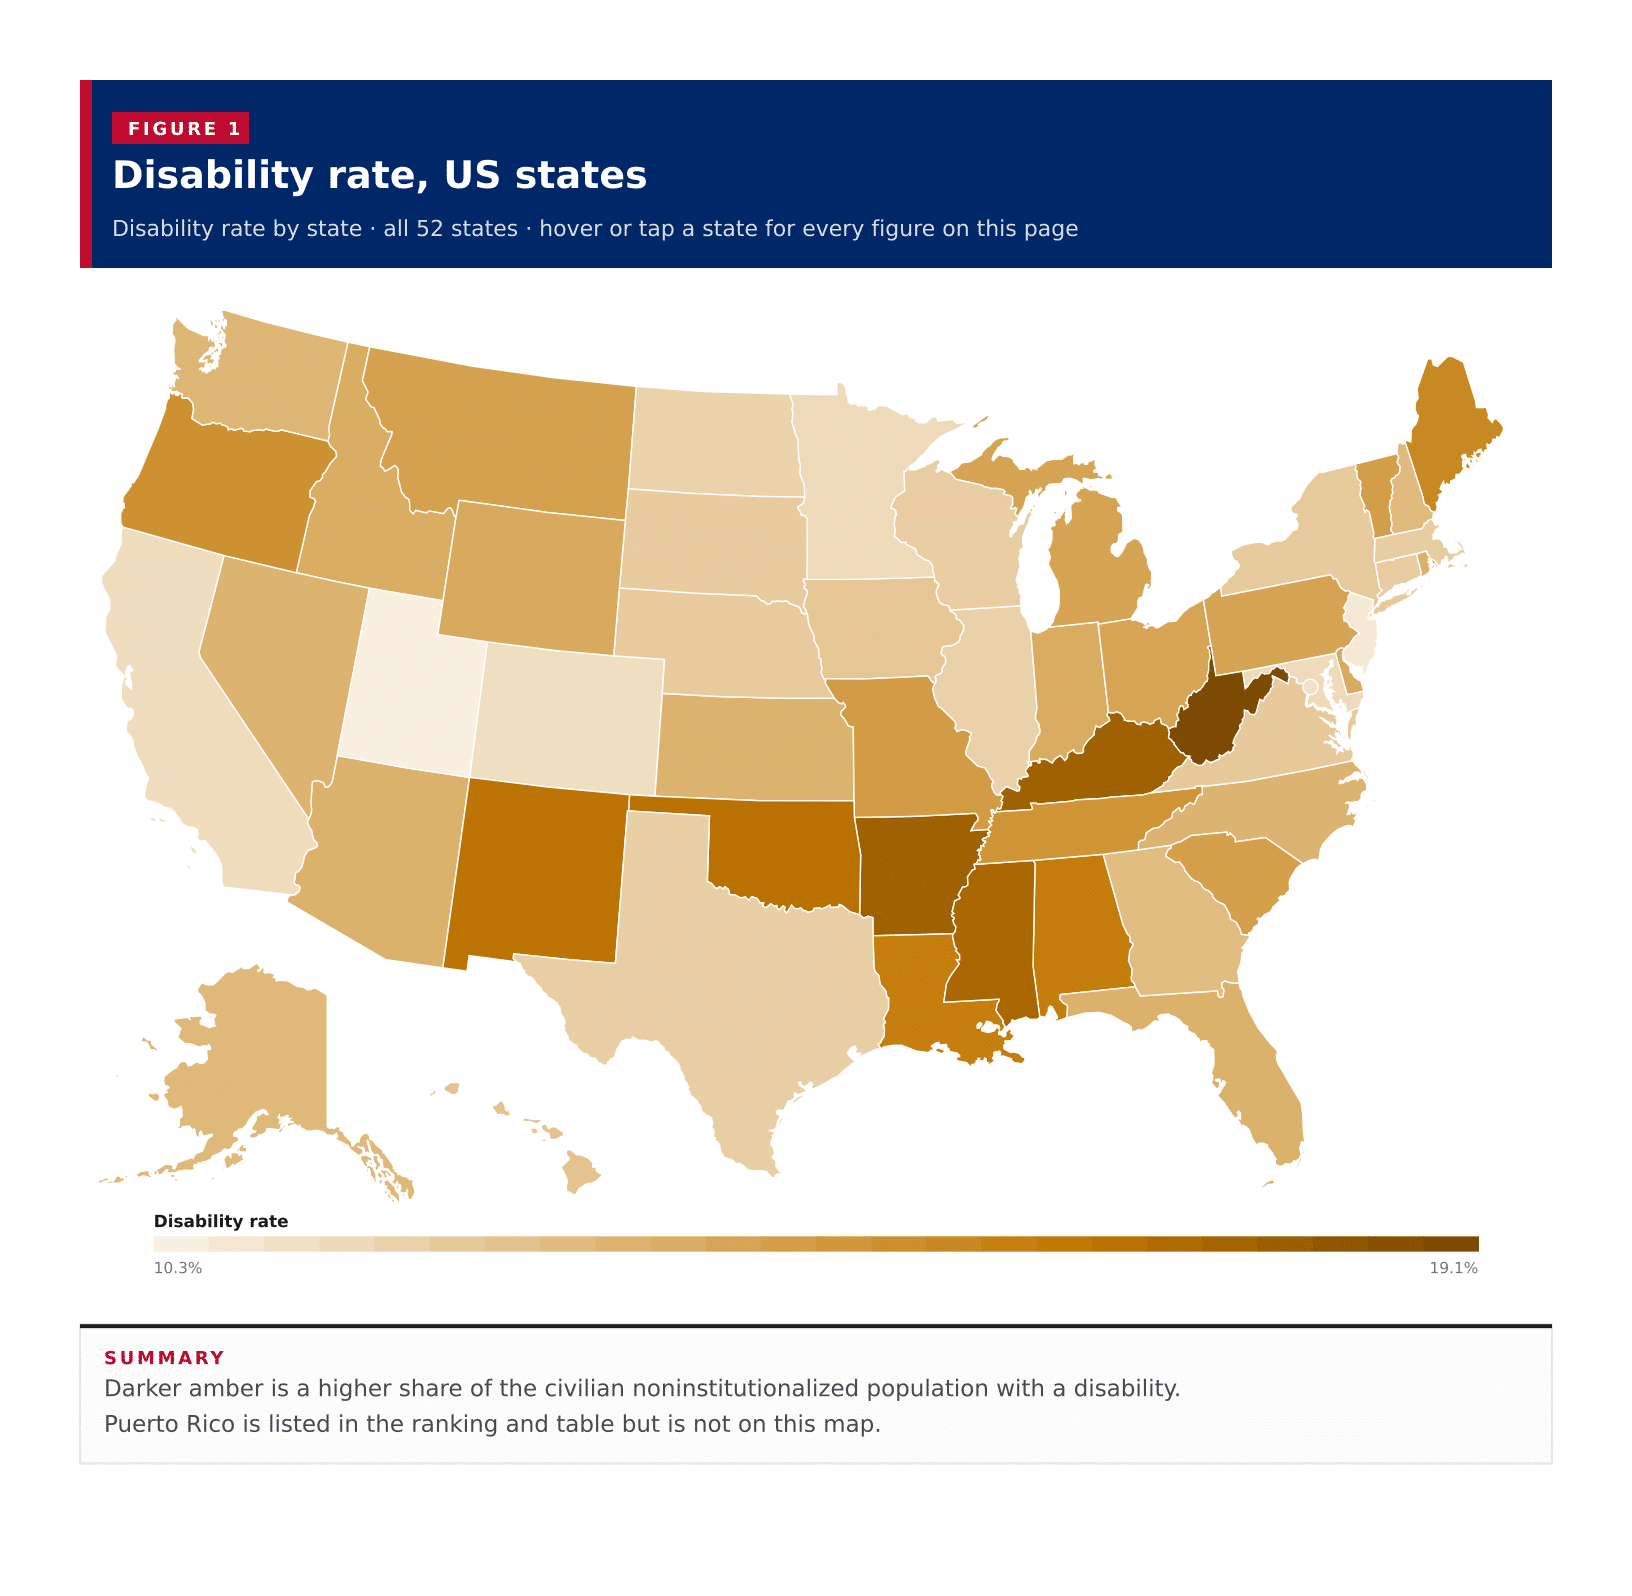
Figure 1
Disability rate, US states

Disability rate by state · all 52 states · hover or tap a state for every figure on this page
A typical published area has a disability rate of 13.5%, the midpoint of the 50 states, the District of Columbia and Puerto Rico on the 2023 ACS five-year estimates. West Virginia has the highest rate among the 50 states at 19.1%, and Utah is the lowest at 10.3%. Puerto Rico, which this table also returns, sits at 22.8%. West Virginia is 8.8 percentage points above Utah. These are each area's own share of the civilian noninstitutionalized population with a disability, not a national average of states.
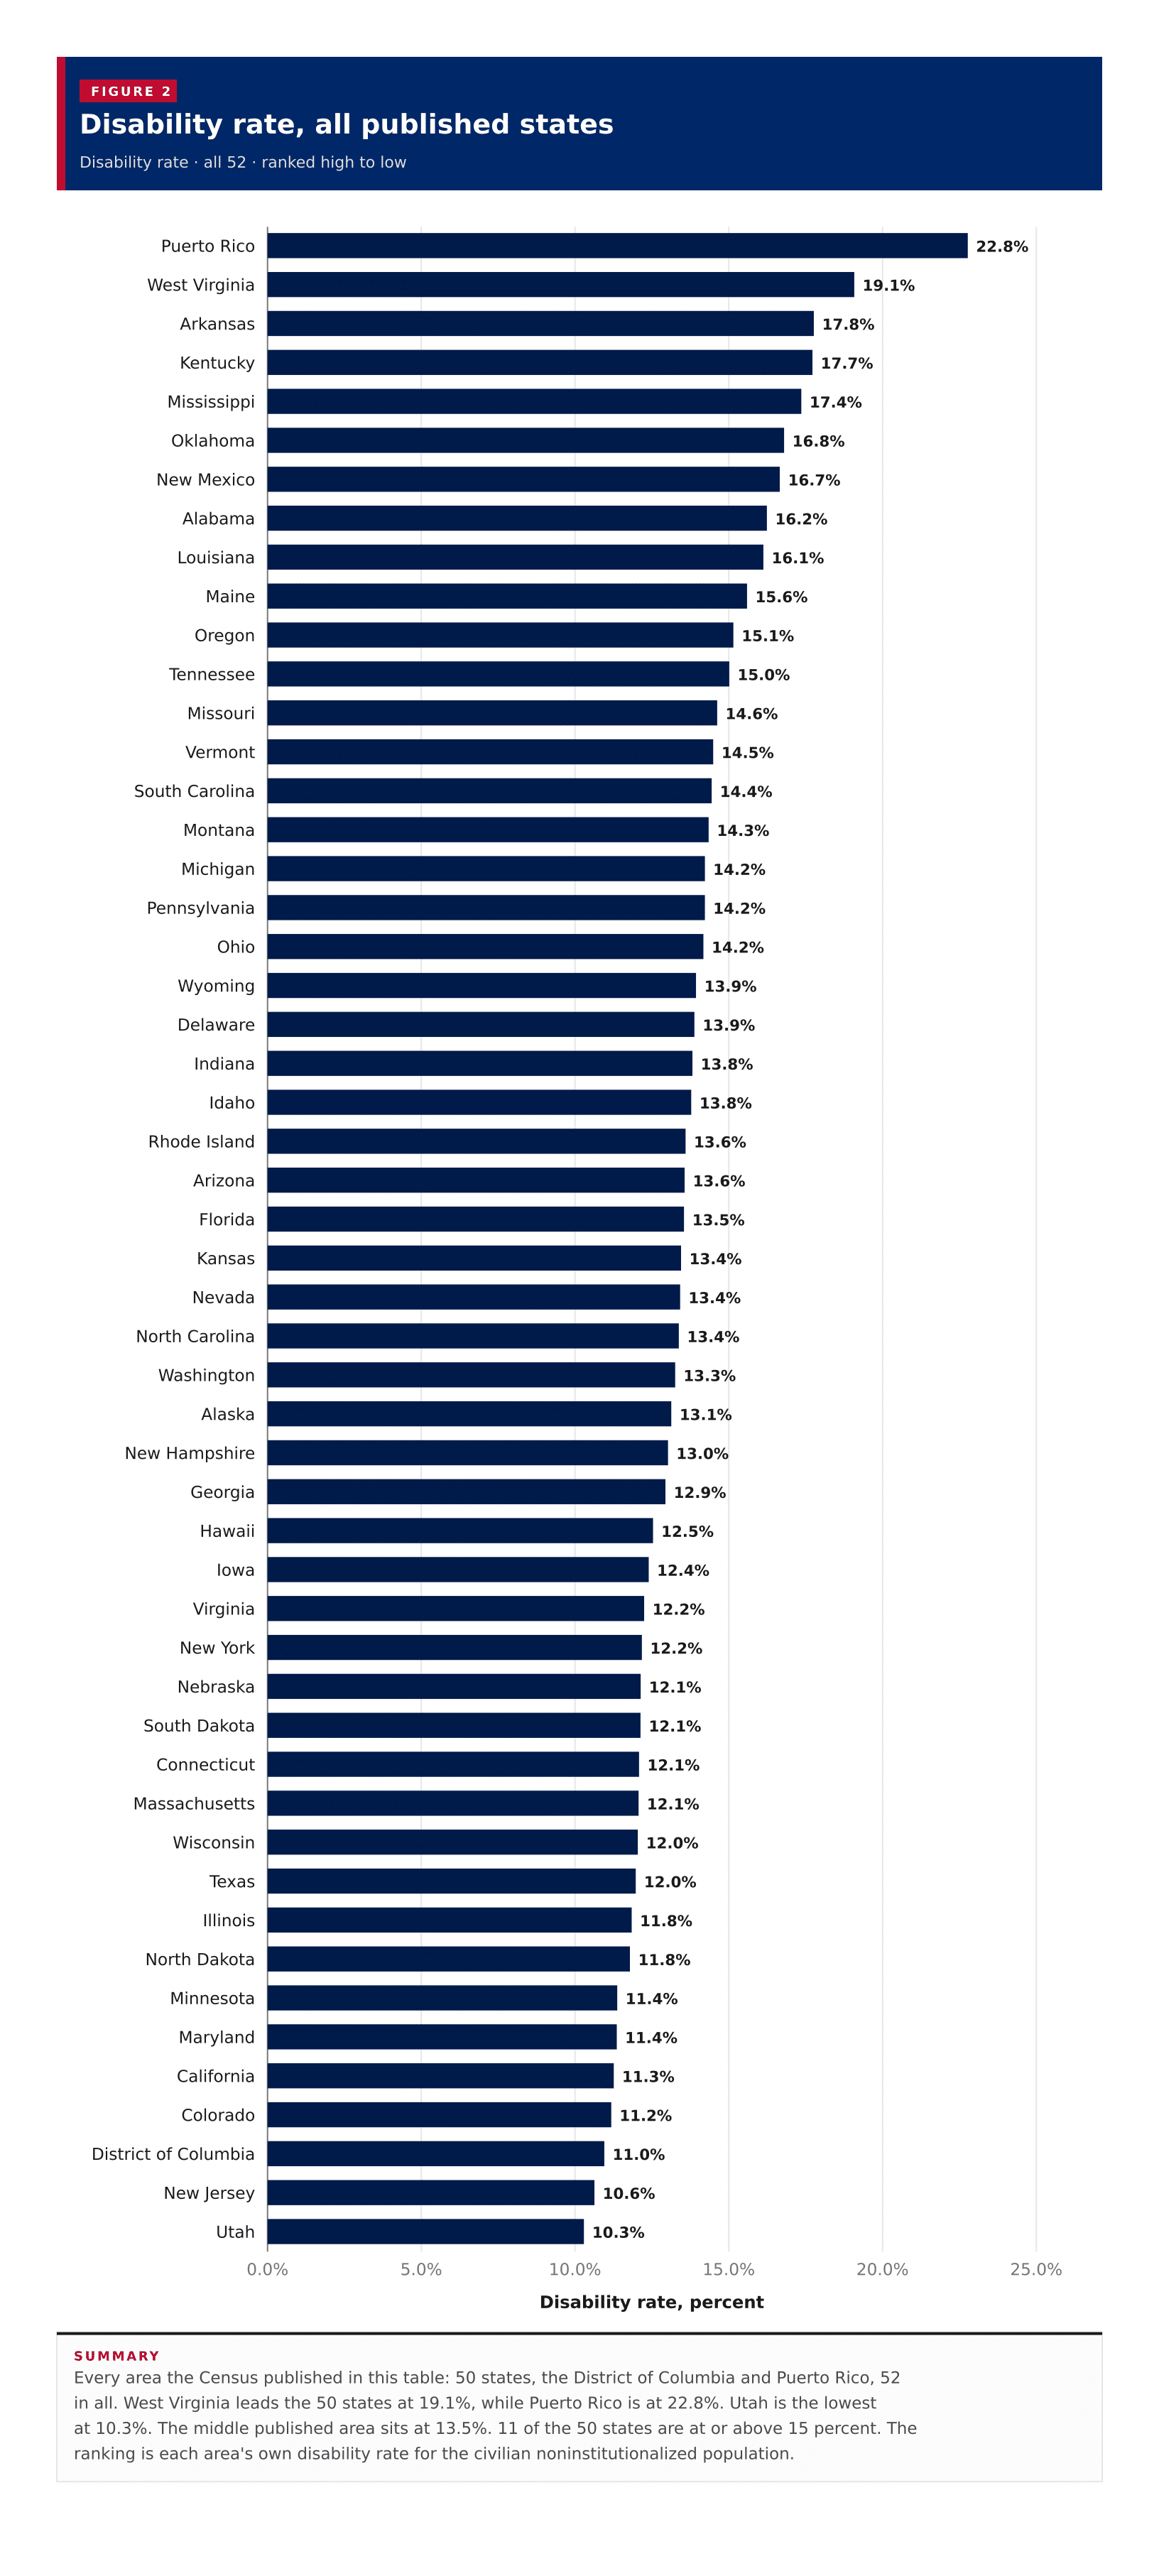
Disability rate · all 52 · ranked high to low
Every area the Census published in this table: 50 states, the District of Columbia and Puerto Rico, 52 in all. West Virginia leads the 50 states at 19.1%, while Puerto Rico is at 22.8%. Utah is the lowest at 10.3%. The middle published area sits at 13.5%. 11 of the 50 states are at or above 15 percent. The ranking is each area's own disability rate for the civilian noninstitutionalized population.
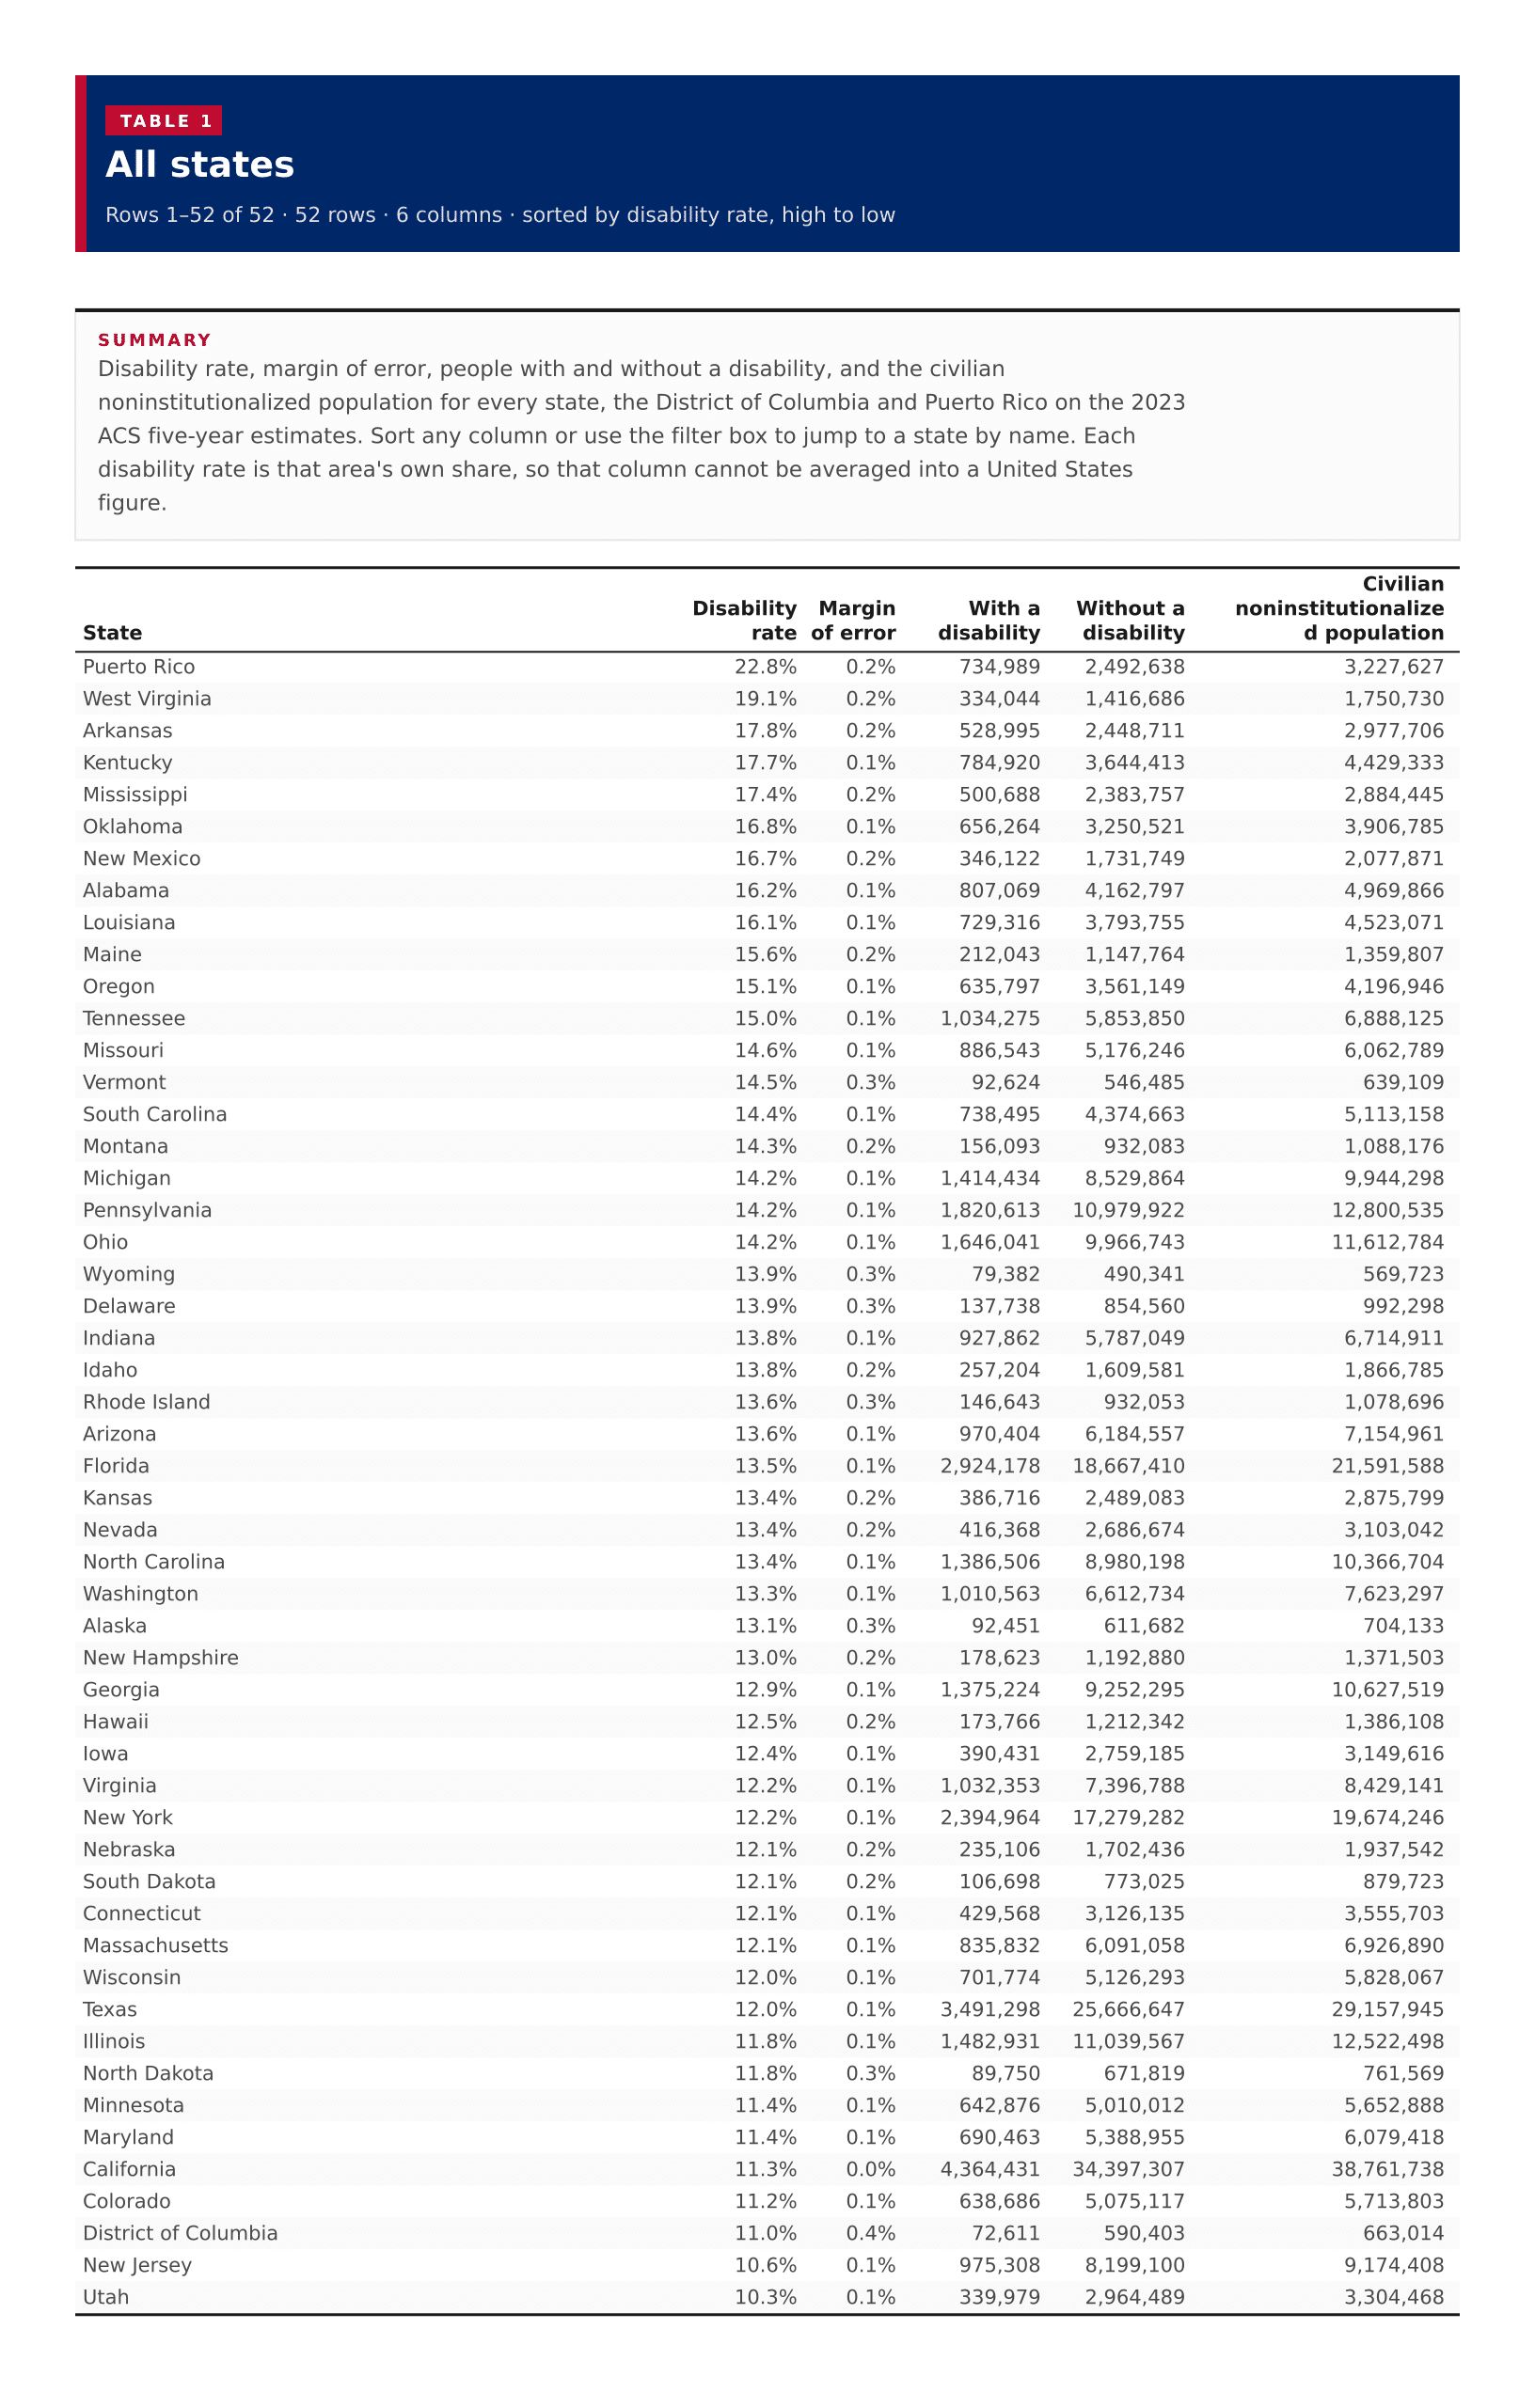
52 rows · 6 columns · sorted by disability rate, high to low
Disability rate, margin of error, people with and without a disability, and the civilian noninstitutionalized population for every state, the District of Columbia and Puerto Rico on the 2023 ACS five-year estimates. Sort any column or use the filter box to jump to a state by name. Each disability rate is that area's own share, so that column cannot be averaged into a United States figure.
| ? | ? | ? | ? | ? | |
|---|---|---|---|---|---|
| Puerto Rico | 22.8% | 0.2% | 734,989 | 2,492,638 | 3,227,627 |
| West Virginia | 19.1% | 0.2% | 334,044 | 1,416,686 | 1,750,730 |
| Arkansas | 17.8% | 0.2% | 528,995 | 2,448,711 | 2,977,706 |
| Kentucky | 17.7% | 0.1% | 784,920 | 3,644,413 | 4,429,333 |
| Mississippi | 17.4% | 0.2% | 500,688 | 2,383,757 | 2,884,445 |
| Oklahoma | 16.8% | 0.1% | 656,264 | 3,250,521 | 3,906,785 |
| New Mexico | 16.7% | 0.2% | 346,122 | 1,731,749 | 2,077,871 |
| Alabama | 16.2% | 0.1% | 807,069 | 4,162,797 | 4,969,866 |
| Louisiana | 16.1% | 0.1% | 729,316 | 3,793,755 | 4,523,071 |
| Maine | 15.6% | 0.2% | 212,043 | 1,147,764 | 1,359,807 |
| Oregon | 15.1% | 0.1% | 635,797 | 3,561,149 | 4,196,946 |
| Tennessee | 15.0% | 0.1% | 1,034,275 | 5,853,850 | 6,888,125 |
| Missouri | 14.6% | 0.1% | 886,543 | 5,176,246 | 6,062,789 |
| Vermont | 14.5% | 0.3% | 92,624 | 546,485 | 639,109 |
| South Carolina | 14.4% | 0.1% | 738,495 | 4,374,663 | 5,113,158 |
| Montana | 14.3% | 0.2% | 156,093 | 932,083 | 1,088,176 |
| Michigan | 14.2% | 0.1% | 1,414,434 | 8,529,864 | 9,944,298 |
| Pennsylvania | 14.2% | 0.1% | 1,820,613 | 10,979,922 | 12,800,535 |
| Ohio | 14.2% | 0.1% | 1,646,041 | 9,966,743 | 11,612,784 |
| Wyoming | 13.9% | 0.3% | 79,382 | 490,341 | 569,723 |
| Delaware | 13.9% | 0.3% | 137,738 | 854,560 | 992,298 |
| Indiana | 13.8% | 0.1% | 927,862 | 5,787,049 | 6,714,911 |
| Idaho | 13.8% | 0.2% | 257,204 | 1,609,581 | 1,866,785 |
| Rhode Island | 13.6% | 0.3% | 146,643 | 932,053 | 1,078,696 |
| Arizona | 13.6% | 0.1% | 970,404 | 6,184,557 | 7,154,961 |
| Florida | 13.5% | 0.1% | 2,924,178 | 18,667,410 | 21,591,588 |
| Kansas | 13.4% | 0.2% | 386,716 | 2,489,083 | 2,875,799 |
| Nevada | 13.4% | 0.2% | 416,368 | 2,686,674 | 3,103,042 |
| North Carolina | 13.4% | 0.1% | 1,386,506 | 8,980,198 | 10,366,704 |
| Washington | 13.3% | 0.1% | 1,010,563 | 6,612,734 | 7,623,297 |
| Alaska | 13.1% | 0.3% | 92,451 | 611,682 | 704,133 |
| New Hampshire | 13.0% | 0.2% | 178,623 | 1,192,880 | 1,371,503 |
| Georgia | 12.9% | 0.1% | 1,375,224 | 9,252,295 | 10,627,519 |
| Hawaii | 12.5% | 0.2% | 173,766 | 1,212,342 | 1,386,108 |
| Iowa | 12.4% | 0.1% | 390,431 | 2,759,185 | 3,149,616 |
| Virginia | 12.2% | 0.1% | 1,032,353 | 7,396,788 | 8,429,141 |
| New York | 12.2% | 0.1% | 2,394,964 | 17,279,282 | 19,674,246 |
| Nebraska | 12.1% | 0.2% | 235,106 | 1,702,436 | 1,937,542 |
| South Dakota | 12.1% | 0.2% | 106,698 | 773,025 | 879,723 |
| Connecticut | 12.1% | 0.1% | 429,568 | 3,126,135 | 3,555,703 |
| Massachusetts | 12.1% | 0.1% | 835,832 | 6,091,058 | 6,926,890 |
| Wisconsin | 12.0% | 0.1% | 701,774 | 5,126,293 | 5,828,067 |
| Texas | 12.0% | 0.1% | 3,491,298 | 25,666,647 | 29,157,945 |
| Illinois | 11.8% | 0.1% | 1,482,931 | 11,039,567 | 12,522,498 |
| North Dakota | 11.8% | 0.3% | 89,750 | 671,819 | 761,569 |
| Minnesota | 11.4% | 0.1% | 642,876 | 5,010,012 | 5,652,888 |
| Maryland | 11.4% | 0.1% | 690,463 | 5,388,955 | 6,079,418 |
| California | 11.3% | 0.0% | 4,364,431 | 34,397,307 | 38,761,738 |
| Colorado | 11.2% | 0.1% | 638,686 | 5,075,117 | 5,713,803 |
| District of Columbia | 11.0% | 0.4% | 72,611 | 590,403 | 663,014 |
| New Jersey | 10.6% | 0.1% | 975,308 | 8,199,100 | 9,174,408 |
| Utah | 10.3% | 0.1% | 339,979 | 2,964,489 | 3,304,468 |