Educational attainment by US state

Summary

Bachelor's or higher, US states

Bachelor's or higher by state · all 52 states · hover or tap a state for every figure on this page

52 items
View100%
DownloadPDFImageCSV
StatesDistrict of Columbia
Bachelor's or higher, US statesDarker amber is a higher share of adults 25 and over with a bachelor's degree or higher. Puerto Rico is listed in the ranking and table but is not on this map.Alabama · Population 25 years and over: 3,448,302 · Less than high school: 11.9% · High school graduate: 30.3% · Some college, no degree: 21.1% · Associate's degree: 9.0% · Bachelor's degree: 17.0% · Graduate or professional: 10.8% · High school or higher: 88.1% · Bachelor's or higher: 27.8%Alaska · Population 25 years and over: 487,903 · Less than high school: 6.5% · High school graduate: 28.9% · Some college, no degree: 24.2% · Associate's degree: 9.1% · Bachelor's degree: 19.6% · Graduate or professional: 11.6% · High school or higher: 93.5% · Bachelor's or higher: 31.2%Arizona · Population 25 years and over: 4,990,633 · Less than high school: 10.9% · High school graduate: 23.5% · Some college, no degree: 23.8% · Associate's degree: 9.2% · Bachelor's degree: 20.0% · Graduate or professional: 12.6% · High school or higher: 89.1% · Bachelor's or higher: 32.6%Arkansas · Population 25 years and over: 2,043,779 · Less than high school: 11.4% · High school graduate: 34.4% · Some college, no degree: 21.1% · Associate's degree: 8.0% · Bachelor's degree: 15.9% · Graduate or professional: 9.2% · High school or higher: 88.6% · Bachelor's or higher: 25.1%California · Population 25 years and over: 26,941,198 · Less than high school: 15.4% · High school graduate: 20.4% · Some college, no degree: 19.8% · Associate's degree: 7.9% · Bachelor's degree: 22.4% · Graduate or professional: 14.1% · High school or higher: 84.6% · Bachelor's or higher: 36.5%Colorado · Population 25 years and over: 4,038,534 · Less than high school: 7.2% · High school graduate: 20.1% · Some college, no degree: 19.6% · Associate's degree: 8.3% · Bachelor's degree: 27.7% · Graduate or professional: 17.1% · High school or higher: 92.8% · Bachelor's or higher: 44.7%Connecticut · Population 25 years and over: 2,532,853 · Less than high school: 8.7% · High school graduate: 25.5% · Some college, no degree: 16.2% · Associate's degree: 7.6% · Bachelor's degree: 23.0% · Graduate or professional: 19.0% · High school or higher: 91.3% · Bachelor's or higher: 41.9%Delaware · Population 25 years and over: 710,442 · Less than high school: 8.6% · High school graduate: 29.0% · Some college, no degree: 18.7% · Associate's degree: 8.4% · Bachelor's degree: 20.3% · Graduate or professional: 15.0% · High school or higher: 91.4% · Bachelor's or higher: 35.3%Florida · Population 25 years and over: 15,850,299 · Less than high school: 10.4% · High school graduate: 27.4% · Some college, no degree: 18.9% · Associate's degree: 10.1% · Bachelor's degree: 20.7% · Graduate or professional: 12.5% · High school or higher: 89.6% · Bachelor's or higher: 33.2%Georgia · Population 25 years and over: 7,253,060 · Less than high school: 11.0% · High school graduate: 26.9% · Some college, no degree: 19.5% · Associate's degree: 8.3% · Bachelor's degree: 20.7% · Graduate or professional: 13.5% · High school or higher: 89.0% · Bachelor's or higher: 34.2%Hawaii · Population 25 years and over: 1,027,351 · Less than high school: 7.1% · High school graduate: 26.7% · Some college, no degree: 19.8% · Associate's degree: 11.0% · Bachelor's degree: 22.5% · Graduate or professional: 13.0% · High school or higher: 92.9% · Bachelor's or higher: 35.5%Idaho · Population 25 years and over: 1,244,319 · Less than high school: 8.3% · High school graduate: 25.9% · Some college, no degree: 24.8% · Associate's degree: 9.8% · Bachelor's degree: 20.8% · Graduate or professional: 10.4% · High school or higher: 91.7% · Bachelor's or higher: 31.2%Illinois · Population 25 years and over: 8,738,607 · Less than high school: 9.7% · High school graduate: 25.3% · Some college, no degree: 19.5% · Associate's degree: 8.3% · Bachelor's degree: 22.3% · Graduate or professional: 14.9% · High school or higher: 90.3% · Bachelor's or higher: 37.2%Indiana · Population 25 years and over: 4,559,304 · Less than high school: 9.8% · High school graduate: 32.8% · Some college, no degree: 19.5% · Associate's degree: 9.1% · Bachelor's degree: 18.3% · Graduate or professional: 10.5% · High school or higher: 90.2% · Bachelor's or higher: 28.8%Iowa · Population 25 years and over: 2,140,476 · Less than high school: 6.8% · High school graduate: 30.4% · Some college, no degree: 19.9% · Associate's degree: 12.1% · Bachelor's degree: 20.6% · Graduate or professional: 10.2% · High school or higher: 93.2% · Bachelor's or higher: 30.9%Kansas · Population 25 years and over: 1,933,293 · Less than high school: 8.1% · High school graduate: 25.6% · Some college, no degree: 22.1% · Associate's degree: 9.0% · Bachelor's degree: 22.0% · Graduate or professional: 13.1% · High school or higher: 91.9% · Bachelor's or higher: 35.2%Kentucky · Population 25 years and over: 3,078,157 · Less than high school: 11.5% · High school graduate: 32.7% · Some college, no degree: 20.0% · Associate's degree: 8.9% · Bachelor's degree: 15.9% · Graduate or professional: 11.1% · High school or higher: 88.5% · Bachelor's or higher: 27.0%Louisiana · Population 25 years and over: 3,110,254 · Less than high school: 13.1% · High school graduate: 32.5% · Some college, no degree: 20.7% · Associate's degree: 7.1% · Bachelor's degree: 16.8% · Graduate or professional: 9.8% · High school or higher: 86.9% · Bachelor's or higher: 26.6%Maine · Population 25 years and over: 1,016,630 · Less than high school: 5.5% · High school graduate: 30.5% · Some college, no degree: 18.2% · Associate's degree: 10.4% · Bachelor's degree: 22.0% · Graduate or professional: 13.3% · High school or higher: 94.5% · Bachelor's or higher: 35.3%Maryland · Population 25 years and over: 4,272,813 · Less than high school: 9.0% · High school graduate: 23.7% · Some college, no degree: 17.7% · Associate's degree: 6.9% · Bachelor's degree: 22.5% · Graduate or professional: 20.3% · High school or higher: 91.0% · Bachelor's or higher: 42.7%Massachusetts · Population 25 years and over: 4,945,630 · Less than high school: 8.6% · High school graduate: 22.8% · Some college, no degree: 14.4% · Associate's degree: 7.5% · Bachelor's degree: 25.3% · Graduate or professional: 21.4% · High school or higher: 91.4% · Bachelor's or higher: 46.6%Michigan · Population 25 years and over: 6,967,452 · Less than high school: 8.1% · High school graduate: 28.2% · Some college, no degree: 22.2% · Associate's degree: 9.7% · Bachelor's degree: 19.3% · Graduate or professional: 12.5% · High school or higher: 91.9% · Bachelor's or higher: 31.8%Minnesota · Population 25 years and over: 3,897,590 · Less than high school: 6.1% · High school graduate: 23.5% · Some college, no degree: 19.8% · Associate's degree: 11.7% · Bachelor's degree: 25.3% · Graduate or professional: 13.6% · High school or higher: 93.9% · Bachelor's or higher: 38.8%Mississippi · Population 25 years and over: 1,970,298 · Less than high school: 13.4% · High school graduate: 29.9% · Some college, no degree: 21.8% · Associate's degree: 10.8% · Bachelor's degree: 14.7% · Graduate or professional: 9.4% · High school or higher: 86.6% · Bachelor's or higher: 24.2%Missouri · Population 25 years and over: 4,217,432 · Less than high school: 8.4% · High school graduate: 30.3% · Some college, no degree: 21.0% · Associate's degree: 8.3% · Bachelor's degree: 19.6% · Graduate or professional: 12.3% · High school or higher: 91.6% · Bachelor's or higher: 31.9%Montana · Population 25 years and over: 770,335 · Less than high school: 5.4% · High school graduate: 27.9% · Some college, no degree: 22.4% · Associate's degree: 9.7% · Bachelor's degree: 22.8% · Graduate or professional: 11.7% · High school or higher: 94.6% · Bachelor's or higher: 34.5%Nebraska · Population 25 years and over: 1,290,256 · Less than high school: 7.9% · High school graduate: 25.1% · Some college, no degree: 21.9% · Associate's degree: 11.0% · Bachelor's degree: 22.2% · Graduate or professional: 11.9% · High school or higher: 92.1% · Bachelor's or higher: 34.1%Nevada · Population 25 years and over: 2,196,081 · Less than high school: 12.6% · High school graduate: 27.4% · Some college, no degree: 23.8% · Associate's degree: 8.7% · Bachelor's degree: 17.8% · Graduate or professional: 9.6% · High school or higher: 87.4% · Bachelor's or higher: 27.4%New Hampshire · Population 25 years and over: 1,009,222 · Less than high school: 5.9% · High school graduate: 27.0% · Some college, no degree: 17.3% · Associate's degree: 10.0% · Bachelor's degree: 24.1% · Graduate or professional: 15.7% · High school or higher: 94.1% · Bachelor's or higher: 39.8%New Jersey · Population 25 years and over: 6,459,220 · Less than high school: 9.3% · High school graduate: 25.7% · Some college, no degree: 15.3% · Associate's degree: 6.7% · Bachelor's degree: 25.8% · Graduate or professional: 17.1% · High school or higher: 90.7% · Bachelor's or higher: 42.9%New Mexico · Population 25 years and over: 1,450,999 · Less than high school: 12.3% · High school graduate: 25.7% · Some college, no degree: 22.6% · Associate's degree: 9.2% · Bachelor's degree: 16.6% · Graduate or professional: 13.6% · High school or higher: 87.7% · Bachelor's or higher: 30.2%New York · Population 25 years and over: 13,996,138 · Less than high school: 12.1% · High school graduate: 24.6% · Some college, no degree: 14.9% · Associate's degree: 8.9% · Bachelor's degree: 22.0% · Graduate or professional: 17.5% · High school or higher: 87.9% · Bachelor's or higher: 39.6%North Carolina · Population 25 years and over: 7,261,810 · Less than high school: 10.3% · High school graduate: 25.0% · Some college, no degree: 20.0% · Associate's degree: 10.1% · Bachelor's degree: 21.8% · Graduate or professional: 12.9% · High school or higher: 89.7% · Bachelor's or higher: 34.7%North Dakota · Population 25 years and over: 509,149 · Less than high school: 6.2% · High school graduate: 25.7% · Some college, no degree: 21.8% · Associate's degree: 14.0% · Bachelor's degree: 22.7% · Graduate or professional: 9.6% · High school or higher: 93.8% · Bachelor's or higher: 32.3%Ohio · Population 25 years and over: 8,123,344 · Less than high school: 8.4% · High school graduate: 32.3% · Some college, no degree: 19.4% · Associate's degree: 9.0% · Bachelor's degree: 19.0% · Graduate or professional: 11.9% · High school or higher: 91.6% · Bachelor's or higher: 30.9%Oklahoma · Population 25 years and over: 2,641,325 · Less than high school: 10.9% · High school graduate: 30.7% · Some college, no degree: 22.3% · Associate's degree: 8.3% · Bachelor's degree: 18.1% · Graduate or professional: 9.7% · High school or higher: 89.1% · Bachelor's or higher: 27.8%Oregon · Population 25 years and over: 3,021,010 · Less than high school: 8.3% · High school graduate: 22.4% · Some college, no degree: 24.0% · Associate's degree: 9.2% · Bachelor's degree: 22.3% · Graduate or professional: 13.9% · High school or higher: 91.7% · Bachelor's or higher: 36.2%Pennsylvania · Population 25 years and over: 9,153,146 · Less than high school: 8.1% · High school graduate: 33.2% · Some college, no degree: 15.3% · Associate's degree: 8.9% · Bachelor's degree: 20.6% · Graduate or professional: 13.9% · High school or higher: 91.9% · Bachelor's or higher: 34.5%Rhode Island · Population 25 years and over: 776,505 · Less than high school: 10.5% · High school graduate: 26.5% · Some college, no degree: 17.6% · Associate's degree: 8.1% · Bachelor's degree: 22.2% · Graduate or professional: 15.1% · High school or higher: 89.5% · Bachelor's or higher: 37.3%South Carolina · Population 25 years and over: 3,610,374 · Less than high school: 10.4% · High school graduate: 28.2% · Some college, no degree: 19.9% · Associate's degree: 9.9% · Bachelor's degree: 19.4% · Graduate or professional: 12.0% · High school or higher: 89.6% · Bachelor's or higher: 31.5%South Dakota · Population 25 years and over: 596,137 · Less than high school: 7.0% · High school graduate: 29.5% · Some college, no degree: 20.2% · Associate's degree: 12.2% · Bachelor's degree: 21.5% · Graduate or professional: 9.6% · High school or higher: 93.0% · Bachelor's or higher: 31.1%Tennessee · Population 25 years and over: 4,805,533 · Less than high school: 10.4% · High school graduate: 31.4% · Some college, no degree: 20.0% · Associate's degree: 7.8% · Bachelor's degree: 19.0% · Graduate or professional: 11.4% · High school or higher: 89.6% · Bachelor's or higher: 30.4%Texas · Population 25 years and over: 19,294,631 · Less than high school: 14.3% · High school graduate: 24.3% · Some college, no degree: 20.6% · Associate's degree: 7.7% · Bachelor's degree: 21.1% · Graduate or professional: 11.9% · High school or higher: 85.7% · Bachelor's or higher: 33.1%Utah · Population 25 years and over: 2,003,084 · Less than high school: 6.7% · High school graduate: 22.5% · Some college, no degree: 24.1% · Associate's degree: 9.8% · Bachelor's degree: 24.3% · Graduate or professional: 12.6% · High school or higher: 93.3% · Bachelor's or higher: 36.9%Vermont · Population 25 years and over: 462,996 · Less than high school: 5.5% · High school graduate: 27.3% · Some college, no degree: 16.1% · Associate's degree: 8.5% · Bachelor's degree: 24.7% · Graduate or professional: 18.0% · High school or higher: 94.5% · Bachelor's or higher: 42.6%Virginia · Population 25 years and over: 5,958,915 · Less than high school: 8.7% · High school graduate: 23.9% · Some college, no degree: 18.2% · Associate's degree: 7.8% · Bachelor's degree: 23.3% · Graduate or professional: 18.1% · High school or higher: 91.3% · Bachelor's or higher: 41.5%Washington · Population 25 years and over: 5,409,147 · Less than high school: 7.8% · High school graduate: 21.7% · Some college, no degree: 21.7% · Associate's degree: 10.0% · Bachelor's degree: 23.7% · Graduate or professional: 15.1% · High school or higher: 92.2% · Bachelor's or higher: 38.8%West Virginia · Population 25 years and over: 1,269,202 · Less than high school: 11.4% · High school graduate: 39.5% · Some college, no degree: 17.6% · Associate's degree: 8.2% · Bachelor's degree: 13.9% · Graduate or professional: 9.4% · High school or higher: 88.6% · Bachelor's or higher: 23.3%Wisconsin · Population 25 years and over: 4,069,583 · Less than high school: 6.6% · High school graduate: 29.7% · Some college, no degree: 19.8% · Associate's degree: 11.2% · Bachelor's degree: 21.6% · Graduate or professional: 11.1% · High school or higher: 93.4% · Bachelor's or higher: 32.8%Wyoming · Population 25 years and over: 395,504 · Less than high school: 5.9% · High school graduate: 27.8% · Some college, no degree: 24.5% · Associate's degree: 11.8% · Bachelor's degree: 18.8% · Graduate or professional: 11.1% · High school or higher: 94.1% · Bachelor's or higher: 29.9%District of Columbia · Population 25 years and over: 484,406 · Less than high school: 7.2% · High school graduate: 14.5% · Some college, no degree: 11.8% · Associate's degree: 2.9% · Bachelor's degree: 26.1% · Graduate or professional: 37.5% · High school or higher: 92.8% · Bachelor's or higher: 63.6%District of Columbia · Population 25 years and over: 484,406 · Less than high school: 7.2% · High school graduate: 14.5% · Some college, no degree: 11.8% · Associate's degree: 2.9% · Bachelor's degree: 26.1% · Graduate or professional: 37.5% · High school or higher: 92.8% · Bachelor's or higher: 63.6%Bachelor's or higher23.3%63.6%
Summary

Darker amber is a higher share of adults 25 and over with a bachelor's degree or higher. Puerto Rico is listed in the ranking and table but is not on this map.

A typical published area has 33.7 percent of adults 25 and over with a bachelor's degree or higher, the midpoint of the 50 states, the District of Columbia and Puerto Rico on the 2023 ACS five-year estimates. The District of Columbia leads at 63.6 percent, then Massachusetts at 46.6 percent and Colorado at 44.7 percent. West Virginia is lowest at 23.3 percent. Only the District of Columbia has a bachelor's-or-higher majority. These are each area's own ACS shares of people 25 years and over, not a national average of people.

In short

33.7%typical published areamidpoint bachelor's or higher share, not an average
63.6%District of Columbiahighest bachelor's or higher share
46.6%Massachusettshighest of the 50 states
23.3%West Virginialowest bachelor's or higher share
1area with a bachelor's majorityonly the District of Columbia clears 50 percent
Figure 1

Bachelor's or higher, all published states

Bachelor's or higher · all 52 · ranked high to low

52 items
View100%
DownloadPDFImageCSV
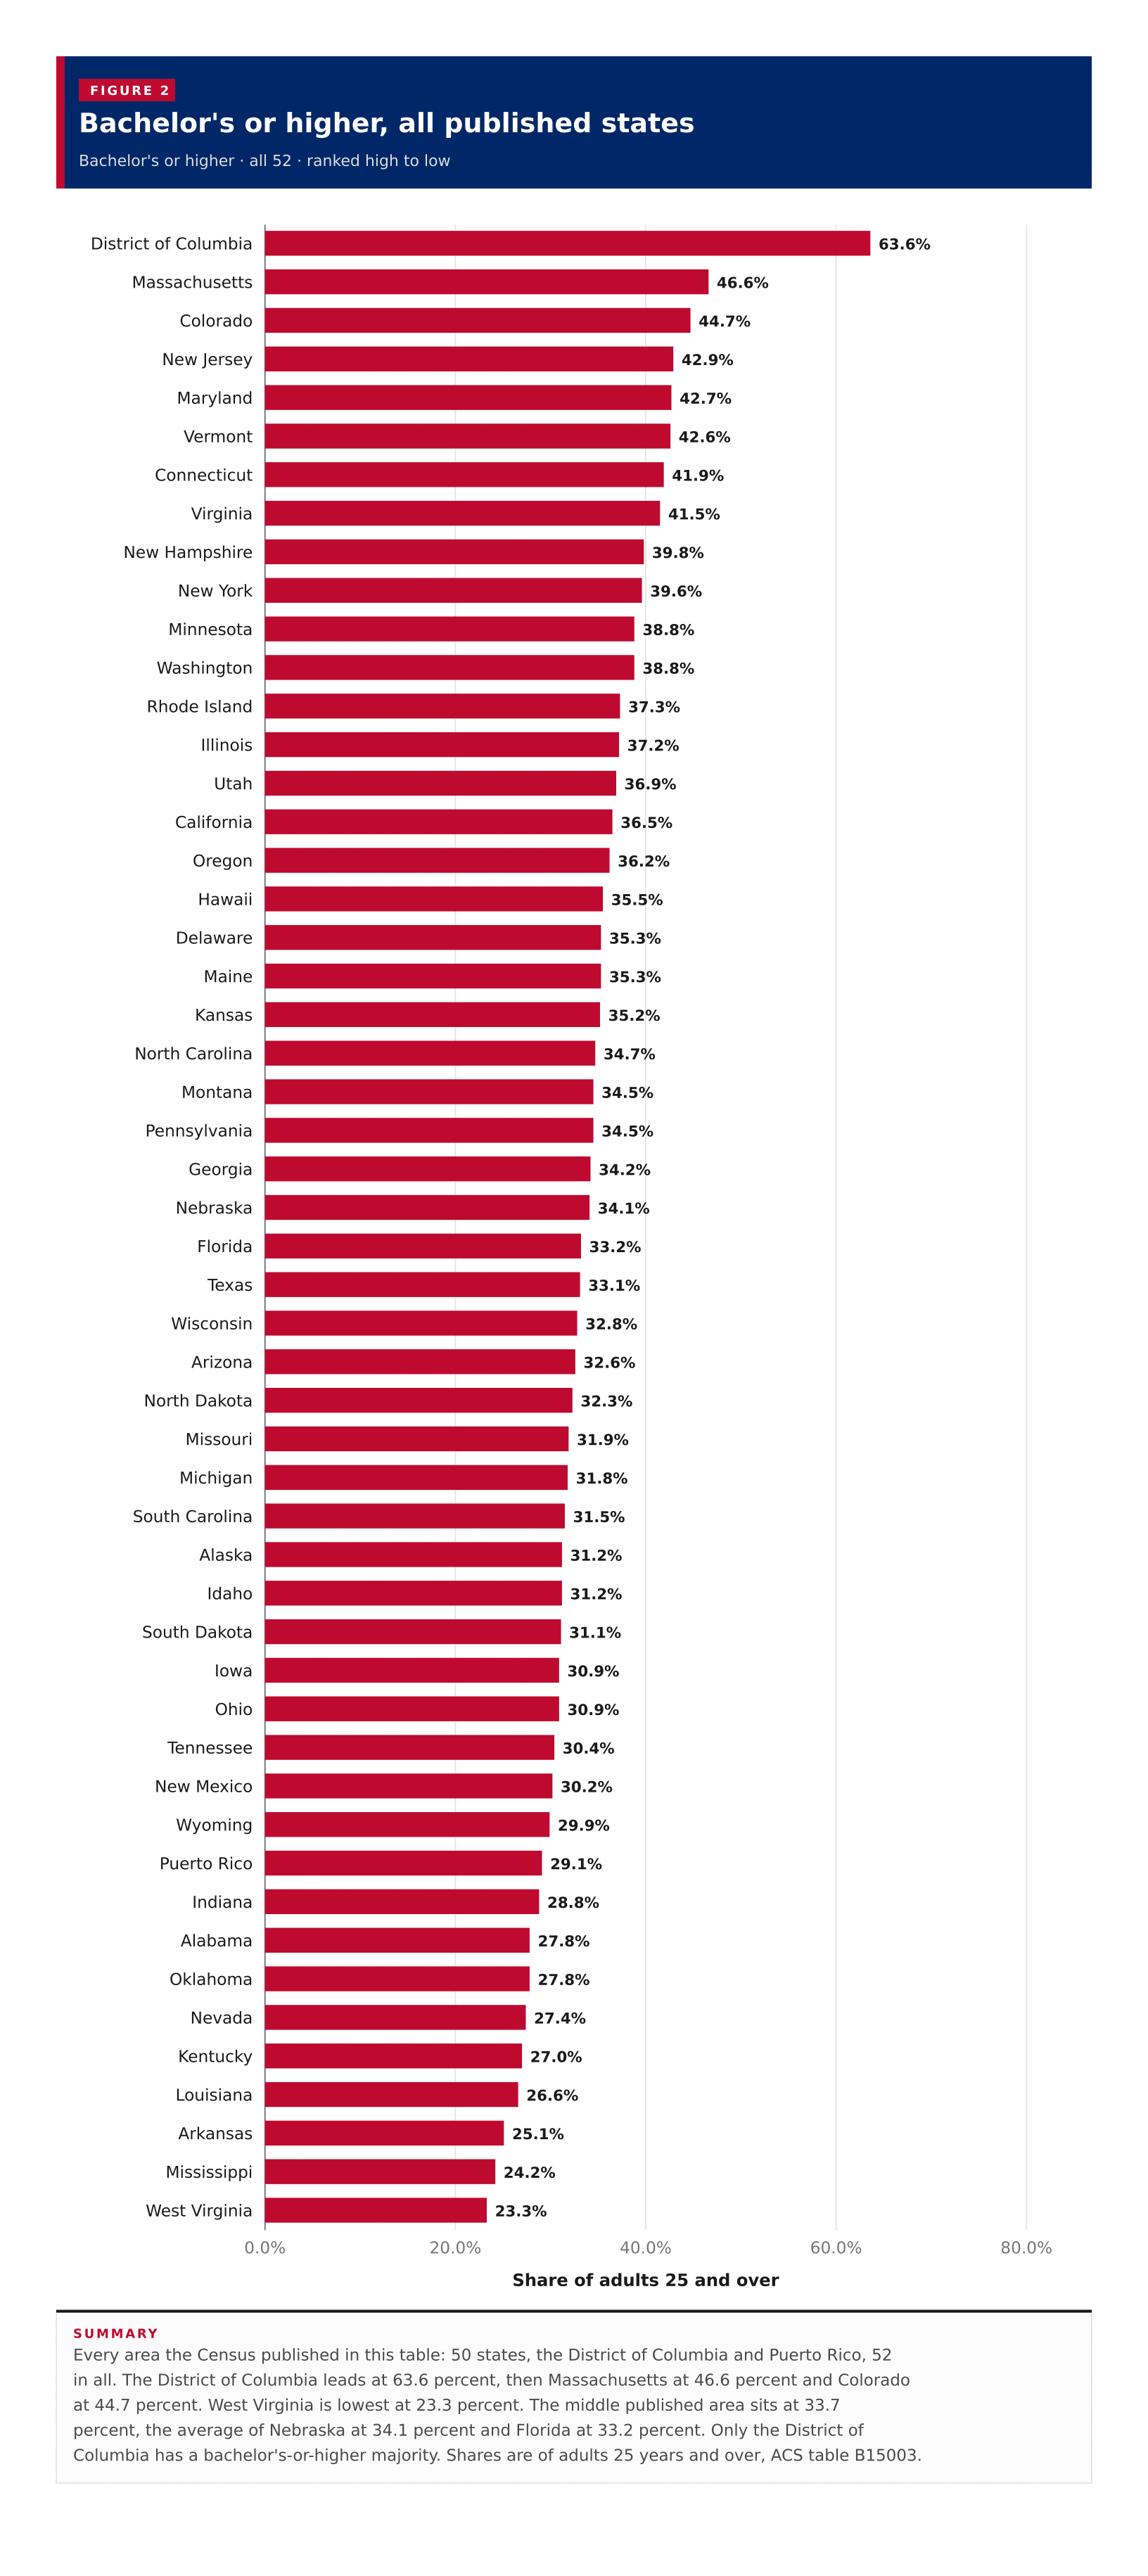
Bachelor's or higher, all published statesEvery area the Census published in this table: 50 states, the District of Columbia and Puerto Rico, 52 in all. The District of Columbia leads at 63.6 percent, then Massachusetts at 46.6 percent and Colorado at 44.7 percent. West Virginia is lowest at 23.3 percent. The middle published area sits at 33.7 percent, the average of Nebraska at 34.1 percent and Florida at 33.2 percent. Only the District of Columbia has a bachelor's-or-higher majority. Shares are of adults 25 years and over, ACS table B15003.0.0%20.0%40.0%60.0%80.0%Share of adults 25 and over63.6%District of Columbia46.6%Massachusetts44.7%Colorado42.9%New Jersey42.7%Maryland42.6%Vermont41.9%Connecticut41.5%Virginia39.8%New Hampshire39.6%New York38.8%Minnesota38.8%Washington37.3%Rhode Island37.2%Illinois36.9%Utah36.5%California36.2%Oregon35.5%Hawaii35.3%Delaware35.3%Maine35.2%Kansas34.7%North Carolina34.5%Montana34.5%Pennsylvania34.2%Georgia34.1%Nebraska33.2%Florida33.1%Texas32.8%Wisconsin32.6%Arizona32.3%North Dakota31.9%Missouri31.8%Michigan31.5%South Carolina31.2%Alaska31.2%Idaho31.1%South Dakota30.9%Iowa30.9%Ohio30.4%Tennessee30.2%New Mexico29.9%Wyoming29.1%Puerto Rico28.8%Indiana27.8%Alabama27.8%Oklahoma27.4%Nevada27.0%Kentucky26.6%Louisiana25.1%Arkansas24.2%Mississippi23.3%West Virginia
Summary

Every area the Census published in this table: 50 states, the District of Columbia and Puerto Rico, 52 in all. The District of Columbia leads at 63.6 percent, then Massachusetts at 46.6 percent and Colorado at 44.7 percent. West Virginia is lowest at 23.3 percent. The middle published area sits at 33.7 percent, the average of Nebraska at 34.1 percent and Florida at 33.2 percent. Only the District of Columbia has a bachelor's-or-higher majority. Shares are of adults 25 years and over, ACS table B15003.

Figure 2

High school or higher, all published states

High school or higher · all 52 · ranked high to low

52 items
View100%
DownloadPDFImageCSV
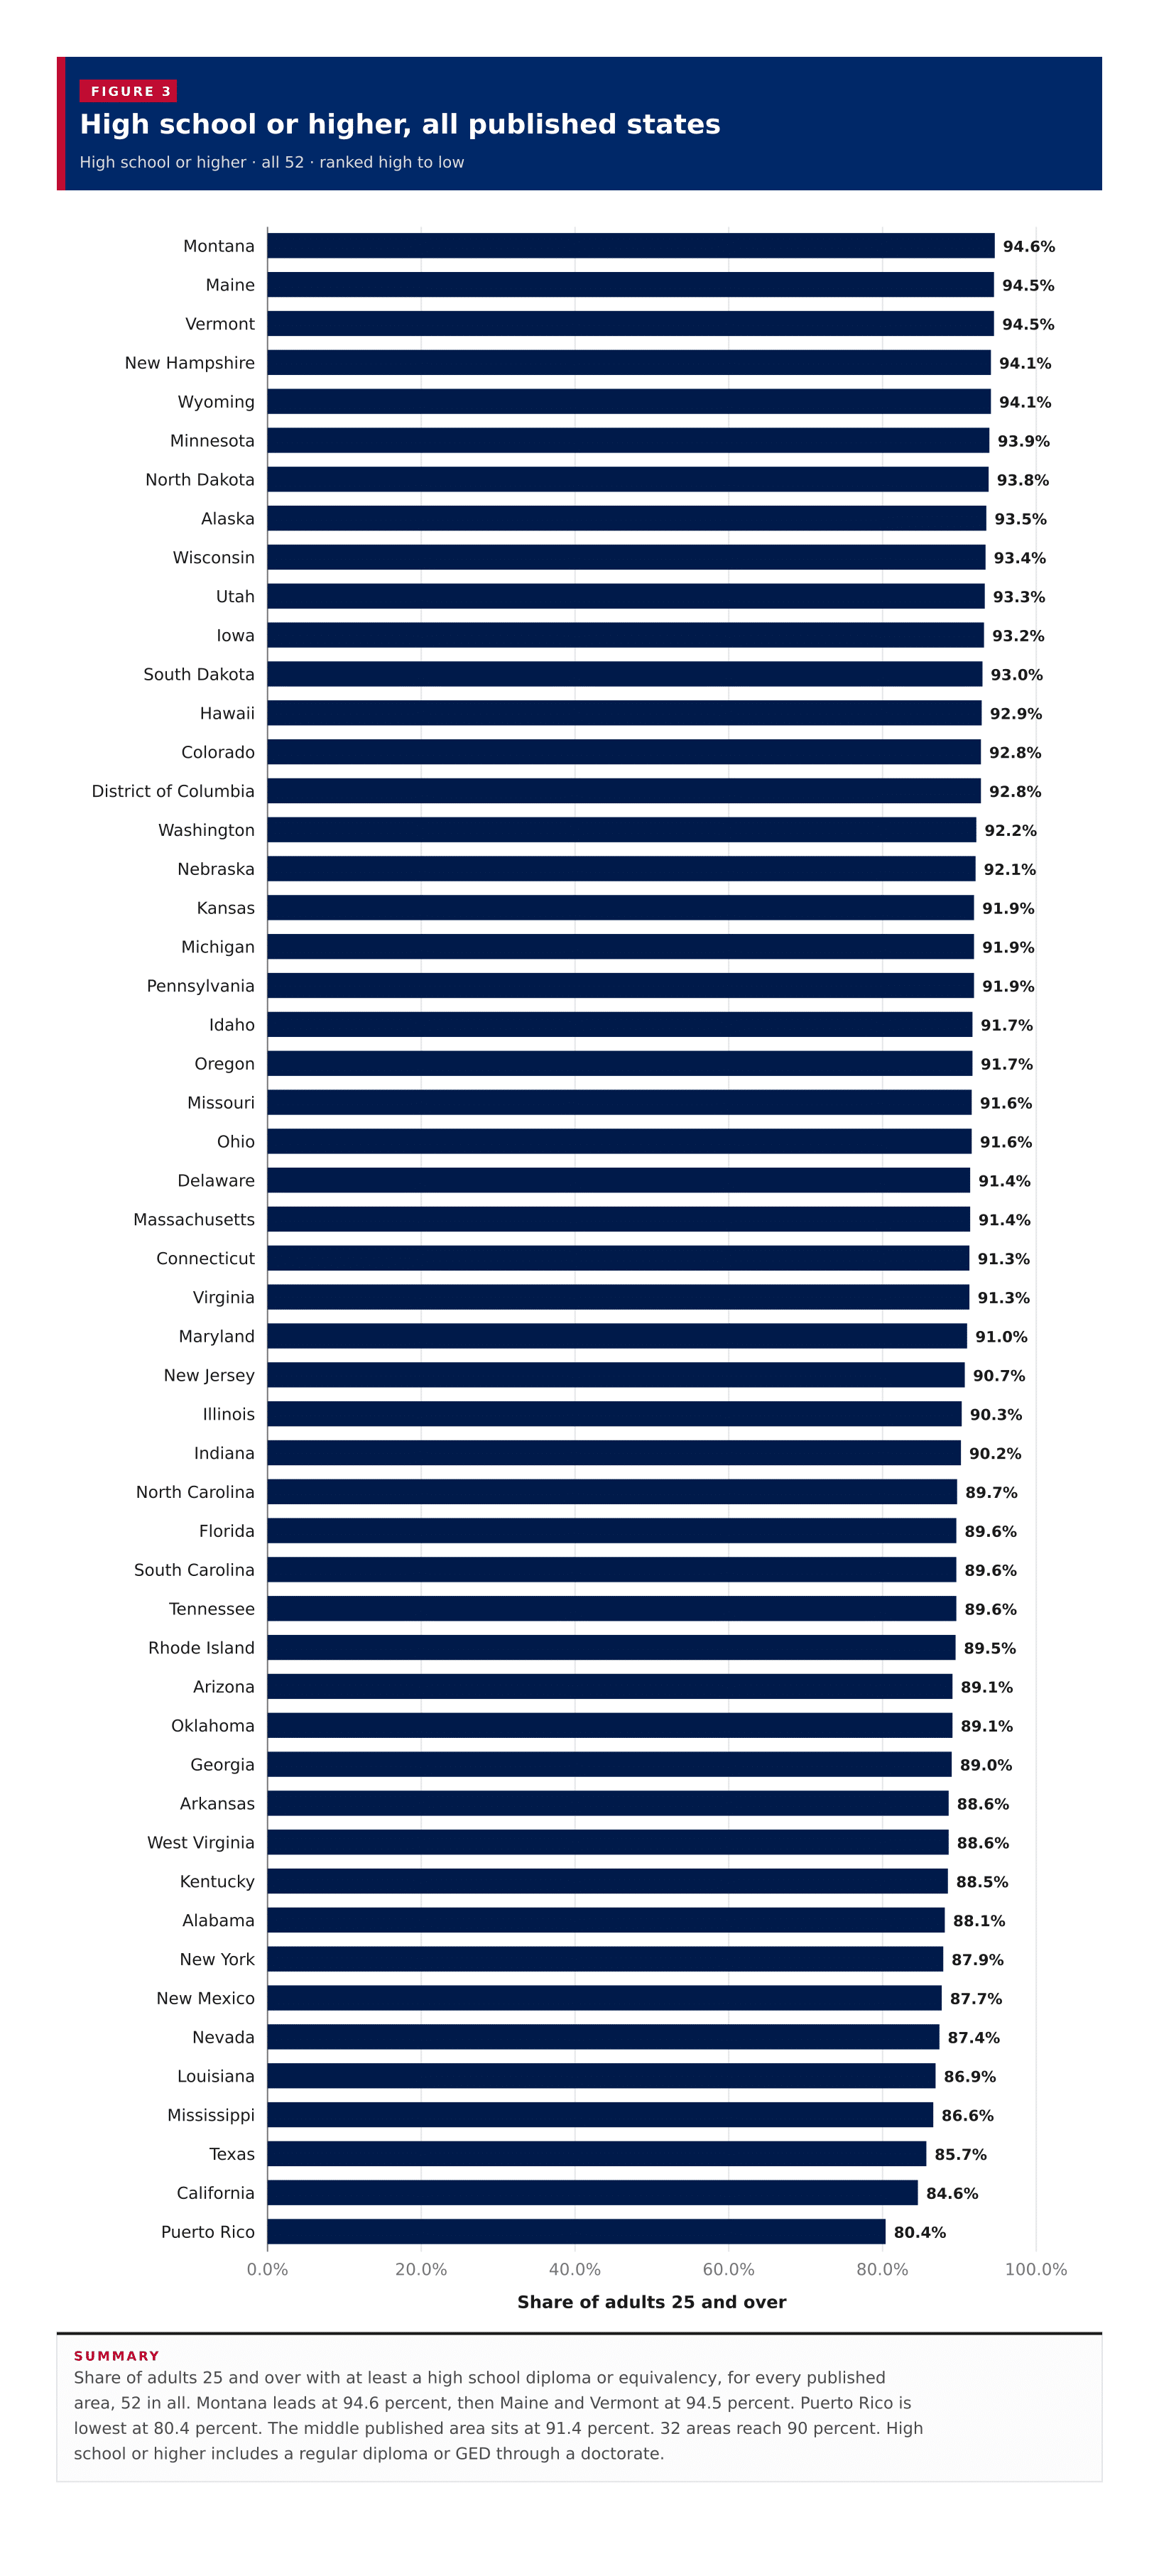
High school or higher, all published statesShare of adults 25 and over with at least a high school diploma or equivalency, for every published area, 52 in all. Montana leads at 94.6 percent, then Maine and Vermont at 94.5 percent. Puerto Rico is lowest at 80.4 percent. The middle published area sits at 91.4 percent. 32 areas reach 90 percent. High school or higher includes a regular diploma or GED through a doctorate.0.0%20.0%40.0%60.0%80.0%100.0%Share of adults 25 and over94.6%Montana94.5%Maine94.5%Vermont94.1%New Hampshire94.1%Wyoming93.9%Minnesota93.8%North Dakota93.5%Alaska93.4%Wisconsin93.3%Utah93.2%Iowa93.0%South Dakota92.9%Hawaii92.8%Colorado92.8%District of Columbia92.2%Washington92.1%Nebraska91.9%Kansas91.9%Michigan91.9%Pennsylvania91.7%Idaho91.7%Oregon91.6%Missouri91.6%Ohio91.4%Delaware91.4%Massachusetts91.3%Connecticut91.3%Virginia91.0%Maryland90.7%New Jersey90.3%Illinois90.2%Indiana89.7%North Carolina89.6%Florida89.6%South Carolina89.6%Tennessee89.5%Rhode Island89.1%Arizona89.1%Oklahoma89.0%Georgia88.6%Arkansas88.6%West Virginia88.5%Kentucky88.1%Alabama87.9%New York87.7%New Mexico87.4%Nevada86.9%Louisiana86.6%Mississippi85.7%Texas84.6%California80.4%Puerto Rico
Summary

Share of adults 25 and over with at least a high school diploma or equivalency, for every published area, 52 in all. Montana leads at 94.6 percent, then Maine and Vermont at 94.5 percent. Puerto Rico is lowest at 80.4 percent. The middle published area sits at 91.4 percent. 32 areas reach 90 percent. High school or higher includes a regular diploma or GED through a doctorate.

Figure 3

Graduate or professional degree, all published states

Graduate or professional · all 52 · ranked high to low

52 items
View100%
DownloadPDFImageCSV
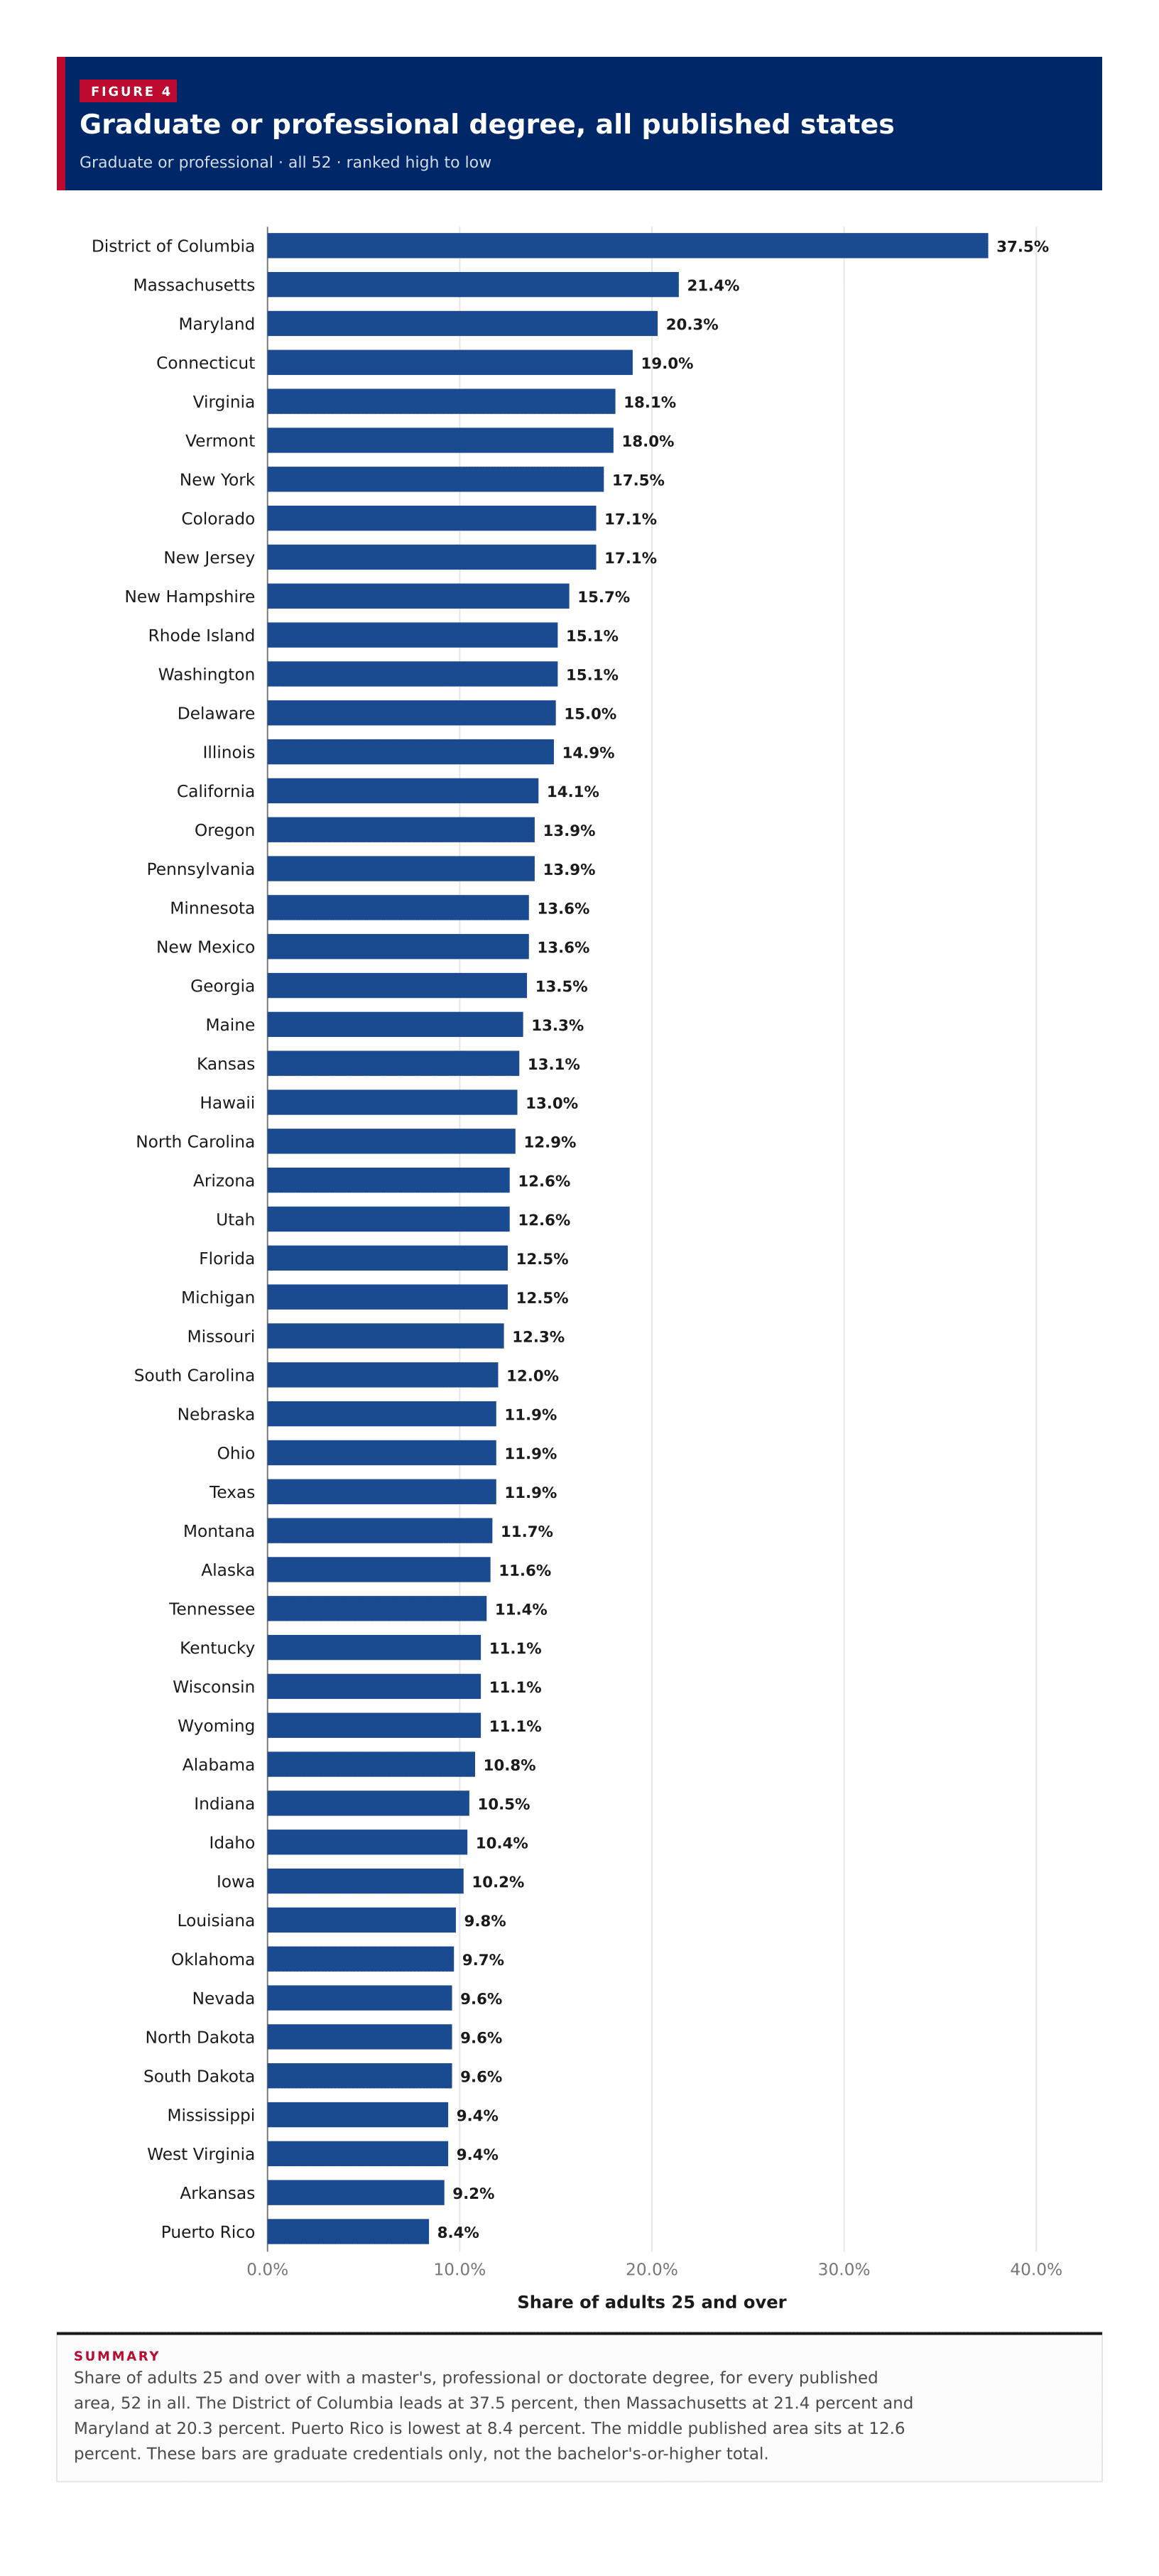
Graduate or professional degree, all published statesShare of adults 25 and over with a master's, professional or doctorate degree, for every published area, 52 in all. The District of Columbia leads at 37.5 percent, then Massachusetts at 21.4 percent and Maryland at 20.3 percent. Puerto Rico is lowest at 8.4 percent. The middle published area sits at 12.6 percent. These bars are graduate credentials only, not the bachelor's-or-higher total.0.0%10.0%20.0%30.0%40.0%Share of adults 25 and over37.5%District of Columbia21.4%Massachusetts20.3%Maryland19.0%Connecticut18.1%Virginia18.0%Vermont17.5%New York17.1%Colorado17.1%New Jersey15.7%New Hampshire15.1%Rhode Island15.1%Washington15.0%Delaware14.9%Illinois14.1%California13.9%Oregon13.9%Pennsylvania13.6%Minnesota13.6%New Mexico13.5%Georgia13.3%Maine13.1%Kansas13.0%Hawaii12.9%North Carolina12.6%Arizona12.6%Utah12.5%Florida12.5%Michigan12.3%Missouri12.0%South Carolina11.9%Nebraska11.9%Ohio11.9%Texas11.7%Montana11.6%Alaska11.4%Tennessee11.1%Kentucky11.1%Wisconsin11.1%Wyoming10.8%Alabama10.5%Indiana10.4%Idaho10.2%Iowa9.8%Louisiana9.7%Oklahoma9.6%Nevada9.6%North Dakota9.6%South Dakota9.4%Mississippi9.4%West Virginia9.2%Arkansas8.4%Puerto Rico
Summary

Share of adults 25 and over with a master's, professional or doctorate degree, for every published area, 52 in all. The District of Columbia leads at 37.5 percent, then Massachusetts at 21.4 percent and Maryland at 20.3 percent. Puerto Rico is lowest at 8.4 percent. The middle published area sits at 12.6 percent. These bars are graduate credentials only, not the bachelor's-or-higher total.

Table 1

All states

52 rows · 10 columns · sorted by bachelor's or higher, high to low

52 rows
View100%
DownloadPDFImageCSV
Summary

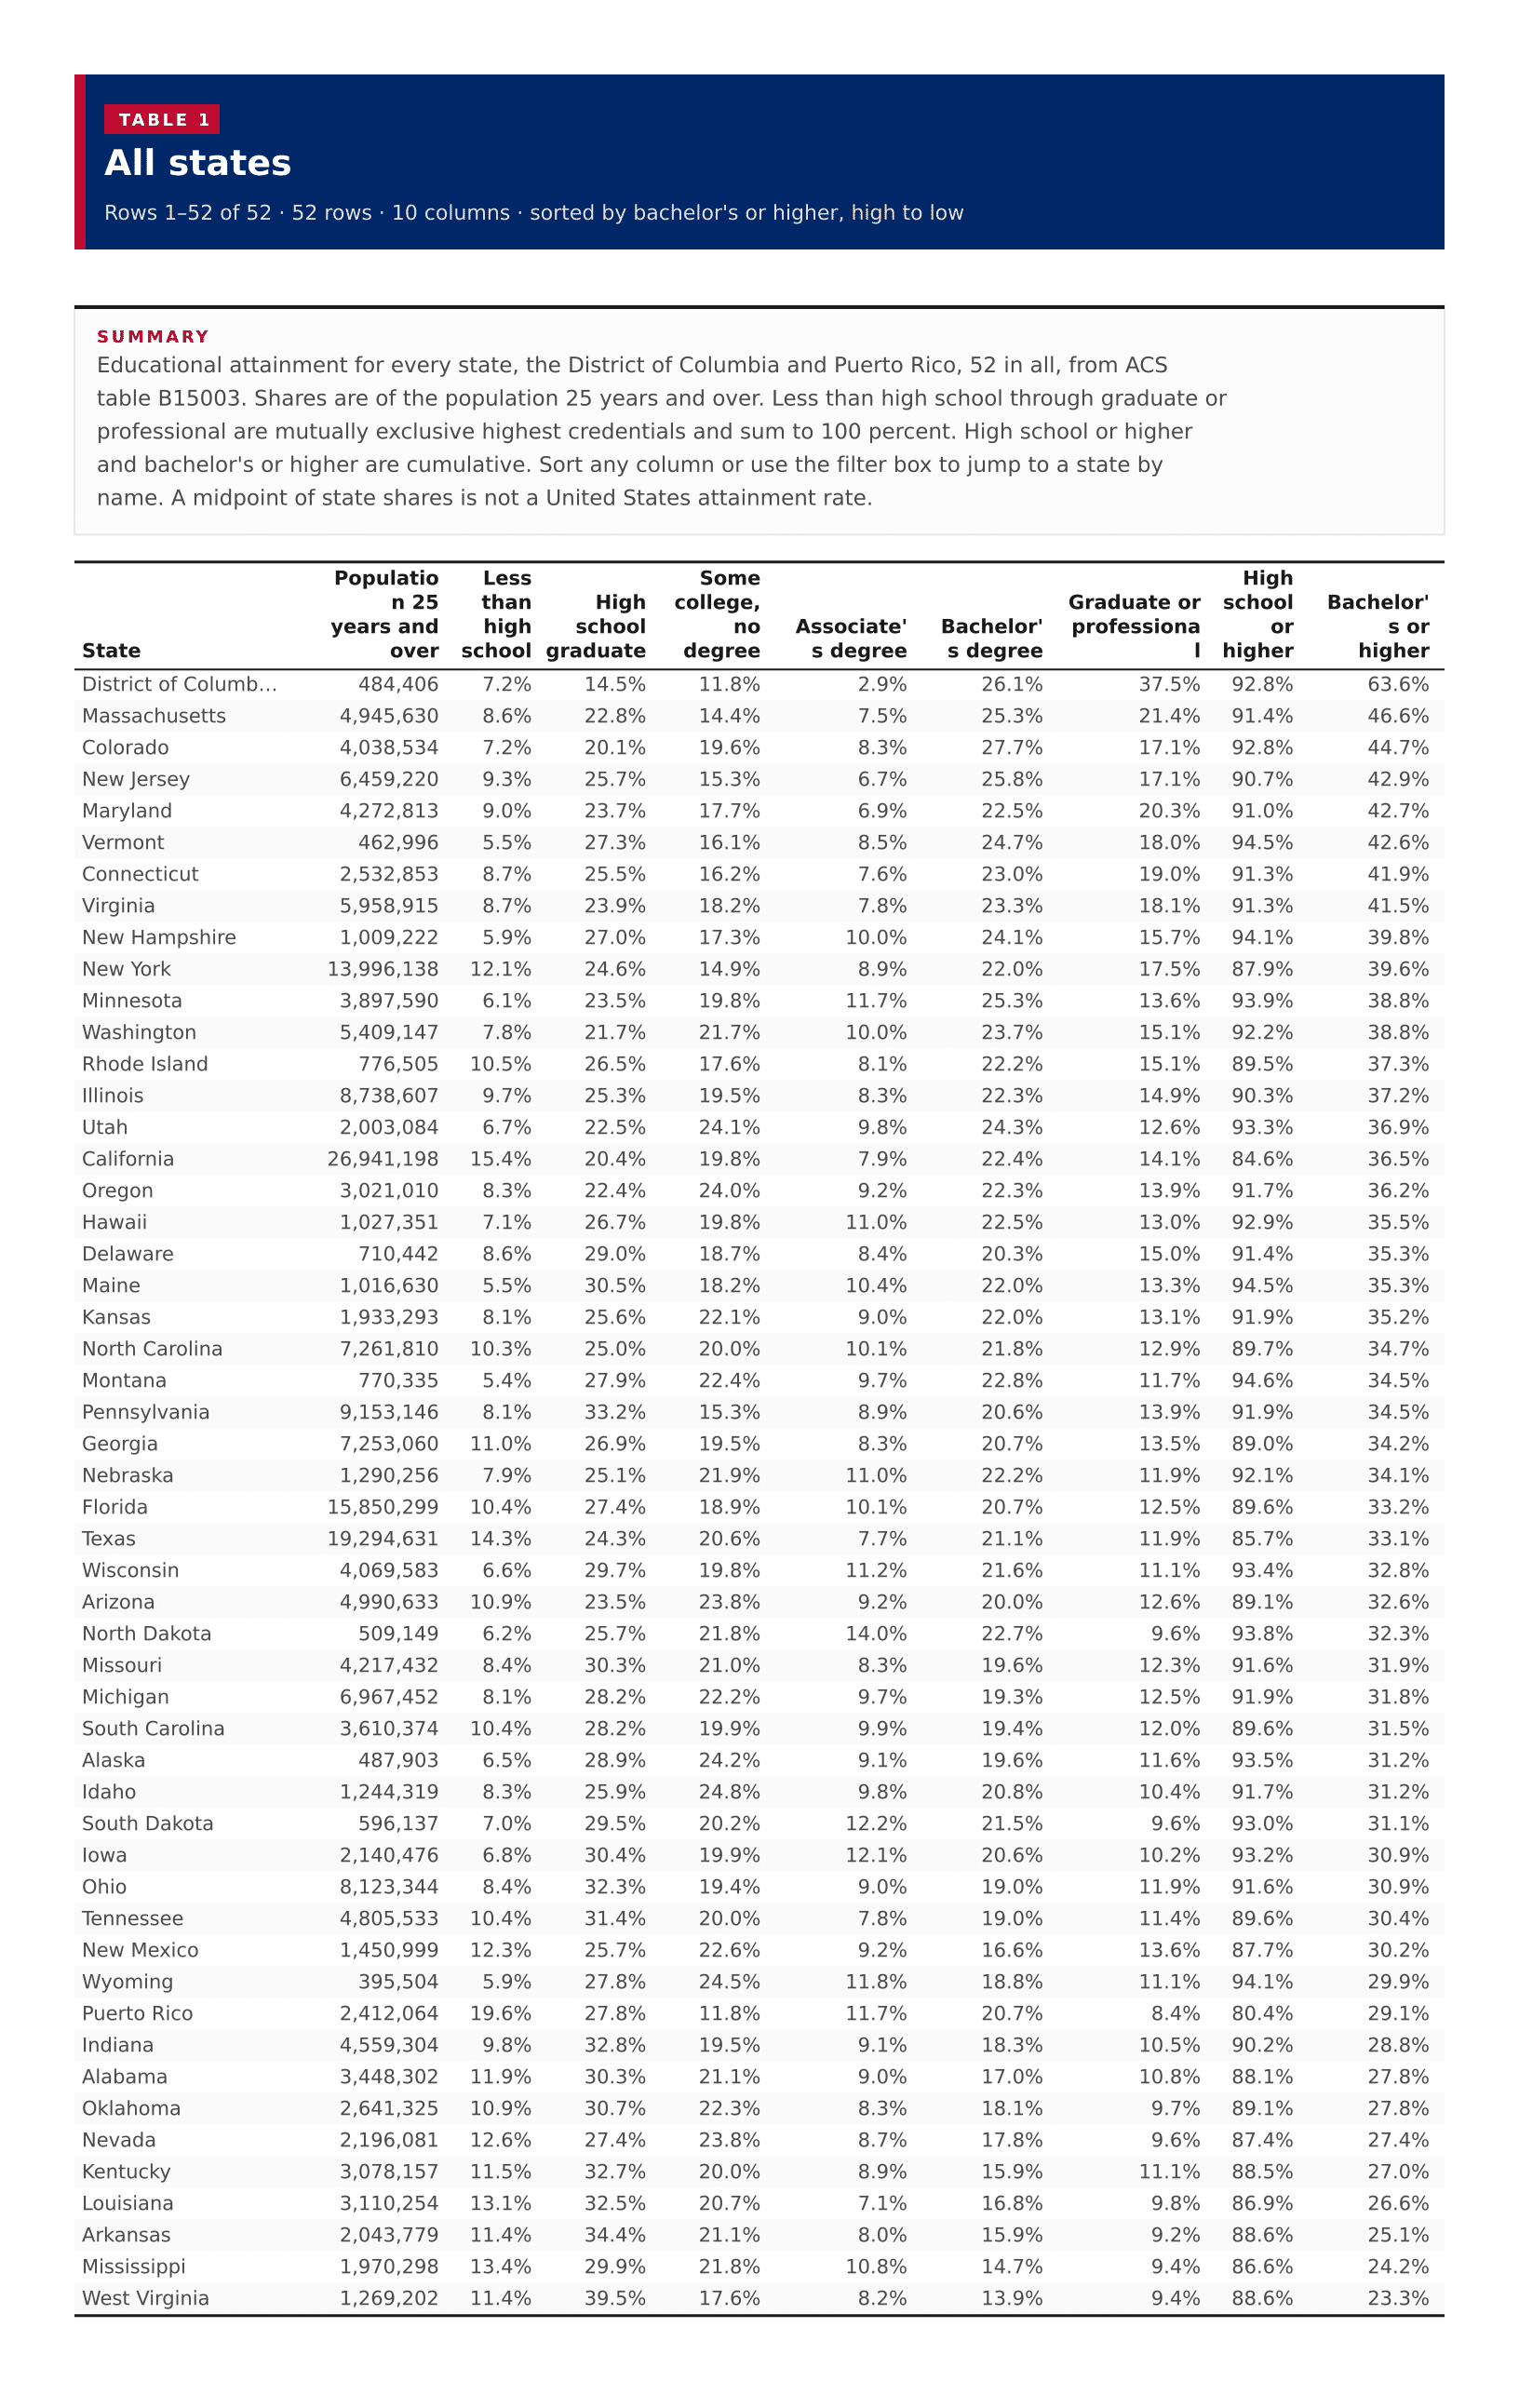
Educational attainment for every state, the District of Columbia and Puerto Rico, 52 in all, from ACS table B15003. Shares are of the population 25 years and over. Less than high school through graduate or professional are mutually exclusive highest credentials and sum to 100 percent. High school or higher and bachelor's or higher are cumulative. Sort any column or use the filter box to jump to a state by name. A midpoint of state shares is not a United States attainment rate.

All states
???????
District of Columbia484,4067.2%14.5%11.8%2.9%26.1%37.5%92.8%63.6%
Massachusetts4,945,6308.6%22.8%14.4%7.5%25.3%21.4%91.4%46.6%
Colorado4,038,5347.2%20.1%19.6%8.3%27.7%17.1%92.8%44.7%
New Jersey6,459,2209.3%25.7%15.3%6.7%25.8%17.1%90.7%42.9%
Maryland4,272,8139.0%23.7%17.7%6.9%22.5%20.3%91.0%42.7%
Vermont462,9965.5%27.3%16.1%8.5%24.7%18.0%94.5%42.6%
Connecticut2,532,8538.7%25.5%16.2%7.6%23.0%19.0%91.3%41.9%
Virginia5,958,9158.7%23.9%18.2%7.8%23.3%18.1%91.3%41.5%
New Hampshire1,009,2225.9%27.0%17.3%10.0%24.1%15.7%94.1%39.8%
New York13,996,13812.1%24.6%14.9%8.9%22.0%17.5%87.9%39.6%
Minnesota3,897,5906.1%23.5%19.8%11.7%25.3%13.6%93.9%38.8%
Washington5,409,1477.8%21.7%21.7%10.0%23.7%15.1%92.2%38.8%
Rhode Island776,50510.5%26.5%17.6%8.1%22.2%15.1%89.5%37.3%
Illinois8,738,6079.7%25.3%19.5%8.3%22.3%14.9%90.3%37.2%
Utah2,003,0846.7%22.5%24.1%9.8%24.3%12.6%93.3%36.9%
California26,941,19815.4%20.4%19.8%7.9%22.4%14.1%84.6%36.5%
Oregon3,021,0108.3%22.4%24.0%9.2%22.3%13.9%91.7%36.2%
Hawaii1,027,3517.1%26.7%19.8%11.0%22.5%13.0%92.9%35.5%
Delaware710,4428.6%29.0%18.7%8.4%20.3%15.0%91.4%35.3%
Maine1,016,6305.5%30.5%18.2%10.4%22.0%13.3%94.5%35.3%
Kansas1,933,2938.1%25.6%22.1%9.0%22.0%13.1%91.9%35.2%
North Carolina7,261,81010.3%25.0%20.0%10.1%21.8%12.9%89.7%34.7%
Montana770,3355.4%27.9%22.4%9.7%22.8%11.7%94.6%34.5%
Pennsylvania9,153,1468.1%33.2%15.3%8.9%20.6%13.9%91.9%34.5%
Georgia7,253,06011.0%26.9%19.5%8.3%20.7%13.5%89.0%34.2%
Nebraska1,290,2567.9%25.1%21.9%11.0%22.2%11.9%92.1%34.1%
Florida15,850,29910.4%27.4%18.9%10.1%20.7%12.5%89.6%33.2%
Texas19,294,63114.3%24.3%20.6%7.7%21.1%11.9%85.7%33.1%
Wisconsin4,069,5836.6%29.7%19.8%11.2%21.6%11.1%93.4%32.8%
Arizona4,990,63310.9%23.5%23.8%9.2%20.0%12.6%89.1%32.6%
North Dakota509,1496.2%25.7%21.8%14.0%22.7%9.6%93.8%32.3%
Missouri4,217,4328.4%30.3%21.0%8.3%19.6%12.3%91.6%31.9%
Michigan6,967,4528.1%28.2%22.2%9.7%19.3%12.5%91.9%31.8%
South Carolina3,610,37410.4%28.2%19.9%9.9%19.4%12.0%89.6%31.5%
Alaska487,9036.5%28.9%24.2%9.1%19.6%11.6%93.5%31.2%
Idaho1,244,3198.3%25.9%24.8%9.8%20.8%10.4%91.7%31.2%
South Dakota596,1377.0%29.5%20.2%12.2%21.5%9.6%93.0%31.1%
Iowa2,140,4766.8%30.4%19.9%12.1%20.6%10.2%93.2%30.9%
Ohio8,123,3448.4%32.3%19.4%9.0%19.0%11.9%91.6%30.9%
Tennessee4,805,53310.4%31.4%20.0%7.8%19.0%11.4%89.6%30.4%
New Mexico1,450,99912.3%25.7%22.6%9.2%16.6%13.6%87.7%30.2%
Wyoming395,5045.9%27.8%24.5%11.8%18.8%11.1%94.1%29.9%
Puerto Rico2,412,06419.6%27.8%11.8%11.7%20.7%8.4%80.4%29.1%
Indiana4,559,3049.8%32.8%19.5%9.1%18.3%10.5%90.2%28.8%
Alabama3,448,30211.9%30.3%21.1%9.0%17.0%10.8%88.1%27.8%
Oklahoma2,641,32510.9%30.7%22.3%8.3%18.1%9.7%89.1%27.8%
Nevada2,196,08112.6%27.4%23.8%8.7%17.8%9.6%87.4%27.4%
Kentucky3,078,15711.5%32.7%20.0%8.9%15.9%11.1%88.5%27.0%
Louisiana3,110,25413.1%32.5%20.7%7.1%16.8%9.8%86.9%26.6%
Arkansas2,043,77911.4%34.4%21.1%8.0%15.9%9.2%88.6%25.1%
Mississippi1,970,29813.4%29.9%21.8%10.8%14.7%9.4%86.6%24.2%
West Virginia1,269,20211.4%39.5%17.6%8.2%13.9%9.4%88.6%23.3%

Image files

Download all

Figure 1

Bachelor's or higher, US states
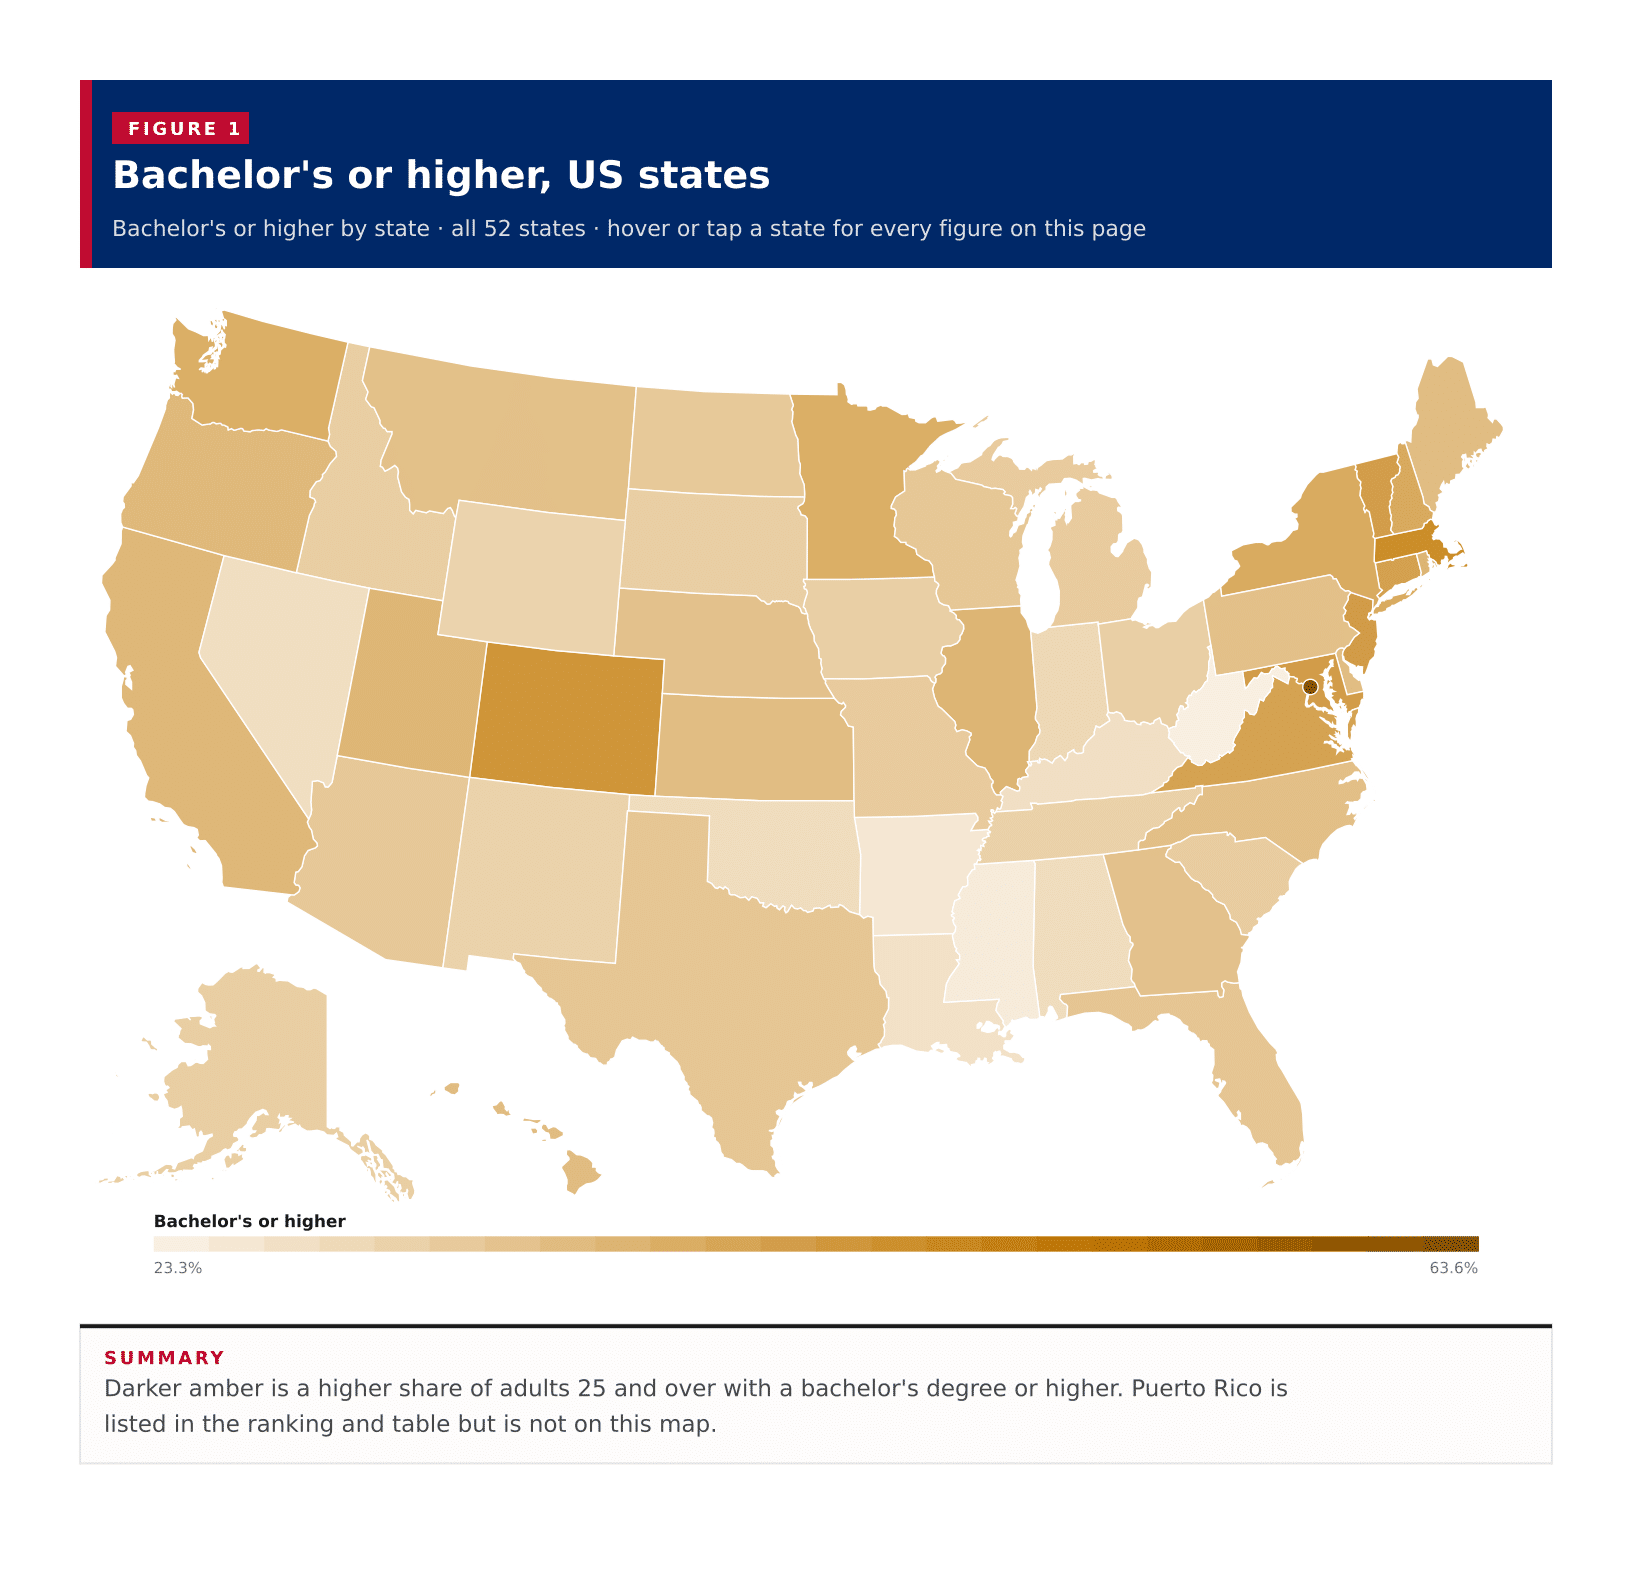
Figure 1: Bachelor's or higher, US states
DownloadPDFImageCSV

Figure 2

Bachelor's or higher, all published states

Figure 2: Bachelor's or higher, all published states
DownloadPDFImageCSV

Figure 3

High school or higher, all published states

Figure 3: High school or higher, all published states
DownloadPDFImageCSV

Figure 4

Graduate or professional degree, all published states

Figure 4: Graduate or professional degree, all published states
DownloadPDFImageCSV

About this data

  • Educational attainment is the highest credential completed among people 25 years and over (ACS table B15003). A person with a master's degree is counted only there, not again as a bachelor's holder. Bachelor's or higher sums bachelor's, master's, professional and doctorate. High school or higher sums a regular diploma or GED through a doctorate.
  • A state share is that area's own ACS estimate. The midpoint of the 52 published areas is not a national figure, because states differ in population.
  • The Census published 50 states, the District of Columbia and Puerto Rico. None of the attainment counts were suppressed.
  • The map covers the 48 contiguous states with Alaska and Hawaii inset. Puerto Rico stays in the ranking and table but is not shaded on the map.