
Education level by US city

Summary

Bachelor's or higher, US cities

Bachelor's or higher by city · all 346 cities · hover or tap a city for every figure on this page

346 items
View100%
DownloadPDFImageCSV
CitiesCambridge, Massachusetts
Bachelor's or higher, US citiesDarker amber is a higher share of adults 25 and over with a bachelor's degree or higher. Each city is a marked point on the US state map. Alaska and Hawaii are inset. Puerto Rico cities are in the ranking and table but are not drawn here.East Los Angeles, California · Population: 114,617 · Population (margin of error): 3,058 · Population 25 years and over: 73,839 · Less than high school: 45.0% · High school graduate: 24.4% · Some college, no degree: 15.8% · Associate's degree: 4.2% · Bachelor's degree: 7.6% · Graduate or professional: 3.0% · High school or higher: 55.0% · Bachelor's or higher: 10.6%Sunrise Manor, Nevada · Population: 199,099 · Population (margin of error): 3,940 · Population 25 years and over: 125,214 · Less than high school: 26.9% · High school graduate: 33.0% · Some college, no degree: 21.4% · Associate's degree: 6.7% · Bachelor's degree: 8.6% · Graduate or professional: 3.3% · High school or higher: 73.1% · Bachelor's or higher: 11.9%Hesperia, California · Population: 100,141 · Population (margin of error): 44 · Population 25 years and over: 60,805 · Less than high school: 22.6% · High school graduate: 33.2% · Some college, no degree: 23.3% · Associate's degree: 8.6% · Bachelor's degree: 8.2% · Graduate or professional: 4.1% · High school or higher: 77.4% · Bachelor's or higher: 12.3%Victorville, California · Population: 135,983 · Population (margin of error): 80 · Population 25 years and over: 81,110 · Less than high school: 22.8% · High school graduate: 31.2% · Some college, no degree: 25.4% · Associate's degree: 8.1% · Bachelor's degree: 8.3% · Graduate or professional: 4.2% · High school or higher: 77.2% · Bachelor's or higher: 12.4%Paterson, New Jersey · Population: 157,660 · Population (margin of error): 137 · Population 25 years and over: 98,657 · Less than high school: 23.9% · High school graduate: 43.0% · Some college, no degree: 15.9% · Associate's degree: 4.7% · Bachelor's degree: 9.5% · Graduate or professional: 2.9% · High school or higher: 76.1% · Bachelor's or higher: 12.5%Rialto, California · Population: 103,866 · Population (margin of error): 60 · Population 25 years and over: 64,313 · Less than high school: 24.3% · High school graduate: 35.8% · Some college, no degree: 21.0% · Associate's degree: 6.4% · Bachelor's degree: 9.2% · Graduate or professional: 3.3% · High school or higher: 75.7% · Bachelor's or higher: 12.5%San Bernardino, California · Population: 221,774 · Population (margin of error): 88 · Population 25 years and over: 136,641 · Less than high school: 26.2% · High school graduate: 34.7% · Some college, no degree: 19.5% · Associate's degree: 6.8% · Bachelor's degree: 9.0% · Graduate or professional: 3.9% · High school or higher: 73.8% · Bachelor's or higher: 12.8%Elizabeth, New Jersey · Population: 135,887 · Population (margin of error): 79 · Population 25 years and over: 88,028 · Less than high school: 25.7% · High school graduate: 38.5% · Some college, no degree: 17.0% · Associate's degree: 4.7% · Bachelor's degree: 9.8% · Graduate or professional: 4.4% · High school or higher: 74.3% · Bachelor's or higher: 14.2%El Monte, California · Population: 107,066 · Population (margin of error): 113 · Population 25 years and over: 73,081 · Less than high school: 35.8% · High school graduate: 28.9% · Some college, no degree: 15.7% · Associate's degree: 4.9% · Bachelor's degree: 11.4% · Graduate or professional: 3.2% · High school or higher: 64.2% · Bachelor's or higher: 14.7%Santa Maria, California · Population: 109,880 · Population (margin of error): 48 · Population 25 years and over: 61,605 · Less than high school: 36.7% · High school graduate: 21.6% · Some college, no degree: 18.9% · Associate's degree: 7.6% · Bachelor's degree: 11.2% · Graduate or professional: 4.0% · High school or higher: 63.3% · Bachelor's or higher: 15.1%Salinas, California · Population: 161,993 · Population (margin of error): 109 · Population 25 years and over: 96,928 · Less than high school: 37.6% · High school graduate: 23.5% · Some college, no degree: 16.1% · Associate's degree: 7.3% · Bachelor's degree: 11.4% · Graduate or professional: 4.1% · High school or higher: 62.4% · Bachelor's or higher: 15.5%Lehigh Acres, Florida · Population: 127,391 · Population (margin of error): 3,339 · Population 25 years and over: 80,265 · Less than high school: 17.9% · High school graduate: 37.0% · Some college, no degree: 17.6% · Associate's degree: 12.0% · Bachelor's degree: 11.2% · Graduate or professional: 4.4% · High school or higher: 82.1% · Bachelor's or higher: 15.6%Jurupa Valley, California · Population: 106,244 · Population (margin of error): 54 · Population 25 years and over: 67,980 · Less than high school: 26.4% · High school graduate: 31.6% · Some college, no degree: 19.0% · Associate's degree: 7.3% · Bachelor's degree: 10.6% · Graduate or professional: 5.0% · High school or higher: 73.6% · Bachelor's or higher: 15.6%West Valley City, Utah · Population: 137,955 · Population (margin of error): 55 · Population 25 years and over: 80,133 · Less than high school: 18.6% · High school graduate: 35.1% · Some college, no degree: 22.0% · Associate's degree: 8.6% · Bachelor's degree: 12.0% · Graduate or professional: 3.7% · High school or higher: 81.4% · Bachelor's or higher: 15.7%Pasadena, Texas · Population: 149,345 · Population (margin of error): 59 · Population 25 years and over: 90,897 · Less than high school: 27.4% · High school graduate: 30.7% · Some college, no degree: 18.8% · Associate's degree: 7.0% · Bachelor's degree: 10.7% · Graduate or professional: 5.4% · High school or higher: 72.6% · Bachelor's or higher: 16.1%Palmdale, California · Population: 165,487 · Population (margin of error): 66 · Population 25 years and over: 101,712 · Less than high school: 23.0% · High school graduate: 30.6% · Some college, no degree: 22.1% · Associate's degree: 7.6% · Bachelor's degree: 11.4% · Graduate or professional: 5.2% · High school or higher: 77.0% · Bachelor's or higher: 16.6%New Bedford, Massachusetts · Population: 100,731 · Population (margin of error): 62 · Population 25 years and over: 67,909 · Less than high school: 23.9% · High school graduate: 34.4% · Some college, no degree: 16.1% · Associate's degree: 8.8% · Bachelor's degree: 11.7% · Graduate or professional: 5.1% · High school or higher: 76.1% · Bachelor's or higher: 16.8%Waterbury, Connecticut · Population: 114,356 · Population (margin of error): 39 · Population 25 years and over: 76,910 · Less than high school: 19.6% · High school graduate: 36.9% · Some college, no degree: 18.7% · Associate's degree: 7.8% · Bachelor's degree: 9.8% · Graduate or professional: 7.2% · High school or higher: 80.4% · Bachelor's or higher: 17.0%Moreno Valley, California · Population: 210,378 · Population (margin of error): 68 · Population 25 years and over: 130,733 · Less than high school: 20.1% · High school graduate: 30.6% · Some college, no degree: 23.5% · Associate's degree: 8.5% · Bachelor's degree: 12.1% · Graduate or professional: 5.3% · High school or higher: 79.9% · Bachelor's or higher: 17.3%Newark, New Jersey · Population: 307,188 · Population (margin of error): 49 · Population 25 years and over: 199,926 · Less than high school: 22.8% · High school graduate: 37.4% · Some college, no degree: 16.9% · Associate's degree: 5.5% · Bachelor's degree: 12.2% · Graduate or professional: 5.2% · High school or higher: 77.2% · Bachelor's or higher: 17.4%Miami Gardens, Florida · Population: 111,264 · Population (margin of error): 111 · Population 25 years and over: 75,379 · Less than high school: 16.5% · High school graduate: 37.3% · Some college, no degree: 19.7% · Associate's degree: 8.9% · Bachelor's degree: 11.6% · Graduate or professional: 6.0% · High school or higher: 83.5% · Bachelor's or higher: 17.6%Detroit, Michigan · Population: 636,644 · Population (margin of error): 159 · Population 25 years and over: 419,121 · Less than high school: 16.6% · High school graduate: 33.2% · Some college, no degree: 25.4% · Associate's degree: 7.2% · Bachelor's degree: 10.5% · Graduate or professional: 7.1% · High school or higher: 83.4% · Bachelor's or higher: 17.6%Santa Ana, California · Population: 311,639 · Population (margin of error): 89 · Population 25 years and over: 204,029 · Less than high school: 33.9% · High school graduate: 26.0% · Some college, no degree: 16.7% · Associate's degree: 5.4% · Bachelor's degree: 12.8% · Graduate or professional: 5.2% · High school or higher: 66.1% · Bachelor's or higher: 18.0%North Las Vegas, Nevada · Population: 270,773 · Population (margin of error): 64 · Population 25 years and over: 174,836 · Less than high school: 17.0% · High school graduate: 32.5% · Some college, no degree: 23.4% · Associate's degree: 8.8% · Bachelor's degree: 12.4% · Graduate or professional: 5.9% · High school or higher: 83.0% · Bachelor's or higher: 18.2%Hartford, Connecticut · Population: 119,970 · Population (margin of error): 53 · Population 25 years and over: 75,847 · Less than high school: 25.7% · High school graduate: 31.9% · Some college, no degree: 18.3% · Associate's degree: 5.8% · Bachelor's degree: 10.3% · Graduate or professional: 7.9% · High school or higher: 74.3% · Bachelor's or higher: 18.3%Odessa, Texas · Population: 114,080 · Population (margin of error): 49 · Population 25 years and over: 69,151 · Less than high school: 18.4% · High school graduate: 30.6% · Some college, no degree: 23.3% · Associate's degree: 9.3% · Bachelor's degree: 12.6% · Graduate or professional: 5.7% · High school or higher: 81.6% · Bachelor's or higher: 18.3%Mesquite, Texas · Population: 148,848 · Population (margin of error): 473 · Population 25 years and over: 93,029 · Less than high school: 19.1% · High school graduate: 30.5% · Some college, no degree: 24.0% · Associate's degree: 7.9% · Bachelor's degree: 12.5% · Graduate or professional: 6.0% · High school or higher: 80.9% · Bachelor's or higher: 18.5%Stockton, California · Population: 320,470 · Population (margin of error): 131 · Population 25 years and over: 201,155 · Less than high school: 22.9% · High school graduate: 28.1% · Some college, no degree: 21.0% · Associate's degree: 8.9% · Bachelor's degree: 13.0% · Graduate or professional: 6.1% · High school or higher: 77.1% · Bachelor's or higher: 19.1%Allentown, Pennsylvania · Population: 125,320 · Population (margin of error): 53 · Population 25 years and over: 78,868 · Less than high school: 18.8% · High school graduate: 37.6% · Some college, no degree: 17.2% · Associate's degree: 6.9% · Bachelor's degree: 13.9% · Graduate or professional: 5.5% · High school or higher: 81.2% · Bachelor's or higher: 19.4%Pomona, California · Population: 148,391 · Population (margin of error): 54 · Population 25 years and over: 97,654 · Less than high school: 25.8% · High school graduate: 26.6% · Some college, no degree: 20.8% · Associate's degree: 7.2% · Bachelor's degree: 13.7% · Graduate or professional: 5.8% · High school or higher: 74.2% · Bachelor's or higher: 19.5%Oxnard, California · Population: 201,014 · Population (margin of error): 62 · Population 25 years and over: 127,885 · Less than high school: 30.8% · High school graduate: 25.4% · Some college, no degree: 16.8% · Associate's degree: 7.3% · Bachelor's degree: 13.4% · Graduate or professional: 6.3% · High school or higher: 69.2% · Bachelor's or higher: 19.6%Springfield, Massachusetts · Population: 154,751 · Population (margin of error): 91 · Population 25 years and over: 97,799 · Less than high school: 20.2% · High school graduate: 33.6% · Some college, no degree: 18.4% · Associate's degree: 8.2% · Bachelor's degree: 10.8% · Graduate or professional: 8.9% · High school or higher: 79.8% · Bachelor's or higher: 19.7%Spring Hill, Florida · Population: 118,814 · Population (margin of error): 2,310 · Population 25 years and over: 86,417 · Less than high school: 10.3% · High school graduate: 32.3% · Some college, no degree: 25.8% · Associate's degree: 11.9% · Bachelor's degree: 13.5% · Graduate or professional: 6.2% · High school or higher: 89.7% · Bachelor's or higher: 19.7%Lancaster, California · Population: 170,013 · Population (margin of error): 62 · Population 25 years and over: 107,692 · Less than high school: 18.0% · High school graduate: 29.6% · Some college, no degree: 23.8% · Associate's degree: 8.6% · Bachelor's degree: 12.7% · Graduate or professional: 7.4% · High school or higher: 82.0% · Bachelor's or higher: 20.1%Kansas City, Kansas · Population: 154,776 · Population (margin of error): 26 · Population 25 years and over: 97,954 · Less than high school: 18.8% · High school graduate: 32.1% · Some college, no degree: 20.5% · Associate's degree: 8.4% · Bachelor's degree: 12.6% · Graduate or professional: 7.6% · High school or higher: 81.2% · Bachelor's or higher: 20.2%Modesto, California · Population: 218,614 · Population (margin of error): 91 · Population 25 years and over: 143,337 · Less than high school: 16.7% · High school graduate: 29.0% · Some college, no degree: 25.2% · Associate's degree: 8.8% · Bachelor's degree: 13.8% · Graduate or professional: 6.5% · High school or higher: 83.3% · Bachelor's or higher: 20.3%Fontana, California · Population: 211,921 · Population (margin of error): 98 · Population 25 years and over: 132,004 · Less than high school: 21.0% · High school graduate: 29.8% · Some college, no degree: 21.5% · Associate's degree: 7.3% · Bachelor's degree: 14.7% · Graduate or professional: 5.7% · High school or higher: 79.0% · Bachelor's or higher: 20.4%Warren, Michigan · Population: 138,128 · Population (margin of error): 56 · Population 25 years and over: 97,247 · Less than high school: 13.8% · High school graduate: 32.5% · Some college, no degree: 23.5% · Associate's degree: 9.8% · Bachelor's degree: 13.5% · Graduate or professional: 6.9% · High school or higher: 86.2% · Bachelor's or higher: 20.4%Dayton, Ohio · Population: 136,741 · Population (margin of error): 70 · Population 25 years and over: 87,305 · Less than high school: 12.9% · High school graduate: 30.9% · Some college, no degree: 27.0% · Associate's degree: 8.5% · Bachelor's degree: 12.9% · Graduate or professional: 7.8% · High school or higher: 87.1% · Bachelor's or higher: 20.7%Ontario, California · Population: 178,347 · Population (margin of error): 66 · Population 25 years and over: 115,395 · Less than high school: 22.1% · High school graduate: 26.6% · Some college, no degree: 22.1% · Associate's degree: 8.5% · Bachelor's degree: 15.1% · Graduate or professional: 5.6% · High school or higher: 77.9% · Bachelor's or higher: 20.7%Independence, Missouri · Population: 121,944 · Population (margin of error): 74 · Population 25 years and over: 83,726 · Less than high school: 9.8% · High school graduate: 37.2% · Some college, no degree: 23.6% · Associate's degree: 8.5% · Bachelor's degree: 13.7% · Graduate or professional: 7.2% · High school or higher: 90.2% · Bachelor's or higher: 20.9%Toledo, Ohio · Population: 268,461 · Population (margin of error): 64 · Population 25 years and over: 179,490 · Less than high school: 12.0% · High school graduate: 33.0% · Some college, no degree: 24.0% · Associate's degree: 10.0% · Bachelor's degree: 13.7% · Graduate or professional: 7.2% · High school or higher: 88.0% · Bachelor's or higher: 21.0%Hialeah, Florida · Population: 221,901 · Population (margin of error): 67 · Population 25 years and over: 166,761 · Less than high school: 24.7% · High school graduate: 33.6% · Some college, no degree: 11.2% · Associate's degree: 9.4% · Bachelor's degree: 14.8% · Graduate or professional: 6.4% · High school or higher: 75.3% · Bachelor's or higher: 21.2%Brockton, Massachusetts · Population: 105,080 · Population (margin of error): 50 · Population 25 years and over: 68,288 · Less than high school: 18.2% · High school graduate: 34.1% · Some college, no degree: 18.8% · Associate's degree: 7.6% · Bachelor's degree: 14.6% · Graduate or professional: 6.7% · High school or higher: 81.8% · Bachelor's or higher: 21.3%Cleveland, Ohio · Population: 367,523 · Population (margin of error): 61 · Population 25 years and over: 254,403 · Less than high school: 16.5% · High school graduate: 33.5% · Some college, no degree: 21.6% · Associate's degree: 7.1% · Bachelor's degree: 12.5% · Graduate or professional: 8.8% · High school or higher: 83.5% · Bachelor's or higher: 21.3%Norwalk, California · Population: 100,713 · Population (margin of error): 59 · Population 25 years and over: 68,395 · Less than high school: 22.7% · High school graduate: 28.1% · Some college, no degree: 20.5% · Associate's degree: 7.3% · Bachelor's degree: 15.8% · Graduate or professional: 5.5% · High school or higher: 77.3% · Bachelor's or higher: 21.3%Laredo, Texas · Population: 255,949 · Population (margin of error): 41 · Population 25 years and over: 145,592 · Less than high school: 29.5% · High school graduate: 22.1% · Some college, no degree: 19.3% · Associate's degree: 7.6% · Bachelor's degree: 15.1% · Graduate or professional: 6.4% · High school or higher: 70.5% · Bachelor's or higher: 21.5%Killeen, Texas · Population: 156,144 · Population (margin of error): 60 · Population 25 years and over: 93,249 · Less than high school: 7.6% · High school graduate: 27.5% · Some college, no degree: 31.5% · Associate's degree: 11.3% · Bachelor's degree: 16.2% · Graduate or professional: 5.9% · High school or higher: 92.4% · Bachelor's or higher: 22.0%El Cajon, California · Population: 104,909 · Population (margin of error): 94 · Population 25 years and over: 68,751 · Less than high school: 15.6% · High school graduate: 28.9% · Some college, no degree: 24.0% · Associate's degree: 9.3% · Bachelor's degree: 15.3% · Graduate or professional: 6.9% · High school or higher: 84.4% · Bachelor's or higher: 22.2%Brownsville, Texas · Population: 188,023 · Population (margin of error): 90 · Population 25 years and over: 110,435 · Less than high school: 29.2% · High school graduate: 24.8% · Some college, no degree: 16.4% · Associate's degree: 7.3% · Bachelor's degree: 15.8% · Graduate or professional: 6.5% · High school or higher: 70.8% · Bachelor's or higher: 22.3%Evansville, Indiana · Population: 116,441 · Population (margin of error): 34 · Population 25 years and over: 80,244 · Less than high school: 10.7% · High school graduate: 34.4% · Some college, no degree: 22.1% · Associate's degree: 10.5% · Bachelor's degree: 15.2% · Graduate or professional: 7.1% · High school or higher: 89.3% · Bachelor's or higher: 22.3%Palm Bay, Florida · Population: 125,273 · Population (margin of error): 104 · Population 25 years and over: 88,665 · Less than high school: 9.2% · High school graduate: 32.6% · Some college, no degree: 23.2% · Associate's degree: 12.3% · Bachelor's degree: 14.4% · Graduate or professional: 8.2% · High school or higher: 90.8% · Bachelor's or higher: 22.6%Menifee, California · Population: 107,020 · Population (margin of error): 63 · Population 25 years and over: 72,718 · Less than high school: 11.3% · High school graduate: 26.1% · Some college, no degree: 28.7% · Associate's degree: 11.0% · Bachelor's degree: 14.9% · Graduate or professional: 7.8% · High school or higher: 88.7% · Bachelor's or higher: 22.7%Pueblo, Colorado · Population: 111,514 · Population (margin of error): 51 · Population 25 years and over: 76,426 · Less than high school: 11.0% · High school graduate: 31.2% · Some college, no degree: 24.0% · Associate's degree: 10.9% · Bachelor's degree: 14.9% · Graduate or professional: 7.9% · High school or higher: 89.0% · Bachelor's or higher: 22.8%Visalia, California · Population: 142,649 · Population (margin of error): 1,065 · Population 25 years and over: 90,069 · Less than high school: 13.5% · High school graduate: 25.9% · Some college, no degree: 26.0% · Associate's degree: 11.8% · Bachelor's degree: 14.3% · Graduate or professional: 8.6% · High school or higher: 86.5% · Bachelor's or higher: 22.9%Bridgeport, Connecticut · Population: 148,012 · Population (margin of error): 100 · Population 25 years and over: 99,097 · Less than high school: 22.2% · High school graduate: 31.7% · Some college, no degree: 16.6% · Associate's degree: 6.4% · Bachelor's degree: 14.5% · Graduate or professional: 8.6% · High school or higher: 77.8% · Bachelor's or higher: 23.1%Rockford, Illinois · Population: 147,649 · Population (margin of error): 300 · Population 25 years and over: 98,609 · Less than high school: 15.1% · High school graduate: 30.1% · Some college, no degree: 22.9% · Associate's degree: 8.7% · Bachelor's degree: 14.9% · Graduate or professional: 8.4% · High school or higher: 84.9% · Bachelor's or higher: 23.2%Bakersfield, California · Population: 408,366 · Population (margin of error): 97 · Population 25 years and over: 247,450 · Less than high school: 18.1% · High school graduate: 25.7% · Some college, no degree: 24.4% · Associate's degree: 8.5% · Bachelor's degree: 15.1% · Graduate or professional: 8.2% · High school or higher: 81.9% · Bachelor's or higher: 23.3%Akron, Ohio · Population: 189,526 · Population (margin of error): 76 · Population 25 years and over: 128,805 · Less than high school: 11.3% · High school graduate: 33.3% · Some college, no degree: 23.8% · Associate's degree: 8.4% · Bachelor's degree: 15.3% · Graduate or professional: 8.0% · High school or higher: 88.7% · Bachelor's or higher: 23.3%Lynn, Massachusetts · Population: 100,905 · Population (margin of error): 83 · Population 25 years and over: 66,710 · Less than high school: 21.6% · High school graduate: 31.4% · Some college, no degree: 15.2% · Associate's degree: 8.5% · Bachelor's degree: 15.5% · Graduate or professional: 7.8% · High school or higher: 78.4% · Bachelor's or higher: 23.3%Glendale, Arizona · Population: 250,193 · Population (margin of error): 86 · Population 25 years and over: 160,787 · Less than high school: 15.5% · High school graduate: 27.7% · Some college, no degree: 24.3% · Associate's degree: 9.0% · Bachelor's degree: 15.4% · Graduate or professional: 8.1% · High school or higher: 84.5% · Bachelor's or higher: 23.5%Gresham, Oregon · Population: 112,818 · Population (margin of error): 58 · Population 25 years and over: 76,676 · Less than high school: 12.8% · High school graduate: 26.7% · Some college, no degree: 26.5% · Associate's degree: 10.4% · Bachelor's degree: 15.2% · Graduate or professional: 8.3% · High school or higher: 87.2% · Bachelor's or higher: 23.6%Nampa, Idaho · Population: 106,289 · Population (margin of error): 52 · Population 25 years and over: 68,421 · Less than high school: 11.0% · High school graduate: 29.8% · Some college, no degree: 25.9% · Associate's degree: 9.6% · Bachelor's degree: 16.8% · Graduate or professional: 6.9% · High school or higher: 89.0% · Bachelor's or higher: 23.6%Paradise, Nevada · Population: 186,178 · Population (margin of error): 4,601 · Population 25 years and over: 133,962 · Less than high school: 14.5% · High school graduate: 30.7% · Some college, no degree: 23.0% · Associate's degree: 7.9% · Bachelor's degree: 16.0% · Graduate or professional: 7.9% · High school or higher: 85.5% · Bachelor's or higher: 23.9%Antioch, California · Population: 115,759 · Population (margin of error): 110 · Population 25 years and over: 78,971 · Less than high school: 14.8% · High school graduate: 27.6% · Some college, no degree: 24.4% · Associate's degree: 9.2% · Bachelor's degree: 17.5% · Graduate or professional: 6.4% · High school or higher: 85.2% · Bachelor's or higher: 23.9%San Tan Valley, Arizona · Population: 105,231 · Population (margin of error): 2,932 · Population 25 years and over: 67,093 · Less than high school: 6.6% · High school graduate: 29.8% · Some college, no degree: 28.3% · Associate's degree: 11.3% · Bachelor's degree: 17.8% · Graduate or professional: 6.2% · High school or higher: 93.4% · Bachelor's or higher: 24.0%Inglewood, California · Population: 105,575 · Population (margin of error): 57 · Population 25 years and over: 73,508 · Less than high school: 22.7% · High school graduate: 22.4% · Some college, no degree: 23.9% · Associate's degree: 6.8% · Bachelor's degree: 16.4% · Graduate or professional: 7.8% · High school or higher: 77.3% · Bachelor's or higher: 24.2%Augusta-Richmond County consolidated government (balance), Georgia · Population: 201,504 · Population (margin of error): 20 · Population 25 years and over: 133,012 · Less than high school: 12.1% · High school graduate: 31.8% · Some college, no degree: 22.2% · Associate's degree: 9.7% · Bachelor's degree: 14.7% · Graduate or professional: 9.5% · High school or higher: 87.9% · Bachelor's or higher: 24.2%Corpus Christi, Texas · Population: 317,383 · Population (margin of error): 78 · Population 25 years and over: 209,285 · Less than high school: 14.2% · High school graduate: 28.6% · Some college, no degree: 23.6% · Associate's degree: 9.2% · Bachelor's degree: 15.8% · Graduate or professional: 8.6% · High school or higher: 85.8% · Bachelor's or higher: 24.3%Spokane Valley, Washington · Population: 105,460 · Population (margin of error): 71 · Population 25 years and over: 73,879 · Less than high school: 5.4% · High school graduate: 29.2% · Some college, no degree: 27.2% · Associate's degree: 13.4% · Bachelor's degree: 16.7% · Graduate or professional: 8.0% · High school or higher: 94.6% · Bachelor's or higher: 24.8%Fresno, California · Population: 543,615 · Population (margin of error): 107 · Population 25 years and over: 337,581 · Less than high school: 19.9% · High school graduate: 22.9% · Some college, no degree: 23.0% · Associate's degree: 9.4% · Bachelor's degree: 16.7% · Graduate or professional: 8.2% · High school or higher: 80.1% · Bachelor's or higher: 24.9%Garden Grove, California · Population: 170,603 · Population (margin of error): 85 · Population 25 years and over: 119,050 · Less than high school: 24.6% · High school graduate: 23.8% · Some college, no degree: 19.0% · Associate's degree: 7.6% · Bachelor's degree: 18.9% · Graduate or professional: 6.0% · High school or higher: 75.4% · Bachelor's or higher: 24.9%Garland, Texas · Population: 245,298 · Population (margin of error): 145 · Population 25 years and over: 156,683 · Less than high school: 20.6% · High school graduate: 25.5% · Some college, no degree: 20.8% · Associate's degree: 8.1% · Bachelor's degree: 16.3% · Graduate or professional: 8.7% · High school or higher: 79.4% · Bachelor's or higher: 25.0%Wichita Falls, Texas · Population: 102,558 · Population (margin of error): 39 · Population 25 years and over: 64,768 · Less than high school: 13.3% · High school graduate: 30.5% · Some college, no degree: 23.3% · Associate's degree: 7.9% · Bachelor's degree: 16.1% · Graduate or professional: 8.9% · High school or higher: 86.7% · Bachelor's or higher: 25.0%Joliet, Illinois · Population: 149,785 · Population (margin of error): 914 · Population 25 years and over: 95,539 · Less than high school: 15.1% · High school graduate: 29.4% · Some college, no degree: 22.1% · Associate's degree: 8.3% · Bachelor's degree: 16.0% · Graduate or professional: 9.0% · High school or higher: 84.9% · Bachelor's or higher: 25.0%Amarillo, Texas · Population: 200,945 · Population (margin of error): 43 · Population 25 years and over: 129,571 · Less than high school: 14.1% · High school graduate: 26.6% · Some college, no degree: 24.7% · Associate's degree: 9.4% · Bachelor's degree: 17.0% · Graduate or professional: 8.1% · High school or higher: 85.9% · Bachelor's or higher: 25.1%Beaumont, Texas · Population: 113,710 · Population (margin of error): 63 · Population 25 years and over: 73,516 · Less than high school: 13.3% · High school graduate: 30.7% · Some college, no degree: 22.1% · Associate's degree: 8.6% · Bachelor's degree: 17.3% · Graduate or professional: 7.9% · High school or higher: 86.7% · Bachelor's or higher: 25.2%Green Bay, Wisconsin · Population: 106,585 · Population (margin of error): 91 · Population 25 years and over: 70,178 · Less than high school: 11.0% · High school graduate: 31.4% · Some college, no degree: 20.4% · Associate's degree: 11.7% · Bachelor's degree: 18.4% · Graduate or professional: 7.1% · High school or higher: 89.0% · Bachelor's or higher: 25.5%Downey, California · Population: 111,793 · Population (margin of error): 61 · Population 25 years and over: 77,220 · Less than high school: 18.7% · High school graduate: 25.2% · Some college, no degree: 21.8% · Associate's degree: 8.7% · Bachelor's degree: 17.8% · Graduate or professional: 7.8% · High school or higher: 81.3% · Bachelor's or higher: 25.6%Cape Coral, Florida · Population: 206,387 · Population (margin of error): 42 · Population 25 years and over: 158,297 · Less than high school: 6.8% · High school graduate: 35.3% · Some college, no degree: 22.6% · Associate's degree: 9.5% · Bachelor's degree: 16.7% · Graduate or professional: 9.0% · High school or higher: 93.2% · Bachelor's or higher: 25.7%Riverside, California · Population: 316,241 · Population (margin of error): 115 · Population 25 years and over: 198,886 · Less than high school: 16.9% · High school graduate: 28.2% · Some college, no degree: 21.3% · Associate's degree: 7.9% · Bachelor's degree: 15.2% · Graduate or professional: 10.5% · High school or higher: 83.1% · Bachelor's or higher: 25.7%Elgin, Illinois · Population: 114,106 · Population (margin of error): 399 · Population 25 years and over: 74,032 · Less than high school: 18.8% · High school graduate: 25.8% · Some college, no degree: 21.2% · Associate's degree: 8.3% · Bachelor's degree: 16.9% · Graduate or professional: 9.1% · High school or higher: 81.2% · Bachelor's or higher: 26.0%Macon-Bibb County, Georgia · Population: 156,543 · Population 25 years and over: 103,355 · Less than high school: 12.6% · High school graduate: 31.2% · Some college, no degree: 22.2% · Associate's degree: 8.1% · Bachelor's degree: 12.9% · Graduate or professional: 13.1% · High school or higher: 87.4% · Bachelor's or higher: 26.0%Sparks, Nevada · Population: 109,106 · Population (margin of error): 75 · Population 25 years and over: 74,138 · Less than high school: 12.9% · High school graduate: 25.6% · Some college, no degree: 25.7% · Associate's degree: 9.5% · Bachelor's degree: 16.9% · Graduate or professional: 9.4% · High school or higher: 87.1% · Bachelor's or higher: 26.3%Milwaukee, Wisconsin · Population: 569,756 · Population (margin of error): 49 · Population 25 years and over: 357,726 · Less than high school: 14.5% · High school graduate: 30.8% · Some college, no degree: 20.9% · Associate's degree: 7.3% · Bachelor's degree: 17.2% · Graduate or professional: 9.4% · High school or higher: 85.5% · Bachelor's or higher: 26.6%Fairfield, California · Population: 119,985 · Population (margin of error): 50 · Population 25 years and over: 79,665 · Less than high school: 12.9% · High school graduate: 24.6% · Some college, no degree: 25.1% · Associate's degree: 10.8% · Bachelor's degree: 17.8% · Graduate or professional: 8.9% · High school or higher: 87.1% · Bachelor's or higher: 26.7%Greeley, Colorado · Population: 109,421 · Population (margin of error): 62 · Population 25 years and over: 68,209 · Less than high school: 16.8% · High school graduate: 25.5% · Some college, no degree: 21.9% · Associate's degree: 9.0% · Bachelor's degree: 15.9% · Graduate or professional: 10.8% · High school or higher: 83.2% · Bachelor's or higher: 26.7%Port St. Lucie, Florida · Population: 220,453 · Population (margin of error): 73 · Population 25 years and over: 159,144 · Less than high school: 9.1% · High school graduate: 31.1% · Some college, no degree: 21.5% · Associate's degree: 11.5% · Bachelor's degree: 17.7% · Graduate or professional: 9.1% · High school or higher: 90.9% · Bachelor's or higher: 26.8%Abilene, Texas · Population: 127,130 · Population (margin of error): 262 · Population 25 years and over: 78,630 · Less than high school: 11.7% · High school graduate: 30.1% · Some college, no degree: 21.6% · Associate's degree: 9.6% · Bachelor's degree: 17.6% · Graduate or professional: 9.5% · High school or higher: 88.3% · Bachelor's or higher: 27.1%Las Vegas, Nevada · Population: 650,873 · Population (margin of error): 108 · Population 25 years and over: 449,189 · Less than high school: 14.2% · High school graduate: 26.7% · Some college, no degree: 23.7% · Associate's degree: 8.1% · Bachelor's degree: 17.3% · Graduate or professional: 10.0% · High school or higher: 85.8% · Bachelor's or higher: 27.3%El Paso, Texas · Population: 678,147 · Population (margin of error): 153 · Population 25 years and over: 434,183 · Less than high school: 18.1% · High school graduate: 24.4% · Some college, no degree: 21.3% · Associate's degree: 8.8% · Bachelor's degree: 18.3% · Graduate or professional: 9.2% · High school or higher: 81.9% · Bachelor's or higher: 27.5%Hampton, Virginia · Population: 137,334 · Population 25 years and over: 93,055 · Less than high school: 7.3% · High school graduate: 29.2% · Some college, no degree: 25.5% · Associate's degree: 10.5% · Bachelor's degree: 17.1% · Graduate or professional: 10.4% · High school or higher: 92.7% · Bachelor's or higher: 27.5%Shreveport, Louisiana · Population: 183,483 · Population (margin of error): 60 · Population 25 years and over: 124,298 · Less than high school: 12.7% · High school graduate: 30.4% · Some college, no degree: 22.8% · Associate's degree: 6.6% · Bachelor's degree: 15.5% · Graduate or professional: 12.0% · High school or higher: 87.3% · Bachelor's or higher: 27.5%Vacaville, California · Population: 102,085 · Population (margin of error): 63 · Population 25 years and over: 71,468 · Less than high school: 8.5% · High school graduate: 24.9% · Some college, no degree: 27.6% · Associate's degree: 11.4% · Bachelor's degree: 18.9% · Graduate or professional: 8.7% · High school or higher: 91.5% · Bachelor's or higher: 27.6%Lakeland, Florida · Population: 117,030 · Population (margin of error): 64 · Population 25 years and over: 80,937 · Less than high school: 9.4% · High school graduate: 31.8% · Some college, no degree: 21.4% · Associate's degree: 9.7% · Bachelor's degree: 17.7% · Graduate or professional: 9.9% · High school or higher: 90.6% · Bachelor's or higher: 27.7%Escondido, California · Population: 149,913 · Population (margin of error): 83 · Population 25 years and over: 102,895 · Less than high school: 19.6% · High school graduate: 23.2% · Some college, no degree: 21.4% · Associate's degree: 8.0% · Bachelor's degree: 18.3% · Graduate or professional: 9.5% · High school or higher: 80.4% · Bachelor's or higher: 27.8%Vallejo, California · Population: 124,637 · Population (margin of error): 70 · Population 25 years and over: 88,703 · Less than high school: 12.5% · High school graduate: 24.8% · Some college, no degree: 25.6% · Associate's degree: 9.2% · Bachelor's degree: 19.7% · Graduate or professional: 8.2% · High school or higher: 87.5% · Bachelor's or higher: 27.9%North Charleston, South Carolina · Population: 117,460 · Population (margin of error): 80 · Population 25 years and over: 79,295 · Less than high school: 13.3% · High school graduate: 26.6% · Some college, no degree: 22.0% · Associate's degree: 10.1% · Bachelor's degree: 18.2% · Graduate or professional: 9.8% · High school or higher: 86.7% · Bachelor's or higher: 28.0%Memphis, Tennessee · Population: 629,063 · Population (margin of error): 84 · Population 25 years and over: 412,059 · Less than high school: 12.6% · High school graduate: 30.6% · Some college, no degree: 22.5% · Associate's degree: 6.1% · Bachelor's degree: 16.9% · Graduate or professional: 11.3% · High school or higher: 87.4% · Bachelor's or higher: 28.2%Fort Wayne, Indiana · Population: 266,235 · Population (margin of error): 395 · Population 25 years and over: 173,982 · Less than high school: 11.1% · High school graduate: 28.7% · Some college, no degree: 21.8% · Associate's degree: 9.9% · Bachelor's degree: 19.4% · Graduate or professional: 9.1% · High school or higher: 88.9% · Bachelor's or higher: 28.5%Jackson, Mississippi · Population: 149,827 · Population (margin of error): 70 · Population 25 years and over: 96,528 · Less than high school: 13.5% · High school graduate: 25.3% · Some college, no degree: 24.0% · Associate's degree: 8.6% · Bachelor's degree: 16.2% · Graduate or professional: 12.4% · High school or higher: 86.5% · Bachelor's or higher: 28.6%Fayetteville, North Carolina · Population: 209,692 · Population (margin of error): 87 · Population 25 years and over: 129,800 · Less than high school: 6.6% · High school graduate: 25.6% · Some college, no degree: 27.6% · Associate's degree: 11.6% · Bachelor's degree: 18.6% · Graduate or professional: 10.0% · High school or higher: 93.4% · Bachelor's or higher: 28.6%Waco, Texas · Population: 141,925 · Population (margin of error): 137 · Population 25 years and over: 81,079 · Less than high school: 13.8% · High school graduate: 26.9% · Some college, no degree: 22.0% · Associate's degree: 8.6% · Bachelor's degree: 17.4% · Graduate or professional: 11.2% · High school or higher: 86.2% · Bachelor's or higher: 28.6%West Jordan, Utah · Population: 116,277 · Population (margin of error): 73 · Population 25 years and over: 71,516 · Less than high school: 8.8% · High school graduate: 26.7% · Some college, no degree: 24.3% · Associate's degree: 11.6% · Bachelor's degree: 20.1% · Graduate or professional: 8.5% · High school or higher: 91.2% · Bachelor's or higher: 28.6%San Antonio, Texas · Population: 1,458,954 · Population (margin of error): 118 · Population 25 years and over: 954,365 · Less than high school: 15.7% · High school graduate: 25.6% · Some college, no degree: 21.8% · Associate's degree: 8.2% · Bachelor's degree: 17.7% · Graduate or professional: 11.0% · High school or higher: 84.3% · Bachelor's or higher: 28.7%Anaheim, California · Population: 344,553 · Population (margin of error): 138 · Population 25 years and over: 232,546 · Less than high school: 22.5% · High school graduate: 21.7% · Some college, no degree: 19.4% · Associate's degree: 7.7% · Bachelor's degree: 19.5% · Graduate or professional: 9.3% · High school or higher: 77.5% · Bachelor's or higher: 28.8%Everett, Washington · Population: 111,083 · Population (margin of error): 80 · Population 25 years and over: 78,949 · Less than high school: 11.0% · High school graduate: 26.2% · Some college, no degree: 24.6% · Associate's degree: 9.3% · Bachelor's degree: 19.8% · Graduate or professional: 9.1% · High school or higher: 89.0% · Bachelor's or higher: 28.9%Edinburg, Texas · Population: 102,561 · Population (margin of error): 51 · Population 25 years and over: 60,404 · Less than high school: 19.3% · High school graduate: 23.2% · Some college, no degree: 22.7% · Associate's degree: 6.0% · Bachelor's degree: 19.5% · Graduate or professional: 9.4% · High school or higher: 80.7% · Bachelor's or higher: 28.9%Des Moines, Iowa · Population: 212,464 · Population (margin of error): 185 · Population 25 years and over: 140,840 · Less than high school: 12.7% · High school graduate: 29.1% · Some college, no degree: 20.0% · Associate's degree: 9.1% · Bachelor's degree: 19.9% · Graduate or professional: 9.1% · High school or higher: 87.3% · Bachelor's or higher: 29.0%Grand Prairie, Texas · Population: 198,564 · Population (margin of error): 92 · Population 25 years and over: 124,382 · Less than high school: 18.3% · High school graduate: 25.2% · Some college, no degree: 19.1% · Associate's degree: 8.4% · Bachelor's degree: 19.8% · Graduate or professional: 9.2% · High school or higher: 81.7% · Bachelor's or higher: 29.1%Newport News, Virginia · Population: 184,774 · Population 25 years and over: 120,364 · Less than high school: 8.2% · High school graduate: 29.8% · Some college, no degree: 22.6% · Associate's degree: 10.3% · Bachelor's degree: 17.7% · Graduate or professional: 11.4% · High school or higher: 91.8% · Bachelor's or higher: 29.1%Topeka, Kansas · Population: 126,103 · Population (margin of error): 43 · Population 25 years and over: 84,956 · Less than high school: 8.2% · High school graduate: 31.9% · Some college, no degree: 22.9% · Associate's degree: 7.9% · Bachelor's degree: 18.5% · Graduate or professional: 10.6% · High school or higher: 91.8% · Bachelor's or higher: 29.1%Kent, Washington · Population: 135,015 · Population (margin of error): 73 · Population 25 years and over: 90,499 · Less than high school: 13.1% · High school graduate: 24.9% · Some college, no degree: 21.6% · Associate's degree: 11.0% · Bachelor's degree: 21.1% · Graduate or professional: 8.2% · High school or higher: 86.9% · Bachelor's or higher: 29.4%South Bend, Indiana · Population: 102,866 · Population (margin of error): 612 · Population 25 years and over: 65,946 · Less than high school: 12.3% · High school graduate: 29.7% · Some college, no degree: 20.0% · Associate's degree: 8.5% · Bachelor's degree: 16.9% · Graduate or professional: 12.5% · High school or higher: 87.7% · Bachelor's or higher: 29.4%Lansing, Michigan · Population: 112,546 · Population (margin of error): 66 · Population 25 years and over: 74,505 · Less than high school: 10.1% · High school graduate: 25.1% · Some college, no degree: 24.9% · Associate's degree: 10.2% · Bachelor's degree: 18.3% · Graduate or professional: 11.3% · High school or higher: 89.9% · Bachelor's or higher: 29.6%Columbus, Georgia · Population: 204,383 · Population 25 years and over: 134,732 · Less than high school: 11.0% · High school graduate: 26.8% · Some college, no degree: 22.8% · Associate's degree: 9.6% · Bachelor's degree: 17.6% · Graduate or professional: 12.2% · High school or higher: 89.0% · Bachelor's or higher: 29.7%West Covina, California · Population: 107,436 · Population (margin of error): 76 · Population 25 years and over: 77,130 · Less than high school: 14.6% · High school graduate: 26.3% · Some college, no degree: 20.0% · Associate's degree: 9.3% · Bachelor's degree: 21.4% · Graduate or professional: 8.5% · High school or higher: 85.4% · Bachelor's or higher: 29.8%Lowell, Massachusetts · Population: 114,799 · Population (margin of error): 46 · Population 25 years and over: 76,357 · Less than high school: 16.7% · High school graduate: 30.8% · Some college, no degree: 15.0% · Associate's degree: 7.6% · Bachelor's degree: 18.0% · Graduate or professional: 11.9% · High school or higher: 83.3% · Bachelor's or higher: 29.9%Rochester, New York · Population: 209,720 · Population (margin of error): 114 · Population 25 years and over: 139,421 · Less than high school: 15.6% · High school graduate: 27.8% · Some college, no degree: 16.7% · Associate's degree: 10.0% · Bachelor's degree: 17.3% · Graduate or professional: 12.6% · High school or higher: 84.4% · Bachelor's or higher: 29.9%Davenport, Iowa · Population: 101,083 · Population (margin of error): 34 · Population 25 years and over: 69,218 · Less than high school: 7.4% · High school graduate: 28.8% · Some college, no degree: 22.1% · Associate's degree: 11.7% · Bachelor's degree: 18.9% · Graduate or professional: 11.1% · High school or higher: 92.6% · Bachelor's or higher: 30.0%Tucson, Arizona · Population: 543,348 · Population (margin of error): 98 · Population 25 years and over: 353,602 · Less than high school: 12.7% · High school graduate: 23.0% · Some college, no degree: 25.2% · Associate's degree: 9.0% · Bachelor's degree: 17.7% · Graduate or professional: 12.5% · High school or higher: 87.3% · Bachelor's or higher: 30.2%Springfield, Missouri · Population: 169,432 · Population (margin of error): 92 · Population 25 years and over: 108,701 · Less than high school: 7.9% · High school graduate: 28.7% · Some college, no degree: 25.4% · Associate's degree: 7.7% · Bachelor's degree: 18.7% · Graduate or professional: 11.6% · High school or higher: 92.1% · Bachelor's or higher: 30.3%Buffalo, New York · Population: 276,397 · Population (margin of error): 65 · Population 25 years and over: 183,799 · Less than high school: 13.4% · High school graduate: 27.2% · Some college, no degree: 19.3% · Associate's degree: 9.7% · Bachelor's degree: 16.9% · Graduate or professional: 13.4% · High school or higher: 86.6% · Bachelor's or higher: 30.3%Syracuse, New York · Population: 146,211 · Population (margin of error): 65 · Population 25 years and over: 90,155 · Less than high school: 14.8% · High school graduate: 26.8% · Some college, no degree: 17.9% · Associate's degree: 10.0% · Bachelor's degree: 17.2% · Graduate or professional: 13.3% · High school or higher: 85.2% · Bachelor's or higher: 30.5%Clarksville, Tennessee · Population: 171,897 · Population (margin of error): 51 · Population 25 years and over: 105,759 · Less than high school: 5.8% · High school graduate: 27.4% · Some college, no degree: 24.2% · Associate's degree: 12.0% · Bachelor's degree: 18.9% · Graduate or professional: 11.6% · High school or higher: 94.2% · Bachelor's or higher: 30.6%Birmingham, Alabama · Population: 199,322 · Population (margin of error): 646 · Population 25 years and over: 137,790 · Less than high school: 11.3% · High school graduate: 28.2% · Some college, no degree: 21.4% · Associate's degree: 8.4% · Bachelor's degree: 18.4% · Graduate or professional: 12.3% · High school or higher: 88.7% · Bachelor's or higher: 30.7%Tyler, Texas · Population: 107,718 · Population (margin of error): 63 · Population 25 years and over: 69,163 · Less than high school: 12.1% · High school graduate: 22.0% · Some college, no degree: 24.7% · Associate's degree: 10.5% · Bachelor's degree: 20.4% · Graduate or professional: 10.3% · High school or higher: 87.9% · Bachelor's or higher: 30.7%Wichita, Kansas · Population: 396,488 · Population (margin of error): 82 · Population 25 years and over: 260,391 · Less than high school: 12.0% · High school graduate: 26.0% · Some college, no degree: 23.0% · Associate's degree: 8.1% · Bachelor's degree: 19.7% · Graduate or professional: 11.2% · High school or higher: 88.0% · Bachelor's or higher: 30.9%Corona, California · Population: 158,839 · Population (margin of error): 97 · Population 25 years and over: 105,593 · Less than high school: 14.2% · High school graduate: 24.7% · Some college, no degree: 21.1% · Associate's degree: 9.1% · Bachelor's degree: 20.8% · Graduate or professional: 10.1% · High school or higher: 85.8% · Bachelor's or higher: 30.9%Surprise, Arizona · Population: 149,519 · Population (margin of error): 64 · Population 25 years and over: 103,046 · Less than high school: 5.7% · High school graduate: 25.2% · Some college, no degree: 26.7% · Associate's degree: 11.3% · Bachelor's degree: 19.9% · Graduate or professional: 11.1% · High school or higher: 94.3% · Bachelor's or higher: 31.0%Spring Valley, Nevada · Population: 219,913 · Population (margin of error): 5,139 · Population 25 years and over: 161,082 · Less than high school: 10.6% · High school graduate: 27.2% · Some college, no degree: 22.8% · Associate's degree: 8.3% · Bachelor's degree: 22.0% · Graduate or professional: 9.1% · High school or higher: 89.4% · Bachelor's or higher: 31.0%Pompano Beach, Florida · Population: 112,212 · Population (margin of error): 80 · Population 25 years and over: 83,418 · Less than high school: 14.7% · High school graduate: 27.0% · Some college, no degree: 20.3% · Associate's degree: 6.8% · Bachelor's degree: 20.0% · Graduate or professional: 11.2% · High school or higher: 85.3% · Bachelor's or higher: 31.1%Sterling Heights, Michigan · Population: 133,473 · Population (margin of error): 73 · Population 25 years and over: 96,071 · Less than high school: 12.5% · High school graduate: 27.7% · Some college, no degree: 19.2% · Associate's degree: 9.4% · Bachelor's degree: 20.5% · Graduate or professional: 10.7% · High school or higher: 87.5% · Bachelor's or higher: 31.2%Salem, Oregon · Population: 176,666 · Population (margin of error): 96 · Population 25 years and over: 118,107 · Less than high school: 11.3% · High school graduate: 22.4% · Some college, no degree: 25.4% · Associate's degree: 9.3% · Bachelor's degree: 19.3% · Graduate or professional: 12.2% · High school or higher: 88.7% · Bachelor's or higher: 31.4%Mesa, Arizona · Population: 507,478 · Population (margin of error): 87 · Population 25 years and over: 345,866 · Less than high school: 9.0% · High school graduate: 23.9% · Some college, no degree: 26.0% · Associate's degree: 9.6% · Bachelor's degree: 20.9% · Graduate or professional: 10.5% · High school or higher: 91.0% · Bachelor's or higher: 31.5%Mobile, Alabama · Population: 185,097 · Population (margin of error): 52 · Population 25 years and over: 126,234 · Less than high school: 9.4% · High school graduate: 29.7% · Some college, no degree: 21.0% · Associate's degree: 8.5% · Bachelor's degree: 20.0% · Graduate or professional: 11.5% · High school or higher: 90.6% · Bachelor's or higher: 31.5%Vancouver, Washington · Population: 192,696 · Population (margin of error): 110 · Population 25 years and over: 134,241 · Less than high school: 8.9% · High school graduate: 24.6% · Some college, no degree: 25.0% · Associate's degree: 10.0% · Bachelor's degree: 20.1% · Graduate or professional: 11.5% · High school or higher: 91.1% · Bachelor's or higher: 31.5%Fort Worth, Texas · Population: 941,311 · Population (margin of error): 527 · Population 25 years and over: 599,411 · Less than high school: 15.7% · High school graduate: 24.7% · Some college, no degree: 20.5% · Associate's degree: 7.4% · Bachelor's degree: 20.6% · Graduate or professional: 11.1% · High school or higher: 84.3% · Bachelor's or higher: 31.7%Murrieta, California · Population: 111,621 · Population (margin of error): 63 · Population 25 years and over: 71,754 · Less than high school: 6.8% · High school graduate: 21.0% · Some college, no degree: 29.8% · Associate's degree: 10.6% · Bachelor's degree: 20.6% · Graduate or professional: 11.3% · High school or higher: 93.2% · Bachelor's or higher: 31.8%Jacksonville, Florida · Population: 961,739 · Population (margin of error): 52 · Population 25 years and over: 657,667 · Less than high school: 9.2% · High school graduate: 28.2% · Some college, no degree: 20.7% · Associate's degree: 10.0% · Bachelor's degree: 21.6% · Graduate or professional: 10.2% · High school or higher: 90.8% · Bachelor's or higher: 31.8%Savannah, Georgia · Population: 147,546 · Population (margin of error): 85 · Population 25 years and over: 97,191 · Less than high school: 10.1% · High school graduate: 27.0% · Some college, no degree: 23.7% · Associate's degree: 7.2% · Bachelor's degree: 20.6% · Graduate or professional: 11.5% · High school or higher: 89.9% · Bachelor's or higher: 32.0%McAllen, Texas · Population: 143,789 · Population (margin of error): 56 · Population 25 years and over: 90,115 · Less than high school: 20.1% · High school graduate: 20.7% · Some college, no degree: 20.6% · Associate's degree: 6.5% · Bachelor's degree: 20.3% · Graduate or professional: 11.7% · High school or higher: 79.9% · Bachelor's or higher: 32.0%Thornton, Colorado · Population: 142,878 · Population (margin of error): 77 · Population 25 years and over: 92,533 · Less than high school: 12.1% · High school graduate: 26.3% · Some college, no degree: 20.9% · Associate's degree: 8.4% · Bachelor's degree: 22.3% · Graduate or professional: 9.9% · High school or higher: 87.9% · Bachelor's or higher: 32.2%Chula Vista, California · Population: 275,030 · Population (margin of error): 61 · Population 25 years and over: 184,434 · Less than high school: 14.3% · High school graduate: 20.7% · Some college, no degree: 22.8% · Associate's degree: 9.8% · Bachelor's degree: 21.9% · Graduate or professional: 10.4% · High school or higher: 85.7% · Bachelor's or higher: 32.3%Phoenix, Arizona · Population: 1,624,832 · Population (margin of error): 112 · Population 25 years and over: 1,072,383 · Less than high school: 15.6% · High school graduate: 23.1% · Some college, no degree: 21.1% · Associate's degree: 7.9% · Bachelor's degree: 19.9% · Graduate or professional: 12.5% · High school or higher: 84.4% · Bachelor's or higher: 32.3%Clearwater, Florida · Population: 117,075 · Population (margin of error): 58 · Population 25 years and over: 89,115 · Less than high school: 9.1% · High school graduate: 29.1% · Some college, no degree: 20.5% · Associate's degree: 8.8% · Bachelor's degree: 20.6% · Graduate or professional: 11.9% · High school or higher: 90.9% · Bachelor's or higher: 32.5%Richmond, California · Population: 115,396 · Population (margin of error): 54 · Population 25 years and over: 79,844 · Less than high school: 20.8% · High school graduate: 19.8% · Some college, no degree: 19.6% · Associate's degree: 7.1% · Bachelor's degree: 20.2% · Graduate or professional: 12.4% · High school or higher: 79.2% · Bachelor's or higher: 32.5%Spokane, Washington · Population: 229,228 · Population (margin of error): 74 · Population 25 years and over: 161,152 · Less than high school: 6.6% · High school graduate: 23.9% · Some college, no degree: 24.9% · Associate's degree: 12.1% · Bachelor's degree: 20.5% · Graduate or professional: 12.1% · High school or higher: 93.4% · Bachelor's or higher: 32.6%Hayward, California · Population: 159,201 · Population (margin of error): 69 · Population 25 years and over: 113,999 · Less than high school: 17.5% · High school graduate: 23.9% · Some college, no degree: 18.7% · Associate's degree: 7.3% · Bachelor's degree: 23.2% · Graduate or professional: 9.4% · High school or higher: 82.5% · Bachelor's or higher: 32.6%Norfolk, Virginia · Population: 235,037 · Population 25 years and over: 151,855 · Less than high school: 10.4% · High school graduate: 24.9% · Some college, no degree: 23.6% · Associate's degree: 8.5% · Bachelor's degree: 19.3% · Graduate or professional: 13.4% · High school or higher: 89.6% · Bachelor's or higher: 32.7%Hollywood, Florida · Population: 152,935 · Population (margin of error): 60 · Population 25 years and over: 111,057 · Less than high school: 10.7% · High school graduate: 26.6% · Some college, no degree: 20.0% · Associate's degree: 10.0% · Bachelor's degree: 19.8% · Graduate or professional: 12.9% · High school or higher: 89.3% · Bachelor's or higher: 32.7%Cedar Rapids, Iowa · Population: 136,859 · Population (margin of error): 60 · Population 25 years and over: 92,935 · Less than high school: 5.9% · High school graduate: 25.9% · Some college, no degree: 22.4% · Associate's degree: 12.9% · Bachelor's degree: 22.2% · Graduate or professional: 10.7% · High school or higher: 94.1% · Bachelor's or higher: 32.9%Aurora, Colorado · Population: 390,201 · Population (margin of error): 117 · Population 25 years and over: 258,902 · Less than high school: 13.4% · High school graduate: 23.3% · Some college, no degree: 20.9% · Associate's degree: 9.4% · Bachelor's degree: 21.4% · Graduate or professional: 11.5% · High school or higher: 86.6% · Bachelor's or higher: 32.9%Arlington, Texas · Population: 394,769 · Population (margin of error): 103 · Population 25 years and over: 250,729 · Less than high school: 14.0% · High school graduate: 23.3% · Some college, no degree: 21.3% · Associate's degree: 8.3% · Bachelor's degree: 21.8% · Graduate or professional: 11.3% · High school or higher: 86.0% · Bachelor's or higher: 33.1%Tulsa, Oklahoma · Population: 412,322 · Population (margin of error): 129 · Population 25 years and over: 271,754 · Less than high school: 12.4% · High school graduate: 25.0% · Some college, no degree: 21.2% · Associate's degree: 8.2% · Bachelor's degree: 20.8% · Graduate or professional: 12.5% · High school or higher: 87.6% · Bachelor's or higher: 33.3%Louisville/Jefferson County metro government (balance), Kentucky · Population: 627,210 · Population (margin of error): 145 · Population 25 years and over: 430,157 · Less than high school: 9.5% · High school graduate: 27.7% · Some college, no degree: 21.0% · Associate's degree: 8.4% · Bachelor's degree: 19.9% · Graduate or professional: 13.5% · High school or higher: 90.5% · Bachelor's or higher: 33.4%Manchester, New Hampshire · Population: 115,415 · Population (margin of error): 61 · Population 25 years and over: 83,599 · Less than high school: 11.3% · High school graduate: 29.1% · Some college, no degree: 18.1% · Associate's degree: 8.0% · Bachelor's degree: 22.5% · Graduate or professional: 10.9% · High school or higher: 88.7% · Bachelor's or higher: 33.5%Tacoma, Washington · Population: 220,482 · Population (margin of error): 73 · Population 25 years and over: 157,618 · Less than high school: 8.7% · High school graduate: 25.6% · Some college, no degree: 22.3% · Associate's degree: 9.9% · Bachelor's degree: 21.0% · Graduate or professional: 12.6% · High school or higher: 91.3% · Bachelor's or higher: 33.5%Montgomery, Alabama · Population: 198,440 · Population (margin of error): 40 · Population 25 years and over: 130,606 · Less than high school: 11.3% · High school graduate: 26.3% · Some college, no degree: 21.3% · Associate's degree: 7.6% · Bachelor's degree: 19.4% · Graduate or professional: 14.1% · High school or higher: 88.7% · Bachelor's or higher: 33.5%Rio Rancho, New Mexico · Population: 106,533 · Population (margin of error): 72 · Population 25 years and over: 73,242 · Less than high school: 5.6% · High school graduate: 23.3% · Some college, no degree: 25.3% · Associate's degree: 12.3% · Bachelor's degree: 20.7% · Graduate or professional: 12.9% · High school or higher: 94.4% · Bachelor's or higher: 33.6%Midland, Texas · Population: 133,998 · Population (margin of error): 47 · Population 25 years and over: 83,584 · Less than high school: 13.5% · High school graduate: 22.5% · Some college, no degree: 22.4% · Associate's degree: 8.0% · Bachelor's degree: 23.9% · Graduate or professional: 9.8% · High school or higher: 86.5% · Bachelor's or higher: 33.7%Knoxville, Tennessee · Population: 193,721 · Population (margin of error): 80 · Population 25 years and over: 123,644 · Less than high school: 10.2% · High school graduate: 27.1% · Some college, no degree: 20.4% · Associate's degree: 8.6% · Bachelor's degree: 20.5% · Graduate or professional: 13.2% · High school or higher: 89.8% · Bachelor's or higher: 33.7%Brandon, Florida · Population: 116,365 · Population (margin of error): 3,137 · Population 25 years and over: 82,896 · Less than high school: 9.8% · High school graduate: 25.4% · Some college, no degree: 20.2% · Associate's degree: 10.8% · Bachelor's degree: 23.5% · Graduate or professional: 10.2% · High school or higher: 90.2% · Bachelor's or higher: 33.8%High Point, North Carolina · Population: 115,263 · Population (margin of error): 63 · Population 25 years and over: 75,958 · Less than high school: 13.6% · High school graduate: 23.6% · Some college, no degree: 19.9% · Associate's degree: 9.0% · Bachelor's degree: 21.7% · Graduate or professional: 12.3% · High school or higher: 86.4% · Bachelor's or higher: 33.9%Oklahoma City, Oklahoma · Population: 688,693 · Population (margin of error): 148 · Population 25 years and over: 452,379 · Less than high school: 12.2% · High school graduate: 24.5% · Some college, no degree: 21.3% · Associate's degree: 8.0% · Bachelor's degree: 21.5% · Graduate or professional: 12.5% · High school or higher: 87.8% · Bachelor's or higher: 34.0%Worcester, Massachusetts · Population: 205,501 · Population (margin of error): 74 · Population 25 years and over: 134,836 · Less than high school: 14.3% · High school graduate: 27.9% · Some college, no degree: 16.0% · Associate's degree: 7.7% · Bachelor's degree: 20.1% · Graduate or professional: 14.0% · High school or higher: 85.7% · Bachelor's or higher: 34.1%Indianapolis city (balance), Indiana · Population: 882,043 · Population (margin of error): 878 · Population 25 years and over: 577,585 · Less than high school: 12.5% · High school graduate: 26.8% · Some college, no degree: 18.9% · Associate's degree: 7.7% · Bachelor's degree: 21.7% · Graduate or professional: 12.5% · High school or higher: 87.5% · Bachelor's or higher: 34.2%Oceanside, California · Population: 172,542 · Population (margin of error): 76 · Population 25 years and over: 121,036 · Less than high school: 13.5% · High school graduate: 18.8% · Some college, no degree: 24.5% · Associate's degree: 8.8% · Bachelor's degree: 22.1% · Graduate or professional: 12.2% · High school or higher: 86.5% · Bachelor's or higher: 34.3%Dearborn, Michigan · Population: 107,846 · Population (margin of error): 57 · Population 25 years and over: 66,044 · Less than high school: 16.0% · High school graduate: 22.6% · Some college, no degree: 17.7% · Associate's degree: 9.4% · Bachelor's degree: 20.1% · Graduate or professional: 14.2% · High school or higher: 84.0% · Bachelor's or higher: 34.3%Philadelphia, Pennsylvania · Population: 1,582,432 · Population 25 years and over: 1,088,969 · Less than high school: 12.6% · High school graduate: 29.8% · Some college, no degree: 16.4% · Associate's degree: 6.5% · Bachelor's degree: 19.4% · Graduate or professional: 15.3% · High school or higher: 87.4% · Bachelor's or higher: 34.6%Providence, Rhode Island · Population: 190,214 · Population (margin of error): 61 · Population 25 years and over: 120,322 · Less than high school: 18.1% · High school graduate: 27.5% · Some college, no degree: 14.8% · Associate's degree: 4.9% · Bachelor's degree: 18.3% · Graduate or professional: 16.4% · High school or higher: 81.9% · Bachelor's or higher: 34.7%Santa Rosa, California · Population: 177,216 · Population (margin of error): 54 · Population 25 years and over: 126,405 · Less than high school: 14.5% · High school graduate: 19.2% · Some college, no degree: 21.9% · Associate's degree: 9.7% · Bachelor's degree: 21.3% · Graduate or professional: 13.4% · High school or higher: 85.5% · Bachelor's or higher: 34.8%Riverview, Florida · Population: 107,776 · Population (margin of error): 3,794 · Population 25 years and over: 72,695 · Less than high school: 7.3% · High school graduate: 24.4% · Some college, no degree: 19.4% · Associate's degree: 14.2% · Bachelor's degree: 21.6% · Graduate or professional: 13.1% · High school or higher: 92.7% · Bachelor's or higher: 34.8%Miramar, Florida · Population: 135,986 · Population (margin of error): 63 · Population 25 years and over: 95,657 · Less than high school: 8.3% · High school graduate: 31.2% · Some college, no degree: 14.8% · Associate's degree: 11.0% · Bachelor's degree: 22.4% · Graduate or professional: 12.4% · High school or higher: 91.7% · Bachelor's or higher: 34.8%Long Beach, California · Population: 458,491 · Population (margin of error): 71 · Population 25 years and over: 320,740 · Less than high school: 18.4% · High school graduate: 17.9% · Some college, no degree: 21.9% · Associate's degree: 6.9% · Bachelor's degree: 22.3% · Graduate or professional: 12.6% · High school or higher: 81.6% · Bachelor's or higher: 34.8%Lubbock, Texas · Population: 261,078 · Population (margin of error): 49 · Population 25 years and over: 153,314 · Less than high school: 10.8% · High school graduate: 24.2% · Some college, no degree: 22.5% · Associate's degree: 7.5% · Bachelor's degree: 20.8% · Graduate or professional: 14.1% · High school or higher: 89.2% · Bachelor's or higher: 34.9%Broken Arrow, Oklahoma · Population: 115,919 · Population (margin of error): 85 · Population 25 years and over: 77,729 · Less than high school: 5.7% · High school graduate: 24.1% · Some college, no degree: 24.3% · Associate's degree: 10.9% · Bachelor's degree: 24.5% · Graduate or professional: 10.6% · High school or higher: 94.3% · Bachelor's or higher: 35.0%Springfield, Illinois · Population: 113,714 · Population (margin of error): 376 · Population 25 years and over: 79,834 · Less than high school: 7.4% · High school graduate: 27.3% · Some college, no degree: 21.3% · Associate's degree: 9.0% · Bachelor's degree: 20.1% · Graduate or professional: 14.9% · High school or higher: 92.6% · Bachelor's or higher: 35.1%Yonkers, New York · Population: 209,529 · Population (margin of error): 81 · Population 25 years and over: 145,510 · Less than high school: 16.3% · High school graduate: 25.3% · Some college, no degree: 15.8% · Associate's degree: 7.4% · Bachelor's degree: 19.6% · Graduate or professional: 15.6% · High school or higher: 83.7% · Bachelor's or higher: 35.2%Enterprise, Nevada · Population: 232,043 · Population (margin of error): 5,278 · Population 25 years and over: 160,697 · Less than high school: 7.8% · High school graduate: 23.7% · Some college, no degree: 22.9% · Associate's degree: 10.4% · Bachelor's degree: 24.2% · Graduate or professional: 11.0% · High school or higher: 92.2% · Bachelor's or higher: 35.2%Baltimore, Maryland · Population: 577,193 · Population 25 years and over: 404,300 · Less than high school: 12.8% · High school graduate: 27.9% · Some college, no degree: 18.4% · Associate's degree: 5.5% · Bachelor's degree: 18.1% · Graduate or professional: 17.3% · High school or higher: 87.2% · Bachelor's or higher: 35.4%Goodyear, Arizona · Population: 102,891 · Population (margin of error): 62 · Population 25 years and over: 72,204 · Less than high school: 7.5% · High school graduate: 19.8% · Some college, no degree: 23.2% · Associate's degree: 14.0% · Bachelor's degree: 22.2% · Graduate or professional: 13.3% · High school or higher: 92.5% · Bachelor's or higher: 35.5%Chattanooga, Tennessee · Population: 182,832 · Population (margin of error): 79 · Population 25 years and over: 126,308 · Less than high school: 10.4% · High school graduate: 24.3% · Some college, no degree: 21.8% · Associate's degree: 8.0% · Bachelor's degree: 21.6% · Graduate or professional: 13.9% · High school or higher: 89.6% · Bachelor's or higher: 35.5%Peoria, Arizona · Population: 194,338 · Population (margin of error): 207 · Population 25 years and over: 137,131 · Less than high school: 7.4% · High school graduate: 22.4% · Some college, no degree: 23.9% · Associate's degree: 10.8% · Bachelor's degree: 21.6% · Graduate or professional: 14.0% · High school or higher: 92.6% · Bachelor's or higher: 35.5%Miami, Florida · Population: 446,663 · Population (margin of error): 77 · Population 25 years and over: 340,647 · Less than high school: 20.0% · High school graduate: 25.2% · Some college, no degree: 11.6% · Associate's degree: 7.5% · Bachelor's degree: 21.5% · Graduate or professional: 14.1% · High school or higher: 80.0% · Bachelor's or higher: 35.6%Reno, Nevada · Population: 268,959 · Population (margin of error): 101 · Population 25 years and over: 188,200 · Less than high school: 10.7% · High school graduate: 22.8% · Some college, no degree: 22.6% · Associate's degree: 8.3% · Bachelor's degree: 21.4% · Graduate or professional: 14.3% · High school or higher: 89.3% · Bachelor's or higher: 35.7%Baton Rouge, Louisiana · Population: 223,699 · Population (margin of error): 58 · Population 25 years and over: 134,468 · Less than high school: 12.5% · High school graduate: 26.4% · Some college, no degree: 20.0% · Associate's degree: 5.3% · Bachelor's degree: 20.0% · Graduate or professional: 15.8% · High school or higher: 87.5% · Bachelor's or higher: 35.8%Houston, Texas · Population: 2,300,419 · Population (margin of error): 172 · Population 25 years and over: 1,531,065 · Less than high school: 19.7% · High school graduate: 21.5% · Some college, no degree: 16.6% · Associate's degree: 6.2% · Bachelor's degree: 21.3% · Graduate or professional: 14.6% · High school or higher: 80.3% · Bachelor's or higher: 36.0%Sacramento, California · Population: 524,802 · Population (margin of error): 252 · Population 25 years and over: 363,003 · Less than high school: 13.1% · High school graduate: 20.5% · Some college, no degree: 21.6% · Associate's degree: 8.4% · Bachelor's degree: 22.9% · Graduate or professional: 13.6% · High school or higher: 86.9% · Bachelor's or higher: 36.4%Chesapeake, Virginia · Population: 251,153 · Population 25 years and over: 169,871 · Less than high school: 6.6% · High school graduate: 24.1% · Some college, no degree: 22.9% · Associate's degree: 10.0% · Bachelor's degree: 22.4% · Graduate or professional: 14.0% · High school or higher: 93.4% · Bachelor's or higher: 36.4%Clovis, California · Population: 122,719 · Population (margin of error): 69 · Population 25 years and over: 77,913 · Less than high school: 7.9% · High school graduate: 19.9% · Some college, no degree: 24.3% · Associate's degree: 11.2% · Bachelor's degree: 22.9% · Graduate or professional: 13.9% · High school or higher: 92.1% · Bachelor's or higher: 36.7%Henderson, Nevada · Population: 324,523 · Population (margin of error): 51 · Population 25 years and over: 236,338 · Less than high school: 6.1% · High school graduate: 23.4% · Some college, no degree: 24.6% · Associate's degree: 9.1% · Bachelor's degree: 23.2% · Graduate or professional: 13.6% · High school or higher: 93.9% · Bachelor's or higher: 36.8%Billings, Montana · Population: 118,321 · Population (margin of error): 43 · Population 25 years and over: 81,368 · Less than high school: 4.5% · High school graduate: 27.6% · Some college, no degree: 22.5% · Associate's degree: 8.3% · Bachelor's degree: 25.0% · Graduate or professional: 12.0% · High school or higher: 95.5% · Bachelor's or higher: 37.0%Winston-Salem, North Carolina · Population: 250,887 · Population (margin of error): 68 · Population 25 years and over: 162,595 · Less than high school: 11.6% · High school graduate: 23.7% · Some college, no degree: 19.5% · Associate's degree: 7.9% · Bachelor's degree: 21.6% · Graduate or professional: 15.6% · High school or higher: 88.4% · Bachelor's or higher: 37.2%Aurora, Illinois · Population: 179,867 · Population (margin of error): 480 · Population 25 years and over: 114,169 · Less than high school: 17.9% · High school graduate: 21.0% · Some college, no degree: 17.9% · Associate's degree: 5.9% · Bachelor's degree: 22.5% · Graduate or professional: 14.7% · High school or higher: 82.1% · Bachelor's or higher: 37.2%Rancho Cucamonga, California · Population: 174,693 · Population (margin of error): 83 · Population 25 years and over: 120,743 · Less than high school: 8.0% · High school graduate: 20.5% · Some college, no degree: 23.1% · Associate's degree: 11.2% · Bachelor's degree: 22.8% · Graduate or professional: 14.5% · High school or higher: 92.0% · Bachelor's or higher: 37.3%Las Cruces, New Mexico · Population: 112,612 · Population (margin of error): 86 · Population 25 years and over: 71,053 · Less than high school: 11.9% · High school graduate: 19.5% · Some college, no degree: 21.6% · Associate's degree: 9.7% · Bachelor's degree: 20.2% · Graduate or professional: 17.1% · High school or higher: 88.1% · Bachelor's or higher: 37.3%Dallas, Texas · Population: 1,299,553 · Population (margin of error): 141 · Population 25 years and over: 859,929 · Less than high school: 19.2% · High school graduate: 21.5% · Some college, no degree: 16.7% · Associate's degree: 5.1% · Bachelor's degree: 22.9% · Graduate or professional: 14.5% · High school or higher: 80.8% · Bachelor's or higher: 37.4%Sioux Falls, South Dakota · Population: 197,642 · Population (margin of error): 66 · Population 25 years and over: 130,172 · Less than high school: 6.9% · High school graduate: 24.3% · Some college, no degree: 20.1% · Associate's degree: 11.2% · Bachelor's degree: 25.4% · Graduate or professional: 12.0% · High school or higher: 93.1% · Bachelor's or higher: 37.4%Simi Valley, California · Population: 125,769 · Population (margin of error): 77 · Population 25 years and over: 90,065 · Less than high school: 9.1% · High school graduate: 19.7% · Some college, no degree: 22.9% · Associate's degree: 10.8% · Bachelor's degree: 24.9% · Graduate or professional: 12.6% · High school or higher: 90.9% · Bachelor's or higher: 37.4%West Palm Beach, Florida · Population: 119,508 · Population (margin of error): 117 · Population 25 years and over: 86,988 · Less than high school: 13.6% · High school graduate: 20.8% · Some college, no degree: 18.6% · Associate's degree: 9.3% · Bachelor's degree: 23.4% · Graduate or professional: 14.2% · High school or higher: 86.4% · Bachelor's or higher: 37.7%Anchorage, Alaska · Population: 289,069 · Population 25 years and over: 192,495 · Less than high school: 6.0% · High school graduate: 24.5% · Some college, no degree: 23.2% · Associate's degree: 8.6% · Bachelor's degree: 23.4% · Graduate or professional: 14.3% · High school or higher: 94.0% · Bachelor's or higher: 37.7%New Haven, Connecticut · Population: 132,893 · Population (margin of error): 76 · Population 25 years and over: 84,441 · Less than high school: 14.0% · High school graduate: 29.1% · Some college, no degree: 13.5% · Associate's degree: 5.6% · Bachelor's degree: 17.3% · Graduate or professional: 20.4% · High school or higher: 86.0% · Bachelor's or higher: 37.7%Concord, California · Population: 124,260 · Population (margin of error): 42 · Population 25 years and over: 89,177 · Less than high school: 11.9% · High school graduate: 19.5% · Some college, no degree: 21.4% · Associate's degree: 9.4% · Bachelor's degree: 26.1% · Graduate or professional: 11.7% · High school or higher: 88.1% · Bachelor's or higher: 37.8%Kansas City, Missouri · Population: 508,233 · Population (margin of error): 121 · Population 25 years and over: 347,266 · Less than high school: 8.2% · High school graduate: 25.0% · Some college, no degree: 21.6% · Associate's degree: 7.4% · Bachelor's degree: 23.8% · Graduate or professional: 14.0% · High school or higher: 91.8% · Bachelor's or higher: 37.8%Los Angeles, California · Population: 3,857,897 · Population (margin of error): 75 · Population 25 years and over: 2,739,889 · Less than high school: 20.7% · High school graduate: 18.5% · Some college, no degree: 16.6% · Associate's degree: 6.3% · Bachelor's degree: 24.5% · Graduate or professional: 13.3% · High school or higher: 79.3% · Bachelor's or higher: 37.8%Peoria, Illinois · Population: 112,126 · Population (margin of error): 429 · Population 25 years and over: 73,294 · Less than high school: 7.9% · High school graduate: 25.5% · Some college, no degree: 20.4% · Associate's degree: 8.3% · Bachelor's degree: 21.6% · Graduate or professional: 16.4% · High school or higher: 92.1% · Bachelor's or higher: 38.0%Daly City, California · Population: 102,560 · Population (margin of error): 52 · Population 25 years and over: 77,507 · Less than high school: 11.5% · High school graduate: 21.9% · Some college, no degree: 21.0% · Associate's degree: 7.7% · Bachelor's degree: 29.2% · Graduate or professional: 8.8% · High school or higher: 88.5% · Bachelor's or higher: 38.0%Elk Grove, California · Population: 177,221 · Population (margin of error): 134 · Population 25 years and over: 118,191 · Less than high school: 9.2% · High school graduate: 17.6% · Some college, no degree: 25.1% · Associate's degree: 10.2% · Bachelor's degree: 25.4% · Graduate or professional: 12.6% · High school or higher: 90.8% · Bachelor's or higher: 38.0%Tuscaloosa, Alabama · Population: 107,699 · Population (margin of error): 46 · Population 25 years and over: 58,784 · Less than high school: 8.7% · High school graduate: 25.4% · Some college, no degree: 20.1% · Associate's degree: 7.7% · Bachelor's degree: 21.3% · Graduate or professional: 16.8% · High school or higher: 91.3% · Bachelor's or higher: 38.1%Pembroke Pines, Florida · Population: 170,557 · Population (margin of error): 64 · Population 25 years and over: 123,907 · Less than high school: 6.4% · High school graduate: 29.2% · Some college, no degree: 15.9% · Associate's degree: 10.4% · Bachelor's degree: 23.9% · Graduate or professional: 14.3% · High school or higher: 93.6% · Bachelor's or higher: 38.1%Columbus, Ohio · Population: 906,480 · Population (margin of error): 134 · Population 25 years and over: 602,491 · Less than high school: 10.2% · High school graduate: 25.2% · Some college, no degree: 19.2% · Associate's degree: 7.2% · Bachelor's degree: 24.1% · Graduate or professional: 14.1% · High school or higher: 89.8% · Bachelor's or higher: 38.2%Albuquerque, New Mexico · Population: 562,488 · Population (margin of error): 118 · Population 25 years and over: 395,754 · Less than high school: 9.1% · High school graduate: 21.6% · Some college, no degree: 21.2% · Associate's degree: 9.5% · Bachelor's degree: 20.9% · Graduate or professional: 17.8% · High school or higher: 90.9% · Bachelor's or higher: 38.7%South Fulton, Georgia · Population: 109,157 · Population (margin of error): 51 · Population 25 years and over: 70,303 · Less than high school: 7.0% · High school graduate: 23.7% · Some college, no degree: 19.7% · Associate's degree: 10.8% · Bachelor's degree: 24.2% · Graduate or professional: 14.7% · High school or higher: 93.0% · Bachelor's or higher: 38.9%Renton, Washington · Population: 105,279 · Population (margin of error): 70 · Population 25 years and over: 75,399 · Less than high school: 10.3% · High school graduate: 20.4% · Some college, no degree: 20.2% · Associate's degree: 10.1% · Bachelor's degree: 25.4% · Graduate or professional: 13.6% · High school or higher: 89.7% · Bachelor's or higher: 39.0%Davie, Florida · Population: 106,412 · Population (margin of error): 62 · Population 25 years and over: 72,087 · Less than high school: 8.6% · High school graduate: 22.5% · Some college, no degree: 17.9% · Associate's degree: 11.9% · Bachelor's degree: 24.5% · Graduate or professional: 14.6% · High school or higher: 91.4% · Bachelor's or higher: 39.1%Temecula, California · Population: 110,404 · Population (margin of error): 64 · Population 25 years and over: 72,211 · Less than high school: 6.6% · High school graduate: 18.1% · Some college, no degree: 25.7% · Associate's degree: 10.4% · Bachelor's degree: 25.7% · Graduate or professional: 13.5% · High school or higher: 93.4% · Bachelor's or higher: 39.2%Santa Clarita, California · Population: 229,021 · Population (margin of error): 97 · Population 25 years and over: 153,368 · Less than high school: 8.7% · High school graduate: 18.6% · Some college, no degree: 23.3% · Associate's degree: 10.1% · Bachelor's degree: 26.5% · Graduate or professional: 12.8% · High school or higher: 91.3% · Bachelor's or higher: 39.3%Lewisville, Texas · Population: 128,313 · Population (margin of error): 470 · Population 25 years and over: 86,991 · Less than high school: 10.3% · High school graduate: 20.5% · Some college, no degree: 21.8% · Associate's degree: 8.0% · Bachelor's degree: 26.2% · Graduate or professional: 13.2% · High school or higher: 89.7% · Bachelor's or higher: 39.4%Coral Springs, Florida · Population: 133,962 · Population (margin of error): 64 · Population 25 years and over: 87,136 · Less than high school: 5.7% · High school graduate: 23.8% · Some college, no degree: 19.9% · Associate's degree: 10.9% · Bachelor's degree: 24.6% · Graduate or professional: 15.1% · High school or higher: 94.3% · Bachelor's or higher: 39.7%Fort Lauderdale, Florida · Population: 183,032 · Population (margin of error): 56 · Population 25 years and over: 138,432 · Less than high school: 10.2% · High school graduate: 24.7% · Some college, no degree: 17.2% · Associate's degree: 8.1% · Bachelor's degree: 23.8% · Graduate or professional: 16.0% · High school or higher: 89.8% · Bachelor's or higher: 39.8%Greensboro, North Carolina · Population: 298,564 · Population (margin of error): 102 · Population 25 years and over: 190,944 · Less than high school: 9.9% · High school graduate: 21.5% · Some college, no degree: 20.1% · Associate's degree: 8.7% · Bachelor's degree: 24.2% · Graduate or professional: 15.7% · High school or higher: 90.1% · Bachelor's or higher: 39.9%Metairie, Louisiana · Population: 138,995 · Population (margin of error): 3,016 · Population 25 years and over: 101,337 · Less than high school: 8.2% · High school graduate: 24.2% · Some college, no degree: 20.6% · Associate's degree: 7.1% · Bachelor's degree: 24.8% · Graduate or professional: 15.0% · High school or higher: 91.8% · Bachelor's or higher: 39.9%Grand Rapids, Michigan · Population: 197,768 · Population (margin of error): 88 · Population 25 years and over: 129,268 · Less than high school: 11.0% · High school graduate: 21.7% · Some college, no degree: 20.0% · Associate's degree: 7.3% · Bachelor's degree: 26.3% · Graduate or professional: 13.7% · High school or higher: 89.0% · Bachelor's or higher: 40.1%Orange, California · Population: 138,723 · Population (margin of error): 68 · Population 25 years and over: 95,381 · Less than high school: 11.9% · High school graduate: 17.9% · Some college, no degree: 22.3% · Associate's degree: 7.9% · Bachelor's degree: 25.9% · Graduate or professional: 14.1% · High school or higher: 88.1% · Bachelor's or higher: 40.1%St. Louis, Missouri · Population: 293,109 · Population 25 years and over: 212,920 · Less than high school: 9.5% · High school graduate: 24.5% · Some college, no degree: 19.7% · Associate's degree: 6.1% · Bachelor's degree: 22.0% · Graduate or professional: 18.2% · High school or higher: 90.5% · Bachelor's or higher: 40.2%Omaha, Nebraska · Population: 488,197 · Population (margin of error): 68 · Population 25 years and over: 320,267 · Less than high school: 9.5% · High school graduate: 21.3% · Some college, no degree: 21.3% · Associate's degree: 7.7% · Bachelor's degree: 25.6% · Graduate or professional: 14.7% · High school or higher: 90.5% · Bachelor's or higher: 40.3%Virginia Beach, Virginia · Population: 457,066 · Population 25 years and over: 317,225 · Less than high school: 5.3% · High school graduate: 21.3% · Some college, no degree: 22.4% · Associate's degree: 10.5% · Bachelor's degree: 25.0% · Graduate or professional: 15.4% · High school or higher: 94.7% · Bachelor's or higher: 40.4%Lafayette, Louisiana · Population: 121,537 · Population (margin of error): 75 · Population 25 years and over: 83,530 · Less than high school: 9.1% · High school graduate: 25.3% · Some college, no degree: 18.9% · Associate's degree: 6.0% · Bachelor's degree: 27.1% · Graduate or professional: 13.6% · High school or higher: 90.9% · Bachelor's or higher: 40.6%Urban Honolulu, Hawaii · Population: 346,323 · Population (margin of error): 116 · Population 25 years and over: 262,561 · Less than high school: 9.1% · High school graduate: 22.8% · Some college, no degree: 17.2% · Associate's degree: 10.1% · Bachelor's degree: 25.2% · Graduate or professional: 15.5% · High school or higher: 90.9% · Bachelor's or higher: 40.8%Lincoln, Nebraska · Population: 291,932 · Population (margin of error): 71 · Population 25 years and over: 181,837 · Less than high school: 7.0% · High school graduate: 20.4% · Some college, no degree: 20.3% · Associate's degree: 11.4% · Bachelor's degree: 26.4% · Graduate or professional: 14.5% · High school or higher: 93.0% · Bachelor's or higher: 41.0%New York, New York · Population: 8,516,202 · Population 25 years and over: 6,090,653 · Less than high school: 16.3% · High school graduate: 23.0% · Some college, no degree: 13.2% · Associate's degree: 6.5% · Bachelor's degree: 23.6% · Graduate or professional: 17.4% · High school or higher: 83.7% · Bachelor's or higher: 41.0%Murfreesboro, Tennessee · Population: 157,547 · Population (margin of error): 53 · Population 25 years and over: 96,771 · Less than high school: 6.1% · High school graduate: 23.7% · Some college, no degree: 21.6% · Associate's degree: 7.4% · Bachelor's degree: 26.7% · Graduate or professional: 14.4% · High school or higher: 93.9% · Bachelor's or higher: 41.1%San Buenaventura (Ventura), California · Population: 109,900 · Population (margin of error): 62 · Population 25 years and over: 79,745 · Less than high school: 8.8% · High school graduate: 17.0% · Some college, no degree: 22.7% · Associate's degree: 10.4% · Bachelor's degree: 25.3% · Graduate or professional: 15.8% · High school or higher: 91.2% · Bachelor's or higher: 41.1%Cincinnati, Ohio · Population: 309,595 · Population (margin of error): 63 · Population 25 years and over: 202,800 · Less than high school: 10.3% · High school graduate: 24.1% · Some college, no degree: 17.0% · Associate's degree: 7.3% · Bachelor's degree: 23.2% · Graduate or professional: 18.0% · High school or higher: 89.7% · Bachelor's or higher: 41.3%St. Petersburg, Florida · Population: 260,646 · Population (margin of error): 54 · Population 25 years and over: 198,819 · Less than high school: 6.3% · High school graduate: 22.5% · Some college, no degree: 20.4% · Associate's degree: 9.6% · Bachelor's degree: 26.1% · Graduate or professional: 15.2% · High school or higher: 93.7% · Bachelor's or higher: 41.3%Chico, California · Population: 102,032 · Population (margin of error): 57 · Population 25 years and over: 61,073 · Less than high school: 6.8% · High school graduate: 16.1% · Some college, no degree: 24.8% · Associate's degree: 11.1% · Bachelor's degree: 26.9% · Graduate or professional: 14.4% · High school or higher: 93.2% · Bachelor's or higher: 41.3%Irving, Texas · Population: 255,036 · Population (margin of error): 57 · Population 25 years and over: 164,744 · Less than high school: 19.5% · High school graduate: 18.7% · Some college, no degree: 14.2% · Associate's degree: 6.0% · Bachelor's degree: 24.8% · Graduate or professional: 16.8% · High school or higher: 80.5% · Bachelor's or higher: 41.6%Concord, North Carolina · Population: 106,518 · Population (margin of error): 49 · Population 25 years and over: 68,500 · Less than high school: 8.7% · High school graduate: 21.8% · Some college, no degree: 18.3% · Associate's degree: 9.4% · Bachelor's degree: 25.3% · Graduate or professional: 16.5% · High school or higher: 91.3% · Bachelor's or higher: 41.7%Denton, Texas · Population: 146,987 · Population (margin of error): 68 · Population 25 years and over: 90,285 · Less than high school: 7.8% · High school graduate: 20.3% · Some college, no degree: 22.8% · Associate's degree: 7.3% · Bachelor's degree: 25.9% · Graduate or professional: 16.0% · High school or higher: 92.2% · Bachelor's or higher: 41.9%Colorado Springs, Colorado · Population: 483,099 · Population (margin of error): 79 · Population 25 years and over: 328,466 · Less than high school: 5.4% · High school graduate: 19.2% · Some college, no degree: 23.0% · Associate's degree: 10.6% · Bachelor's degree: 25.2% · Graduate or professional: 16.7% · High school or higher: 94.6% · Bachelor's or higher: 41.9%New Orleans, Louisiana · Population: 376,035 · Population 25 years and over: 268,012 · Less than high school: 10.9% · High school graduate: 21.3% · Some college, no degree: 20.7% · Associate's degree: 5.2% · Bachelor's degree: 22.5% · Graduate or professional: 19.4% · High school or higher: 89.1% · Bachelor's or higher: 42.0%Hillsboro, Oregon · Population: 107,050 · Population (margin of error): 43 · Population 25 years and over: 75,439 · Less than high school: 9.4% · High school graduate: 18.0% · Some college, no degree: 20.5% · Associate's degree: 10.2% · Bachelor's degree: 23.6% · Graduate or professional: 18.4% · High school or higher: 90.6% · Bachelor's or higher: 42.0%Orlando, Florida · Population: 311,732 · Population (margin of error): 141 · Population 25 years and over: 220,478 · Less than high school: 8.1% · High school graduate: 23.1% · Some college, no degree: 15.7% · Associate's degree: 10.9% · Bachelor's degree: 26.1% · Graduate or professional: 16.1% · High school or higher: 91.9% · Bachelor's or higher: 42.2%Fargo, North Dakota · Population: 129,064 · Population (margin of error): 49 · Population 25 years and over: 81,198 · Less than high school: 4.7% · High school graduate: 18.7% · Some college, no degree: 20.7% · Associate's degree: 12.7% · Bachelor's degree: 29.0% · Graduate or professional: 14.2% · High school or higher: 95.3% · Bachelor's or higher: 43.2%Carrollton, Texas · Population: 132,741 · Population (margin of error): 170 · Population 25 years and over: 95,058 · Less than high school: 10.6% · High school graduate: 17.8% · Some college, no degree: 20.9% · Associate's degree: 7.4% · Bachelor's degree: 29.1% · Graduate or professional: 14.2% · High school or higher: 89.4% · Bachelor's or higher: 43.3%Chicago, Illinois · Population: 2,707,648 · Population (margin of error): 72 · Population 25 years and over: 1,914,616 · Less than high school: 13.2% · High school graduate: 21.3% · Some college, no degree: 16.4% · Associate's degree: 5.8% · Bachelor's degree: 24.9% · Graduate or professional: 18.4% · High school or higher: 86.8% · Bachelor's or higher: 43.3%St. Paul, Minnesota · Population: 307,762 · Population (margin of error): 48 · Population 25 years and over: 202,082 · Less than high school: 11.1% · High school graduate: 20.8% · Some college, no degree: 16.9% · Associate's degree: 7.7% · Bachelor's degree: 25.2% · Graduate or professional: 18.3% · High school or higher: 88.9% · Bachelor's or higher: 43.5%Round Rock, Texas · Population: 124,288 · Population (margin of error): 898 · Population 25 years and over: 82,088 · Less than high school: 6.1% · High school graduate: 19.0% · Some college, no degree: 21.8% · Associate's degree: 9.5% · Bachelor's degree: 28.1% · Graduate or professional: 15.5% · High school or higher: 93.9% · Bachelor's or higher: 43.6%Costa Mesa, California · Population: 110,538 · Population (margin of error): 83 · Population 25 years and over: 79,865 · Less than high school: 12.2% · High school graduate: 16.6% · Some college, no degree: 20.2% · Associate's degree: 7.4% · Bachelor's degree: 30.9% · Graduate or professional: 12.7% · High school or higher: 87.8% · Bachelor's or higher: 43.6%Fullerton, California · Population: 141,278 · Population (margin of error): 65 · Population 25 years and over: 95,070 · Less than high school: 11.7% · High school graduate: 15.7% · Some college, no degree: 20.7% · Associate's degree: 8.2% · Bachelor's degree: 27.4% · Graduate or professional: 16.2% · High school or higher: 88.3% · Bachelor's or higher: 43.6%Little Rock, Arkansas · Population: 202,739 · Population (margin of error): 78 · Population 25 years and over: 135,136 · Less than high school: 7.7% · High school graduate: 21.2% · Some college, no degree: 20.7% · Associate's degree: 6.5% · Bachelor's degree: 25.0% · Graduate or professional: 19.0% · High school or higher: 92.3% · Bachelor's or higher: 44.0%Westminster, Colorado · Population: 115,546 · Population (margin of error): 83 · Population 25 years and over: 82,966 · Less than high school: 7.1% · High school graduate: 20.4% · Some college, no degree: 20.4% · Associate's degree: 8.1% · Bachelor's degree: 29.8% · Graduate or professional: 14.2% · High school or higher: 92.9% · Bachelor's or higher: 44.0%Richmond, Virginia · Population: 227,595 · Population 25 years and over: 160,965 · Less than high school: 10.7% · High school graduate: 21.2% · Some college, no degree: 18.8% · Associate's degree: 5.3% · Bachelor's degree: 26.0% · Graduate or professional: 18.0% · High school or higher: 89.3% · Bachelor's or higher: 44.1%Roseville, California · Population: 152,438 · Population (margin of error): 80 · Population 25 years and over: 106,905 · Less than high school: 4.5% · High school graduate: 15.8% · Some college, no degree: 24.3% · Associate's degree: 11.3% · Bachelor's degree: 30.0% · Graduate or professional: 14.1% · High school or higher: 95.5% · Bachelor's or higher: 44.1%Eugene, Oregon · Population: 177,520 · Population (margin of error): 70 · Population 25 years and over: 117,217 · Less than high school: 5.2% · High school graduate: 17.4% · Some college, no degree: 24.3% · Associate's degree: 8.8% · Bachelor's degree: 23.7% · Graduate or professional: 20.6% · High school or higher: 94.8% · Bachelor's or higher: 44.2%Meridian, Idaho · Population: 124,865 · Population (margin of error): 75 · Population 25 years and over: 81,842 · Less than high school: 4.3% · High school graduate: 17.4% · Some college, no degree: 24.5% · Associate's degree: 9.4% · Bachelor's degree: 29.3% · Graduate or professional: 15.1% · High school or higher: 95.7% · Bachelor's or higher: 44.4%Tampa, Florida · Population: 393,389 · Population (margin of error): 134 · Population 25 years and over: 269,690 · Less than high school: 10.2% · High school graduate: 22.5% · Some college, no degree: 14.7% · Associate's degree: 8.0% · Bachelor's degree: 26.3% · Graduate or professional: 18.3% · High school or higher: 89.8% · Bachelor's or higher: 44.6%Albany, New York · Population: 100,081 · Population (margin of error): 48 · Population 25 years and over: 63,072 · Less than high school: 10.4% · High school graduate: 20.4% · Some college, no degree: 15.6% · Associate's degree: 8.8% · Bachelor's degree: 24.0% · Graduate or professional: 20.8% · High school or higher: 89.6% · Bachelor's or higher: 44.8%Provo, Utah · Population: 114,303 · Population (margin of error): 48 · Population 25 years and over: 47,487 · Less than high school: 7.5% · High school graduate: 14.4% · Some college, no degree: 24.4% · Associate's degree: 8.7% · Bachelor's degree: 31.1% · Graduate or professional: 13.8% · High school or higher: 92.5% · Bachelor's or higher: 45.0%Lakewood, Colorado · Population: 156,309 · Population (margin of error): 154 · Population 25 years and over: 116,500 · Less than high school: 6.4% · High school graduate: 20.9% · Some college, no degree: 19.4% · Associate's degree: 8.1% · Bachelor's degree: 29.1% · Graduate or professional: 16.2% · High school or higher: 93.6% · Bachelor's or higher: 45.3%Glendale, California · Population: 192,270 · Population (margin of error): 67 · Population 25 years and over: 143,138 · Less than high school: 11.0% · High school graduate: 20.7% · Some college, no degree: 13.8% · Associate's degree: 8.9% · Bachelor's degree: 28.7% · Graduate or professional: 16.8% · High school or higher: 89.0% · Bachelor's or higher: 45.5%Wilmington, North Carolina · Population: 118,578 · Population (margin of error): 53 · Population 25 years and over: 79,945 · Less than high school: 6.5% · High school graduate: 18.0% · Some college, no degree: 18.9% · Associate's degree: 10.8% · Bachelor's degree: 29.2% · Graduate or professional: 16.7% · High school or higher: 93.5% · Bachelor's or higher: 45.8%Burbank, California · Population: 105,165 · Population (margin of error): 81 · Population 25 years and over: 77,510 · Less than high school: 7.7% · High school graduate: 14.9% · Some college, no degree: 20.8% · Associate's degree: 10.6% · Bachelor's degree: 31.0% · Graduate or professional: 15.1% · High school or higher: 92.3% · Bachelor's or higher: 46.0%Columbia, South Carolina · Population: 138,019 · Population (margin of error): 187 · Population 25 years and over: 79,229 · Less than high school: 9.1% · High school graduate: 19.2% · Some college, no degree: 18.2% · Associate's degree: 7.4% · Bachelor's degree: 25.2% · Graduate or professional: 20.9% · High school or higher: 90.9% · Bachelor's or higher: 46.1%Norman, Oklahoma · Population: 128,714 · Population (margin of error): 76 · Population 25 years and over: 75,889 · Less than high school: 6.0% · High school graduate: 19.2% · Some college, no degree: 21.1% · Associate's degree: 7.6% · Bachelor's degree: 24.2% · Graduate or professional: 22.0% · High school or higher: 94.0% · Bachelor's or higher: 46.2%Huntsville, Alabama · Population: 218,814 · Population (margin of error): 61 · Population 25 years and over: 148,695 · Less than high school: 8.4% · High school graduate: 17.3% · Some college, no degree: 20.8% · Associate's degree: 7.3% · Bachelor's degree: 26.7% · Graduate or professional: 19.5% · High school or higher: 91.6% · Bachelor's or higher: 46.2%San Jose, California · Population: 990,054 · Population (margin of error): 201 · Population 25 years and over: 692,220 · Less than high school: 14.5% · High school graduate: 16.4% · Some college, no degree: 15.5% · Associate's degree: 7.1% · Bachelor's degree: 26.2% · Graduate or professional: 20.3% · High school or higher: 85.5% · Bachelor's or higher: 46.5%Boise City, Idaho · Population: 235,701 · Population (margin of error): 54 · Population 25 years and over: 165,793 · Less than high school: 5.2% · High school graduate: 19.3% · Some college, no degree: 21.5% · Associate's degree: 7.3% · Bachelor's degree: 29.2% · Graduate or professional: 17.4% · High school or higher: 94.8% · Bachelor's or higher: 46.6%Chandler, Arizona · Population: 278,123 · Population (margin of error): 77 · Population 25 years and over: 191,470 · Less than high school: 6.3% · High school graduate: 16.2% · Some college, no degree: 21.2% · Associate's degree: 9.5% · Bachelor's degree: 28.6% · Graduate or professional: 18.2% · High school or higher: 93.7% · Bachelor's or higher: 46.8%Nashville-Davidson metropolitan government (balance), Tennessee · Population: 684,298 · Population (margin of error): 77 · Population 25 years and over: 475,321 · Less than high school: 9.8% · High school graduate: 20.2% · Some college, no degree: 17.0% · Associate's degree: 6.0% · Bachelor's degree: 29.1% · Graduate or professional: 17.8% · High school or higher: 90.2% · Bachelor's or higher: 46.9%Huntington Beach, California · Population: 196,010 · Population (margin of error): 78 · Population 25 years and over: 145,681 · Less than high school: 6.1% · High school graduate: 16.2% · Some college, no degree: 21.4% · Associate's degree: 9.2% · Bachelor's degree: 29.5% · Graduate or professional: 17.7% · High school or higher: 93.9% · Bachelor's or higher: 47.2%Lexington-Fayette urban county, Kentucky · Population: 321,122 · Population 25 years and over: 209,542 · Less than high school: 7.6% · High school graduate: 19.0% · Some college, no degree: 18.5% · Associate's degree: 7.6% · Bachelor's degree: 26.5% · Graduate or professional: 20.8% · High school or higher: 92.4% · Bachelor's or higher: 47.3%Pearland, Texas · Population: 125,983 · Population (margin of error): 75 · Population 25 years and over: 82,458 · Less than high school: 5.0% · High school graduate: 18.6% · Some college, no degree: 19.9% · Associate's degree: 9.1% · Bachelor's degree: 29.6% · Graduate or professional: 17.8% · High school or higher: 95.0% · Bachelor's or higher: 47.4%Charlotte, North Carolina · Population: 886,283 · Population (margin of error): 226 · Population 25 years and over: 596,846 · Less than high school: 10.4% · High school graduate: 16.6% · Some college, no degree: 17.5% · Associate's degree: 8.0% · Bachelor's degree: 30.4% · Graduate or professional: 17.0% · High school or higher: 89.6% · Bachelor's or higher: 47.4%Gilbert, Arizona · Population: 271,118 · Population (margin of error): 101 · Population 25 years and over: 170,619 · Less than high school: 3.5% · High school graduate: 16.1% · Some college, no degree: 22.0% · Associate's degree: 11.0% · Bachelor's degree: 30.7% · Graduate or professional: 16.7% · High school or higher: 96.5% · Bachelor's or higher: 47.5%Pittsburgh, Pennsylvania · Population: 303,620 · Population (margin of error): 57 · Population 25 years and over: 206,964 · Less than high school: 5.7% · High school graduate: 23.7% · Some college, no degree: 14.7% · Associate's degree: 8.0% · Bachelor's degree: 24.6% · Graduate or professional: 23.3% · High school or higher: 94.3% · Bachelor's or higher: 47.8%Oakland, California · Population: 438,072 · Population (margin of error): 58 · Population 25 years and over: 322,795 · Less than high school: 15.2% · High school graduate: 16.2% · Some college, no degree: 15.3% · Associate's degree: 5.4% · Bachelor's degree: 26.5% · Graduate or professional: 21.4% · High school or higher: 84.8% · Bachelor's or higher: 47.9%League City, Texas · Population: 114,885 · Population (margin of error): 119 · Population 25 years and over: 76,952 · Less than high school: 4.7% · High school graduate: 16.6% · Some college, no degree: 21.0% · Associate's degree: 9.8% · Bachelor's degree: 32.7% · Graduate or professional: 15.3% · High school or higher: 95.3% · Bachelor's or higher: 48.0%Quincy, Massachusetts · Population: 101,361 · Population (margin of error): 35 · Population 25 years and over: 78,526 · Less than high school: 10.0% · High school graduate: 20.6% · Some college, no degree: 13.6% · Associate's degree: 7.2% · Bachelor's degree: 28.0% · Graduate or professional: 20.7% · High school or higher: 90.0% · Bachelor's or higher: 48.6%Lee's Summit, Missouri · Population: 102,583 · Population (margin of error): 51 · Population 25 years and over: 68,901 · Less than high school: 2.6% · High school graduate: 18.7% · Some college, no degree: 21.0% · Associate's degree: 9.1% · Bachelor's degree: 29.5% · Graduate or professional: 19.3% · High school or higher: 97.4% · Bachelor's or higher: 48.7%Athens-Clarke County unified government (balance), Georgia · Population: 126,987 · Population (margin of error): 688 · Population 25 years and over: 72,684 · Less than high school: 10.1% · High school graduate: 17.7% · Some college, no degree: 16.5% · Associate's degree: 7.0% · Bachelor's degree: 24.3% · Graduate or professional: 24.5% · High school or higher: 89.9% · Bachelor's or higher: 48.7%Olathe, Kansas · Population: 143,720 · Population (margin of error): 63 · Population 25 years and over: 93,536 · Less than high school: 5.3% · High school graduate: 16.5% · Some college, no degree: 20.4% · Associate's degree: 8.4% · Bachelor's degree: 30.7% · Graduate or professional: 18.8% · High school or higher: 94.7% · Bachelor's or higher: 49.4%Tempe, Arizona · Population: 186,419 · Population (margin of error): 81 · Population 25 years and over: 118,108 · Less than high school: 6.2% · High school graduate: 15.5% · Some college, no degree: 21.0% · Associate's degree: 7.8% · Bachelor's degree: 28.9% · Graduate or professional: 20.6% · High school or higher: 93.8% · Bachelor's or higher: 49.5%San Diego, California · Population: 1,385,061 · Population (margin of error): 147 · Population 25 years and over: 976,916 · Less than high school: 9.8% · High school graduate: 15.0% · Some college, no degree: 17.8% · Associate's degree: 7.5% · Bachelor's degree: 28.8% · Graduate or professional: 21.1% · High school or higher: 90.2% · Bachelor's or higher: 49.9%Arvada, Colorado · Population: 122,835 · Population (margin of error): 66 · Population 25 years and over: 89,609 · Less than high school: 4.4% · High school graduate: 20.6% · Some college, no degree: 17.5% · Associate's degree: 7.5% · Bachelor's degree: 31.7% · Graduate or professional: 18.3% · High school or higher: 95.6% · Bachelor's or higher: 50.0%Rochester, Minnesota · Population: 121,638 · Population (margin of error): 72 · Population 25 years and over: 82,571 · Less than high school: 5.5% · High school graduate: 18.9% · Some college, no degree: 14.9% · Associate's degree: 10.6% · Bachelor's degree: 27.7% · Graduate or professional: 22.3% · High school or higher: 94.5% · Bachelor's or higher: 50.1%Salt Lake City, Utah · Population: 203,888 · Population (margin of error): 77 · Population 25 years and over: 138,184 · Less than high school: 8.4% · High school graduate: 17.1% · Some college, no degree: 16.9% · Associate's degree: 6.7% · Bachelor's degree: 28.9% · Graduate or professional: 22.0% · High school or higher: 91.6% · Bachelor's or higher: 50.9%Thousand Oaks, California · Population: 125,676 · Population (margin of error): 60 · Population 25 years and over: 89,351 · Less than high school: 5.4% · High school graduate: 14.3% · Some college, no degree: 18.9% · Associate's degree: 10.6% · Bachelor's degree: 29.5% · Graduate or professional: 21.4% · High school or higher: 94.6% · Bachelor's or higher: 50.9%Tallahassee, Florida · Population: 199,696 · Population (margin of error): 118 · Population 25 years and over: 110,484 · Less than high school: 6.3% · High school graduate: 17.6% · Some college, no degree: 17.1% · Associate's degree: 8.0% · Bachelor's degree: 28.3% · Graduate or professional: 22.8% · High school or higher: 93.7% · Bachelor's or higher: 51.1%Bend, Oregon · Population: 101,472 · Population (margin of error): 76 · Population 25 years and over: 73,778 · Less than high school: 3.8% · High school graduate: 15.2% · Some college, no degree: 20.4% · Associate's degree: 9.5% · Bachelor's degree: 31.6% · Graduate or professional: 19.5% · High school or higher: 96.2% · Bachelor's or higher: 51.1%Gainesville, Florida · Population: 143,611 · Population (margin of error): 98 · Population 25 years and over: 75,946 · Less than high school: 5.7% · High school graduate: 17.7% · Some college, no degree: 14.9% · Associate's degree: 10.0% · Bachelor's degree: 25.7% · Graduate or professional: 26.0% · High school or higher: 94.3% · Bachelor's or higher: 51.7%Stamford, Connecticut · Population: 135,806 · Population (margin of error): 40 · Population 25 years and over: 98,123 · Less than high school: 11.6% · High school graduate: 17.9% · Some college, no degree: 13.2% · Associate's degree: 5.5% · Bachelor's degree: 28.9% · Graduate or professional: 22.8% · High school or higher: 88.4% · Bachelor's or higher: 51.7%McKinney, Texas · Population: 202,314 · Population (margin of error): 65 · Population 25 years and over: 130,623 · Less than high school: 5.0% · High school graduate: 15.4% · Some college, no degree: 18.6% · Associate's degree: 8.5% · Bachelor's degree: 34.1% · Graduate or professional: 18.4% · High school or higher: 95.0% · Bachelor's or higher: 52.6%Raleigh, North Carolina · Population: 470,763 · Population (margin of error): 429 · Population 25 years and over: 321,398 · Less than high school: 7.5% · High school graduate: 15.9% · Some college, no degree: 16.2% · Associate's degree: 7.4% · Bachelor's degree: 32.5% · Graduate or professional: 20.4% · High school or higher: 92.5% · Bachelor's or higher: 52.9%Torrance, California · Population: 143,499 · Population (margin of error): 65 · Population 25 years and over: 105,006 · Less than high school: 5.1% · High school graduate: 17.1% · Some college, no degree: 16.5% · Associate's degree: 8.4% · Bachelor's degree: 34.2% · Graduate or professional: 18.8% · High school or higher: 94.9% · Bachelor's or higher: 53.0%Jersey City, New Jersey · Population: 289,691 · Population (margin of error): 57 · Population 25 years and over: 210,363 · Less than high school: 9.5% · High school graduate: 20.2% · Some college, no degree: 12.5% · Associate's degree: 4.7% · Bachelor's degree: 29.4% · Graduate or professional: 23.7% · High school or higher: 90.5% · Bachelor's or higher: 53.1%Portland, Oregon · Population: 642,715 · Population (margin of error): 699 · Population 25 years and over: 486,494 · Less than high school: 6.7% · High school graduate: 14.7% · Some college, no degree: 18.5% · Associate's degree: 6.7% · Bachelor's degree: 32.1% · Graduate or professional: 21.4% · High school or higher: 93.3% · Bachelor's or higher: 53.5%Boston, Massachusetts · Population: 663,972 · Population (margin of error): 76 · Population 25 years and over: 466,458 · Less than high school: 11.1% · High school graduate: 18.3% · Some college, no degree: 11.6% · Associate's degree: 4.9% · Bachelor's degree: 28.5% · Graduate or professional: 25.6% · High school or higher: 88.9% · Bachelor's or higher: 54.1%Minneapolis, Minnesota · Population: 426,845 · Population (margin of error): 69 · Population 25 years and over: 288,854 · Less than high school: 8.9% · High school graduate: 13.8% · Some college, no degree: 15.7% · Associate's degree: 7.2% · Bachelor's degree: 32.7% · Graduate or professional: 21.7% · High school or higher: 91.1% · Bachelor's or higher: 54.5%Denver, Colorado · Population: 713,734 · Population 25 years and over: 526,107 · Less than high school: 8.6% · High school graduate: 14.8% · Some college, no degree: 15.7% · Associate's degree: 5.3% · Bachelor's degree: 33.8% · Graduate or professional: 21.9% · High school or higher: 91.4% · Bachelor's or higher: 55.6%Durham, North Carolina · Population: 288,465 · Population (margin of error): 163 · Population 25 years and over: 197,842 · Less than high school: 8.6% · High school graduate: 15.4% · Some college, no degree: 13.7% · Associate's degree: 6.6% · Bachelor's degree: 28.8% · Graduate or professional: 26.9% · High school or higher: 91.4% · Bachelor's or higher: 55.7%Pasadena, California · Population: 136,462 · Population (margin of error): 63 · Population 25 years and over: 104,690 · Less than high school: 9.9% · High school graduate: 13.1% · Some college, no degree: 15.0% · Associate's degree: 6.0% · Bachelor's degree: 30.0% · Graduate or professional: 26.0% · High school or higher: 90.1% · Bachelor's or higher: 56.0%Allen, Texas · Population: 107,684 · Population (margin of error): 44 · Population 25 years and over: 70,744 · Less than high school: 4.1% · High school graduate: 13.0% · Some college, no degree: 19.0% · Associate's degree: 7.9% · Bachelor's degree: 33.6% · Graduate or professional: 22.6% · High school or higher: 95.9% · Bachelor's or higher: 56.1%Richardson, Texas · Population: 118,269 · Population (margin of error): 91 · Population 25 years and over: 78,285 · Less than high school: 6.8% · High school graduate: 11.9% · Some college, no degree: 16.7% · Associate's degree: 8.3% · Bachelor's degree: 33.1% · Graduate or professional: 23.1% · High school or higher: 93.2% · Bachelor's or higher: 56.2%Columbia, Missouri · Population: 127,200 · Population (margin of error): 64 · Population 25 years and over: 72,264 · Less than high school: 4.7% · High school graduate: 16.9% · Some college, no degree: 15.7% · Associate's degree: 6.2% · Bachelor's degree: 30.1% · Graduate or professional: 26.3% · High school or higher: 95.3% · Bachelor's or higher: 56.5%College Station, Texas · Population: 122,280 · Population (margin of error): 66 · Population 25 years and over: 52,468 · Less than high school: 5.4% · High school graduate: 14.4% · Some college, no degree: 16.9% · Associate's degree: 6.2% · Bachelor's degree: 29.5% · Graduate or professional: 27.6% · High school or higher: 94.6% · Bachelor's or higher: 57.1%San Mateo, California · Population: 103,555 · Population (margin of error): 58 · Population 25 years and over: 75,743 · Less than high school: 9.8% · High school graduate: 12.2% · Some college, no degree: 13.5% · Associate's degree: 6.9% · Bachelor's degree: 31.4% · Graduate or professional: 26.2% · High school or higher: 90.2% · Bachelor's or higher: 57.6%Charleston, South Carolina · Population: 152,014 · Population (margin of error): 77 · Population 25 years and over: 107,374 · Less than high school: 4.1% · High school graduate: 15.4% · Some college, no degree: 16.0% · Associate's degree: 6.8% · Bachelor's degree: 35.5% · Graduate or professional: 22.2% · High school or higher: 95.9% · Bachelor's or higher: 57.7%Austin, Texas · Population: 967,862 · Population (margin of error): 373 · Population 25 years and over: 691,306 · Less than high school: 8.4% · High school graduate: 13.2% · Some college, no degree: 14.8% · Associate's degree: 5.4% · Bachelor's degree: 36.2% · Graduate or professional: 22.1% · High school or higher: 91.6% · Bachelor's or higher: 58.2%Atlanta, Georgia · Population: 499,287 · Population (margin of error): 90 · Population 25 years and over: 349,497 · Less than high school: 7.0% · High school graduate: 16.0% · Some college, no degree: 13.6% · Associate's degree: 5.0% · Bachelor's degree: 32.8% · Graduate or professional: 25.6% · High school or higher: 93.0% · Bachelor's or higher: 58.4%Madison, Wisconsin · Population: 275,568 · Population (margin of error): 76 · Population 25 years and over: 174,658 · Less than high school: 4.3% · High school graduate: 14.6% · Some college, no degree: 14.4% · Associate's degree: 7.5% · Bachelor's degree: 33.5% · Graduate or professional: 25.6% · High school or higher: 95.7% · Bachelor's or higher: 59.2%Plano, Texas · Population: 287,339 · Population (margin of error): 74 · Population 25 years and over: 201,258 · Less than high school: 6.0% · High school graduate: 12.7% · Some college, no degree: 15.5% · Associate's degree: 6.5% · Bachelor's degree: 35.1% · Graduate or professional: 24.1% · High school or higher: 94.0% · Bachelor's or higher: 59.2%Fort Collins, Colorado · Population: 169,705 · Population (margin of error): 63 · Population 25 years and over: 104,369 · Less than high school: 2.4% · High school graduate: 13.5% · Some college, no degree: 16.1% · Associate's degree: 8.2% · Bachelor's degree: 34.3% · Graduate or professional: 25.5% · High school or higher: 97.6% · Bachelor's or higher: 59.9%San Francisco, California · Population: 836,321 · Population 25 years and over: 669,238 · Less than high school: 11.2% · High school graduate: 11.3% · Some college, no degree: 12.0% · Associate's degree: 5.3% · Bachelor's degree: 35.1% · Graduate or professional: 25.1% · High school or higher: 88.8% · Bachelor's or higher: 60.1%Carlsbad, California · Population: 114,500 · Population (margin of error): 85 · Population 25 years and over: 81,276 · Less than high school: 3.9% · High school graduate: 9.1% · Some college, no degree: 18.3% · Associate's degree: 7.2% · Bachelor's degree: 36.8% · Graduate or professional: 24.6% · High school or higher: 96.1% · Bachelor's or higher: 61.4%Scottsdale, Arizona · Population: 242,169 · Population (margin of error): 118 · Population 25 years and over: 192,166 · Less than high school: 2.5% · High school graduate: 11.2% · Some college, no degree: 17.9% · Associate's degree: 6.9% · Bachelor's degree: 37.1% · Graduate or professional: 24.4% · High school or higher: 97.5% · Bachelor's or higher: 61.5%Centennial, Colorado · Population: 107,386 · Population (margin of error): 70 · Population 25 years and over: 77,008 · Less than high school: 2.9% · High school graduate: 12.2% · Some college, no degree: 16.4% · Associate's degree: 6.6% · Bachelor's degree: 37.0% · Graduate or professional: 24.8% · High school or higher: 97.1% · Bachelor's or higher: 61.9%Sugar Land, Texas · Population: 109,735 · Population (margin of error): 64 · Population 25 years and over: 76,024 · Less than high school: 4.9% · High school graduate: 12.6% · Some college, no degree: 14.0% · Associate's degree: 6.2% · Bachelor's degree: 35.2% · Graduate or professional: 27.3% · High school or higher: 95.1% · Bachelor's or higher: 62.4%Fremont, California · Population: 228,518 · Population (margin of error): 57 · Population 25 years and over: 164,362 · Less than high school: 7.0% · High school graduate: 13.9% · Some college, no degree: 11.2% · Associate's degree: 5.2% · Bachelor's degree: 32.5% · Graduate or professional: 30.2% · High school or higher: 93.0% · Bachelor's or higher: 62.7%Overland Park, Kansas · Population: 197,199 · Population (margin of error): 94 · Population 25 years and over: 136,675 · Less than high school: 2.9% · High school graduate: 11.7% · Some college, no degree: 16.1% · Associate's degree: 6.4% · Bachelor's degree: 37.5% · Graduate or professional: 25.3% · High school or higher: 97.1% · Bachelor's or higher: 62.9%Columbia, Maryland · Population: 105,871 · Population (margin of error): 2,631 · Population 25 years and over: 74,177 · Less than high school: 4.4% · High school graduate: 11.8% · Some college, no degree: 13.7% · Associate's degree: 6.6% · Bachelor's degree: 29.0% · Graduate or professional: 34.5% · High school or higher: 95.6% · Bachelor's or higher: 63.5%Washington, District of Columbia · Population: 672,079 · Population 25 years and over: 484,406 · Less than high school: 7.2% · High school graduate: 14.5% · Some college, no degree: 11.8% · Associate's degree: 2.9% · Bachelor's degree: 26.1% · Graduate or professional: 37.5% · High school or higher: 92.8% · Bachelor's or higher: 63.6%The Woodlands, Texas · Population: 116,916 · Population (margin of error): 5,154 · Population 25 years and over: 76,794 · Less than high school: 2.7% · High school graduate: 10.2% · Some college, no degree: 16.6% · Associate's degree: 5.4% · Bachelor's degree: 37.2% · Graduate or professional: 27.9% · High school or higher: 97.3% · Bachelor's or higher: 65.1%Santa Clara, California · Population: 129,239 · Population (margin of error): 65 · Population 25 years and over: 93,057 · Less than high school: 6.0% · High school graduate: 10.7% · Some college, no degree: 11.6% · Associate's degree: 6.4% · Bachelor's degree: 31.4% · Graduate or professional: 33.9% · High school or higher: 94.0% · Bachelor's or higher: 65.3%Alexandria, Virginia · Population: 156,788 · Population 25 years and over: 118,944 · Less than high school: 7.1% · High school graduate: 10.6% · Some college, no degree: 11.5% · Associate's degree: 4.9% · Bachelor's degree: 31.4% · Graduate or professional: 34.4% · High school or higher: 92.9% · Bachelor's or higher: 65.8%Frisco, Texas · Population: 210,238 · Population (margin of error): 162 · Population 25 years and over: 136,812 · Less than high school: 3.7% · High school graduate: 9.6% · Some college, no degree: 14.0% · Associate's degree: 6.7% · Bachelor's degree: 38.5% · Graduate or professional: 27.4% · High school or higher: 96.3% · Bachelor's or higher: 66.0%Fishers, Indiana · Population: 100,918 · Population (margin of error): 35 · Population 25 years and over: 65,474 · Less than high school: 2.1% · High school graduate: 10.9% · Some college, no degree: 13.7% · Associate's degree: 7.0% · Bachelor's degree: 42.2% · Graduate or professional: 24.0% · High school or higher: 97.9% · Bachelor's or higher: 66.2%Highlands Ranch, Colorado · Population: 101,437 · Population (margin of error): 2,176 · Population 25 years and over: 69,044 · Less than high school: 1.1% · High school graduate: 8.8% · Some college, no degree: 16.1% · Associate's degree: 7.1% · Bachelor's degree: 41.4% · Graduate or professional: 25.5% · High school or higher: 98.9% · Bachelor's or higher: 66.8%Seattle, Washington · Population: 741,440 · Population (margin of error): 121 · Population 25 years and over: 562,706 · Less than high school: 4.3% · High school graduate: 9.5% · Some college, no degree: 12.9% · Associate's degree: 5.8% · Bachelor's degree: 37.6% · Graduate or professional: 30.0% · High school or higher: 95.7% · Bachelor's or higher: 67.5%Sunnyvale, California · Population: 153,455 · Population (margin of error): 92 · Population 25 years and over: 112,413 · Less than high school: 5.5% · High school graduate: 9.4% · Some college, no degree: 10.6% · Associate's degree: 5.4% · Bachelor's degree: 30.3% · Graduate or professional: 38.9% · High school or higher: 94.5% · Bachelor's or higher: 69.2%Sandy Springs, Georgia · Population: 107,198 · Population (margin of error): 40 · Population 25 years and over: 80,132 · Less than high school: 2.9% · High school graduate: 9.2% · Some college, no degree: 13.5% · Associate's degree: 4.6% · Bachelor's degree: 39.8% · Graduate or professional: 30.1% · High school or higher: 97.1% · Bachelor's or higher: 69.9%Cary, North Carolina · Population: 176,686 · Population (margin of error): 139 · Population 25 years and over: 121,355 · Less than high school: 3.7% · High school graduate: 8.0% · Some college, no degree: 11.8% · Associate's degree: 6.3% · Bachelor's degree: 37.4% · Graduate or professional: 32.9% · High school or higher: 96.3% · Bachelor's or higher: 70.2%Irvine, California · Population: 308,160 · Population (margin of error): 117 · Population 25 years and over: 201,490 · Less than high school: 3.4% · High school graduate: 7.0% · Some college, no degree: 12.5% · Associate's degree: 6.6% · Bachelor's degree: 39.4% · Graduate or professional: 31.2% · High school or higher: 96.6% · Bachelor's or higher: 70.6%Bellevue, Washington · Population: 151,199 · Population (margin of error): 61 · Population 25 years and over: 110,957 · Less than high school: 4.3% · High school graduate: 8.4% · Some college, no degree: 10.5% · Associate's degree: 5.4% · Bachelor's degree: 36.2% · Graduate or professional: 35.2% · High school or higher: 95.7% · Bachelor's or higher: 71.4%Naperville, Illinois · Population: 149,424 · Population (margin of error): 393 · Population 25 years and over: 102,088 · Less than high school: 2.8% · High school graduate: 9.3% · Some college, no degree: 11.3% · Associate's degree: 4.9% · Bachelor's degree: 38.8% · Graduate or professional: 33.0% · High school or higher: 97.2% · Bachelor's or higher: 71.7%Carmel, Indiana · Population: 100,501 · Population (margin of error): 198 · Population 25 years and over: 67,319 · Less than high school: 2.1% · High school graduate: 8.0% · Some college, no degree: 10.6% · Associate's degree: 4.8% · Bachelor's degree: 42.5% · Graduate or professional: 32.0% · High school or higher: 97.9% · Bachelor's or higher: 74.5%Berkeley, California · Population: 120,223 · Population (margin of error): 50 · Population 25 years and over: 76,405 · Less than high school: 3.9% · High school graduate: 6.6% · Some college, no degree: 10.4% · Associate's degree: 4.0% · Bachelor's degree: 33.4% · Graduate or professional: 41.6% · High school or higher: 96.1% · Bachelor's or higher: 75.1%Boulder, Colorado · Population: 106,274 · Population (margin of error): 49 · Population 25 years and over: 60,785 · Less than high school: 3.1% · High school graduate: 6.4% · Some college, no degree: 10.2% · Associate's degree: 3.5% · Bachelor's degree: 36.9% · Graduate or professional: 39.9% · High school or higher: 96.9% · Bachelor's or higher: 76.8%Arlington, Virginia · Population: 235,463 · Population 25 years and over: 173,227 · Less than high school: 4.6% · High school graduate: 7.1% · Some college, no degree: 8.0% · Associate's degree: 3.2% · Bachelor's degree: 35.7% · Graduate or professional: 41.4% · High school or higher: 95.4% · Bachelor's or higher: 77.1%Ann Arbor, Michigan · Population: 121,179 · Population (margin of error): 50 · Population 25 years and over: 67,239 · Less than high school: 2.4% · High school graduate: 7.0% · Some college, no degree: 8.9% · Associate's degree: 4.0% · Bachelor's degree: 30.5% · Graduate or professional: 47.2% · High school or higher: 97.6% · Bachelor's or higher: 77.7%Cambridge, Massachusetts · Population: 117,794 · Population (margin of error): 60 · Population 25 years and over: 79,431 · Less than high school: 4.3% · High school graduate: 6.0% · Some college, no degree: 7.1% · Associate's degree: 2.4% · Bachelor's degree: 29.8% · Graduate or professional: 50.4% · High school or higher: 95.7% · Bachelor's or higher: 80.2%New YorkLos AngelesChicagoHoustonPhoenixSan FranciscoSeattleDenverDallasAtlantaMiamiBostonMinneapolisDetroitNew OrleansWashingtonPortlandLas VegasSalt Lake CityKansas CityJacksonvilleCharlotteAnchorageUrban HonoluluBachelor's or higher10.6%80.2%
Summary

Darker amber is a higher share of adults 25 and over with a bachelor's degree or higher. Each city is a marked point on the US state map. Alaska and Hawaii are inset. Puerto Rico cities are in the ranking and table but are not drawn here.

Among the 346 US cities with at least 100,000 residents, a typical city has 34.7 percent of adults 25 and over with a bachelor's degree or higher, the midpoint, so half of these cities sit above that share and half sit below. Cambridge, Massachusetts is highest at 80.2 percent, then Ann Arbor, Michigan and Arlington, Virginia. East Los Angeles, California is lowest at 10.6 percent. 56 of the 346 cities have a bachelor's-or-higher majority. These are each city's own ACS shares of people 25 years and over, not a national average of people.

In short

34.7%typical citymidpoint bachelor's or higher share, not an average
80.2%Cambridge, Massachusettshighest bachelor's or higher share
10.6%East Los Angeles, Californialowest bachelor's or higher share in this set
56cities with a bachelor's majorityof 346 cities with 100,000 or more people
Figure 1

Bachelor's or higher, all published cities

Bachelor's or higher · all 346 · ranked high to low

346 items
View100%
DownloadPDFImageCSV
Bachelor's or higher, all published citiesEvery incorporated or Census place with at least 100,000 residents, 346 in all. Cambridge, Massachusetts leads at 80.2 percent, then Ann Arbor, Michigan at 77.7 percent and Arlington, Virginia at 77.1 percent. East Los Angeles, California is lowest at 10.6 percent. The middle city sits at 34.7 percent. 56 cities have a bachelor's-or-higher majority. Shares are of adults 25 years and over, ACS table B15003.0.0%20.0%40.0%60.0%80.0%100.0%Share of adults 25 and over, percent80.2%Cambridge, Massachusetts77.7%Ann Arbor, Michigan77.1%Arlington, Virginia76.8%Boulder, Colorado75.1%Berkeley, California74.5%Carmel, Indiana71.7%Naperville, Illinois71.4%Bellevue, Washington70.6%Irvine, California70.2%Cary, North Carolina69.9%Sandy Springs, Georgia69.2%Sunnyvale, California67.5%Seattle, Washington66.8%Highlands Ranch, Colorado66.2%Fishers, Indiana66.0%Frisco, Texas65.8%Alexandria, Virginia65.3%Santa Clara, California65.1%The Woodlands, Texas63.6%Washington, District of Col…63.5%Columbia, Maryland62.9%Overland Park, Kansas62.7%Fremont, California62.4%Sugar Land, Texas61.9%Centennial, Colorado61.5%Scottsdale, Arizona61.4%Carlsbad, California60.1%San Francisco, California59.9%Fort Collins, Colorado59.2%Plano, Texas59.2%Madison, Wisconsin58.4%Atlanta, Georgia58.2%Austin, Texas57.7%Charleston, South Carolina57.6%San Mateo, California57.1%College Station, Texas56.5%Columbia, Missouri56.2%Richardson, Texas56.1%Allen, Texas56.0%Pasadena, California55.7%Durham, North Carolina55.6%Denver, Colorado54.5%Minneapolis, Minnesota54.1%Boston, Massachusetts53.5%Portland, Oregon53.1%Jersey City, New Jersey53.0%Torrance, California52.9%Raleigh, North Carolina52.6%McKinney, Texas51.7%Stamford, Connecticut51.7%Gainesville, Florida51.1%Bend, Oregon51.1%Tallahassee, Florida50.9%Thousand Oaks, California50.9%Salt Lake City, Utah50.1%Rochester, Minnesota50.0%Arvada, Colorado49.9%San Diego, California49.5%Tempe, Arizona49.4%Olathe, Kansas48.7%Athens-Clarke County unifie…48.7%Lee's Summit, Missouri48.6%Quincy, Massachusetts48.0%League City, Texas47.9%Oakland, California47.8%Pittsburgh, Pennsylvania47.5%Gilbert, Arizona47.4%Charlotte, North Carolina47.4%Pearland, Texas47.3%Lexington-Fayette urban cou…47.2%Huntington Beach, California46.9%Nashville-Davidson metropol…46.8%Chandler, Arizona46.6%Boise City, Idaho46.5%San Jose, California46.2%Huntsville, Alabama46.2%Norman, Oklahoma46.1%Columbia, South Carolina46.0%Burbank, California45.8%Wilmington, North Carolina45.5%Glendale, California45.3%Lakewood, Colorado45.0%Provo, Utah44.8%Albany, New York44.6%Tampa, Florida44.4%Meridian, Idaho44.2%Eugene, Oregon44.1%Roseville, California44.1%Richmond, Virginia44.0%Westminster, Colorado44.0%Little Rock, Arkansas43.6%San Juan, Puerto Rico43.6%Fullerton, California43.6%Costa Mesa, California43.6%Round Rock, Texas43.5%St. Paul, Minnesota43.3%Chicago, Illinois43.3%Carrollton, Texas43.2%Fargo, North Dakota42.2%Orlando, Florida42.0%Hillsboro, Oregon42.0%New Orleans, Louisiana41.9%Colorado Springs, Colorado41.9%Denton, Texas41.7%Concord, North Carolina41.6%Irving, Texas41.3%Chico, California41.3%St. Petersburg, Florida41.3%Cincinnati, Ohio41.1%San Buenaventura (Ventura),…41.1%Murfreesboro, Tennessee41.0%New York, New York41.0%Lincoln, Nebraska40.8%Urban Honolulu, Hawaii40.6%Lafayette, Louisiana40.4%Virginia Beach, Virginia40.3%Omaha, Nebraska40.2%St. Louis, Missouri40.1%Orange, California40.1%Grand Rapids, Michigan39.9%Metairie, Louisiana39.9%Greensboro, North Carolina39.8%Fort Lauderdale, Florida39.7%Coral Springs, Florida39.4%Lewisville, Texas39.3%Santa Clarita, California39.2%Temecula, California39.1%Davie, Florida39.0%Renton, Washington38.9%South Fulton, Georgia38.7%Albuquerque, New Mexico38.2%Columbus, Ohio38.1%Pembroke Pines, Florida38.1%Tuscaloosa, Alabama38.0%Elk Grove, California38.0%Daly City, California38.0%Peoria, Illinois37.8%Los Angeles, California37.8%Kansas City, Missouri37.8%Concord, California37.7%New Haven, Connecticut37.7%Anchorage, Alaska37.7%West Palm Beach, Florida37.4%Simi Valley, California37.4%Sioux Falls, South Dakota37.4%Dallas, Texas37.3%Las Cruces, New Mexico37.3%Rancho Cucamonga, California37.2%Aurora, Illinois37.2%Winston-Salem, North Caroli…37.0%Billings, Montana36.8%Henderson, Nevada36.7%Clovis, California36.4%Chesapeake, Virginia36.4%Sacramento, California36.0%Houston, Texas35.8%Baton Rouge, Louisiana35.8%Carolina, Puerto Rico35.7%Reno, Nevada35.6%Miami, Florida35.5%Peoria, Arizona35.5%Chattanooga, Tennessee35.5%Goodyear, Arizona35.4%Baltimore, Maryland35.2%Enterprise, Nevada35.2%Yonkers, New York35.1%Springfield, Illinois35.0%Broken Arrow, Oklahoma34.9%Lubbock, Texas34.8%Long Beach, California34.8%Miramar, Florida34.8%Riverview, Florida34.8%Santa Rosa, California34.7%Providence, Rhode Island34.6%Philadelphia, Pennsylvania34.3%Dearborn, Michigan34.3%Oceanside, California34.2%Indianapolis city (balance)…34.1%Worcester, Massachusetts34.0%Oklahoma City, Oklahoma33.9%High Point, North Carolina33.8%Brandon, Florida33.7%Knoxville, Tennessee33.7%Midland, Texas33.6%Rio Rancho, New Mexico33.5%Montgomery, Alabama33.5%Tacoma, Washington33.5%Manchester, New Hampshire33.4%Louisville/Jefferson County…33.3%Tulsa, Oklahoma33.1%Arlington, Texas32.9%Aurora, Colorado32.9%Cedar Rapids, Iowa32.7%Hollywood, Florida32.7%Norfolk, Virginia32.6%Ponce, Puerto Rico32.6%Hayward, California32.6%Spokane, Washington32.6%Bayamón, Puerto Rico32.5%Richmond, California32.5%Clearwater, Florida32.3%Phoenix, Arizona32.3%Chula Vista, California32.2%Thornton, Colorado32.0%McAllen, Texas32.0%Savannah, Georgia31.8%Jacksonville, Florida31.8%Murrieta, California31.7%Fort Worth, Texas31.5%Vancouver, Washington31.5%Mobile, Alabama31.5%Mesa, Arizona31.4%Salem, Oregon31.2%Sterling Heights, Michigan31.1%Pompano Beach, Florida31.0%Spring Valley, Nevada31.0%Surprise, Arizona30.9%Corona, California30.9%Wichita, Kansas30.7%Tyler, Texas30.7%Birmingham, Alabama30.6%Clarksville, Tennessee30.5%Syracuse, New York30.3%Buffalo, New York30.3%Springfield, Missouri30.2%Tucson, Arizona30.0%Davenport, Iowa29.9%Rochester, New York29.9%Lowell, Massachusetts29.8%West Covina, California29.7%Columbus, Georgia29.6%Lansing, Michigan29.4%South Bend, Indiana29.4%Kent, Washington29.1%Topeka, Kansas29.1%Newport News, Virginia29.1%Grand Prairie, Texas29.0%Des Moines, Iowa28.9%Edinburg, Texas28.9%Everett, Washington28.8%Anaheim, California28.7%San Antonio, Texas28.6%West Jordan, Utah28.6%Waco, Texas28.6%Fayetteville, North Carolina28.6%Jackson, Mississippi28.5%Fort Wayne, Indiana28.2%Memphis, Tennessee28.0%North Charleston, South Car…27.9%Vallejo, California27.8%Escondido, California27.7%Lakeland, Florida27.6%Vacaville, California27.5%Shreveport, Louisiana27.5%Hampton, Virginia27.5%El Paso, Texas27.3%Las Vegas, Nevada27.1%Abilene, Texas26.8%Port St. Lucie, Florida26.7%Greeley, Colorado26.7%Fairfield, California26.6%Milwaukee, Wisconsin26.3%Sparks, Nevada26.0%Macon-Bibb County, Georgia26.0%Elgin, Illinois25.7%Riverside, California25.7%Cape Coral, Florida25.6%Downey, California25.5%Green Bay, Wisconsin25.2%Beaumont, Texas25.1%Amarillo, Texas25.0%Joliet, Illinois25.0%Wichita Falls, Texas25.0%Garland, Texas24.9%Garden Grove, California24.9%Fresno, California24.8%Spokane Valley, Washington24.3%Corpus Christi, Texas24.2%Augusta-Richmond County con…24.2%Inglewood, California24.0%San Tan Valley, Arizona23.9%Antioch, California23.9%Paradise, Nevada23.6%Nampa, Idaho23.6%Gresham, Oregon23.5%Glendale, Arizona23.3%Lynn, Massachusetts23.3%Akron, Ohio23.3%Bakersfield, California23.2%Rockford, Illinois23.1%Bridgeport, Connecticut22.9%Visalia, California22.8%Pueblo, Colorado22.7%Menifee, California22.6%Palm Bay, Florida22.3%Evansville, Indiana22.3%Brownsville, Texas22.2%El Cajon, California22.0%Killeen, Texas21.5%Laredo, Texas21.3%Norwalk, California21.3%Cleveland, Ohio21.3%Brockton, Massachusetts21.2%Hialeah, Florida21.0%Toledo, Ohio20.9%Independence, Missouri20.7%Ontario, California20.7%Dayton, Ohio20.4%Warren, Michigan20.4%Fontana, California20.3%Modesto, California20.2%Kansas City, Kansas20.1%Lancaster, California19.7%Spring Hill, Florida19.7%Springfield, Massachusetts19.6%Oxnard, California19.5%Pomona, California19.4%Allentown, Pennsylvania19.1%Stockton, California18.5%Mesquite, Texas18.3%Odessa, Texas18.3%Hartford, Connecticut18.2%North Las Vegas, Nevada18.0%Santa Ana, California17.6%Detroit, Michigan17.6%Miami Gardens, Florida17.4%Newark, New Jersey17.3%Moreno Valley, California17.0%Waterbury, Connecticut16.8%New Bedford, Massachusetts16.6%Palmdale, California16.1%Pasadena, Texas15.7%West Valley City, Utah15.6%Jurupa Valley, California15.6%Lehigh Acres, Florida15.5%Salinas, California15.1%Santa Maria, California14.7%El Monte, California14.2%Elizabeth, New Jersey12.8%San Bernardino, California12.5%Rialto, California12.5%Paterson, New Jersey12.4%Victorville, California12.3%Hesperia, California11.9%Sunrise Manor, Nevada10.6%East Los Angeles, California
Summary

Every incorporated or Census place with at least 100,000 residents, 346 in all. Cambridge, Massachusetts leads at 80.2 percent, then Ann Arbor, Michigan at 77.7 percent and Arlington, Virginia at 77.1 percent. East Los Angeles, California is lowest at 10.6 percent. The middle city sits at 34.7 percent. 56 cities have a bachelor's-or-higher majority. Shares are of adults 25 years and over, ACS table B15003.

Figure 2

High school or higher, all published cities

High school or higher · all 346 · ranked high to low

346 items
View100%
DownloadPDFImageCSV
High school or higher, all published citiesShare of adults 25 and over with at least a high school diploma or equivalency, for every included city. Highlands Ranch, Colorado leads at 98.9 percent, then Carmel, Indiana at 97.9 percent and Fishers, Indiana at 97.9 percent. East Los Angeles, California is lowest at 55.0 percent. The middle city sits at 89.3 percent. 155 cities reach 90 percent. High school or higher includes a regular diploma or GED through a doctorate.0.0%20.0%40.0%60.0%80.0%100.0%Share of adults 25 and over, percent98.9%Highlands Ranch, Colorado97.9%Carmel, Indiana97.9%Fishers, Indiana97.6%Fort Collins, Colorado97.6%Ann Arbor, Michigan97.5%Scottsdale, Arizona97.4%Lee's Summit, Missouri97.3%The Woodlands, Texas97.2%Naperville, Illinois97.1%Sandy Springs, Georgia97.1%Overland Park, Kansas97.1%Centennial, Colorado96.9%Boulder, Colorado96.6%Irvine, California96.5%Gilbert, Arizona96.3%Cary, North Carolina96.3%Frisco, Texas96.2%Bend, Oregon96.1%Carlsbad, California96.1%Berkeley, California95.9%Allen, Texas95.9%Charleston, South Carolina95.7%Seattle, Washington95.7%Cambridge, Massachusetts95.7%Meridian, Idaho95.7%Madison, Wisconsin95.7%Bellevue, Washington95.6%Arvada, Colorado95.6%Columbia, Maryland95.5%Roseville, California95.5%Billings, Montana95.4%Arlington, Virginia95.3%League City, Texas95.3%Columbia, Missouri95.3%Fargo, North Dakota95.1%Sugar Land, Texas95.0%McKinney, Texas95.0%Pearland, Texas94.9%Torrance, California94.8%Boise City, Idaho94.8%Eugene, Oregon94.7%Virginia Beach, Virginia94.7%Olathe, Kansas94.6%Thousand Oaks, California94.6%Colorado Springs, Colorado94.6%Spokane Valley, Washington94.6%College Station, Texas94.5%Sunnyvale, California94.5%Rochester, Minnesota94.4%Rio Rancho, New Mexico94.3%Coral Springs, Florida94.3%Broken Arrow, Oklahoma94.3%Gainesville, Florida94.3%Surprise, Arizona94.3%Pittsburgh, Pennsylvania94.2%Clarksville, Tennessee94.1%Cedar Rapids, Iowa94.0%Anchorage, Alaska94.0%Plano, Texas94.0%Santa Clara, California94.0%Norman, Oklahoma93.9%Huntington Beach, California93.9%Murfreesboro, Tennessee93.9%Round Rock, Texas93.9%Henderson, Nevada93.8%Tempe, Arizona93.7%Tallahassee, Florida93.7%Chandler, Arizona93.7%St. Petersburg, Florida93.6%Lakewood, Colorado93.6%Pembroke Pines, Florida93.5%Wilmington, North Carolina93.4%Chesapeake, Virginia93.4%San Tan Valley, Arizona93.4%Spokane, Washington93.4%Temecula, California93.4%Fayetteville, North Carolina93.3%Portland, Oregon93.2%Chico, California93.2%Murrieta, California93.2%Richardson, Texas93.2%Cape Coral, Florida93.1%Sioux Falls, South Dakota93.0%Lincoln, Nebraska93.0%South Fulton, Georgia93.0%Atlanta, Georgia93.0%Fremont, California92.9%Westminster, Colorado92.9%Alexandria, Virginia92.8%Washington, District of Col…92.7%Hampton, Virginia92.7%Riverview, Florida92.6%Springfield, Illinois92.6%Peoria, Arizona92.6%Davenport, Iowa92.5%Goodyear, Arizona92.5%Provo, Utah92.5%Raleigh, North Carolina92.4%Lexington-Fayette urban cou…92.4%Killeen, Texas92.3%Burbank, California92.3%Little Rock, Arkansas92.2%Denton, Texas92.2%Enterprise, Nevada92.1%Springfield, Missouri92.1%Peoria, Illinois92.1%Clovis, California92.0%Rancho Cucamonga, California91.9%Orlando, Florida91.8%Newport News, Virginia91.8%Topeka, Kansas91.8%Kansas City, Missouri91.8%Metairie, Louisiana91.7%Miramar, Florida91.6%Huntsville, Alabama91.6%Austin, Texas91.6%Salt Lake City, Utah91.5%Vacaville, California91.4%Davie, Florida91.4%Durham, North Carolina91.4%Denver, Colorado91.3%Concord, North Carolina91.3%Tuscaloosa, Alabama91.3%Santa Clarita, California91.3%Tacoma, Washington91.2%San Buenaventura (Ventura),…91.2%West Jordan, Utah91.1%Minneapolis, Minnesota91.1%Vancouver, Washington91.0%Mesa, Arizona90.9%Clearwater, Florida90.9%Port St. Lucie, Florida90.9%Simi Valley, California90.9%Columbia, South Carolina90.9%Lafayette, Louisiana90.9%Albuquerque, New Mexico90.9%Urban Honolulu, Hawaii90.8%Elk Grove, California90.8%Jacksonville, Florida90.8%Palm Bay, Florida90.6%Hillsboro, Oregon90.6%Mobile, Alabama90.6%Lakeland, Florida90.5%Omaha, Nebraska90.5%Louisville/Jefferson County…90.5%Jersey City, New Jersey90.5%St. Louis, Missouri90.2%Nashville-Davidson metropol…90.2%San Mateo, California90.2%San Diego, California90.2%Brandon, Florida90.2%Independence, Missouri90.1%Greensboro, North Carolina90.1%Pasadena, California90.0%Quincy, Massachusetts89.9%Lansing, Michigan89.9%Savannah, Georgia89.9%Athens-Clarke County unifie…89.8%Knoxville, Tennessee89.8%Fort Lauderdale, Florida89.8%Tampa, Florida89.8%Columbus, Ohio89.7%Spring Hill, Florida89.7%Lewisville, Texas89.7%Renton, Washington89.7%Cincinnati, Ohio89.6%Norfolk, Virginia89.6%Albany, New York89.6%Chattanooga, Tennessee89.6%Charlotte, North Carolina89.4%Carrollton, Texas89.4%Spring Valley, Nevada89.3%Evansville, Indiana89.3%Reno, Nevada89.3%Richmond, Virginia89.3%Hollywood, Florida89.2%Carolina, Puerto Rico89.2%Lubbock, Texas89.1%New Orleans, Louisiana89.0%Pueblo, Colorado89.0%Green Bay, Wisconsin89.0%Grand Rapids, Michigan89.0%Everett, Washington89.0%Nampa, Idaho89.0%Columbus, Georgia89.0%Glendale, California88.9%Fort Wayne, Indiana88.9%Boston, Massachusetts88.9%St. Paul, Minnesota88.8%San Francisco, California88.7%Manchester, New Hampshire88.7%Montgomery, Alabama88.7%Akron, Ohio88.7%Birmingham, Alabama88.7%Salem, Oregon88.7%Menifee, California88.5%Daly City, California88.4%Stamford, Connecticut88.4%Winston-Salem, North Caroli…88.3%Abilene, Texas88.3%Fullerton, California88.1%Orange, California88.1%Las Cruces, New Mexico88.1%Concord, California88.0%Toledo, Ohio88.0%Wichita, Kansas87.9%Augusta-Richmond County con…87.9%Thornton, Colorado87.9%Tyler, Texas87.8%Oklahoma City, Oklahoma87.8%Costa Mesa, California87.7%South Bend, Indiana87.6%Tulsa, Oklahoma87.5%Indianapolis city (balance)…87.5%Baton Rouge, Louisiana87.5%Sterling Heights, Michigan87.5%Vallejo, California87.4%Macon-Bibb County, Georgia87.4%Memphis, Tennessee87.4%Philadelphia, Pennsylvania87.3%Tucson, Arizona87.3%Shreveport, Louisiana87.3%Des Moines, Iowa87.2%Baltimore, Maryland87.2%Gresham, Oregon87.1%Sparks, Nevada87.1%Dayton, Ohio87.1%Fairfield, California86.9%Sacramento, California86.9%Kent, Washington86.8%Chicago, Illinois86.7%North Charleston, South Car…86.7%Wichita Falls, Texas86.7%Beaumont, Texas86.6%Buffalo, New York86.6%Aurora, Colorado86.5%Visalia, California86.5%Midland, Texas86.5%Jackson, Mississippi86.5%Oceanside, California86.4%High Point, North Carolina86.4%San Juan, Puerto Rico86.4%West Palm Beach, Florida86.2%Warren, Michigan86.2%Waco, Texas86.0%Arlington, Texas86.0%New Haven, Connecticut85.9%Amarillo, Texas85.8%Las Vegas, Nevada85.8%Corpus Christi, Texas85.8%Corona, California85.7%Chula Vista, California85.7%Worcester, Massachusetts85.5%Santa Rosa, California85.5%Paradise, Nevada85.5%San Jose, California85.5%Milwaukee, Wisconsin85.4%West Covina, California85.3%Pompano Beach, Florida85.2%Bayamón, Puerto Rico85.2%Syracuse, New York85.2%Antioch, California84.9%Rockford, Illinois84.9%Joliet, Illinois84.8%Oakland, California84.5%Glendale, Arizona84.4%El Cajon, California84.4%Phoenix, Arizona84.4%Rochester, New York84.3%San Antonio, Texas84.3%Fort Worth, Texas84.0%Dearborn, Michigan83.7%Yonkers, New York83.7%New York, New York83.5%Cleveland, Ohio83.5%Miami Gardens, Florida83.4%Detroit, Michigan83.3%Lowell, Massachusetts83.3%Modesto, California83.2%Greeley, Colorado83.1%Riverside, California83.0%North Las Vegas, Nevada82.5%Hayward, California82.3%Ponce, Puerto Rico82.1%Aurora, Illinois82.1%Lehigh Acres, Florida82.0%Lancaster, California81.9%Bakersfield, California81.9%Providence, Rhode Island81.9%El Paso, Texas81.8%Brockton, Massachusetts81.7%Grand Prairie, Texas81.6%Long Beach, California81.6%Odessa, Texas81.4%West Valley City, Utah81.3%Downey, California81.2%Kansas City, Kansas81.2%Allentown, Pennsylvania81.2%Elgin, Illinois80.9%Mesquite, Texas80.8%Dallas, Texas80.7%Edinburg, Texas80.5%Irving, Texas80.4%Waterbury, Connecticut80.4%Escondido, California80.3%Houston, Texas80.1%Fresno, California80.0%Miami, Florida79.9%Moreno Valley, California79.9%McAllen, Texas79.8%Springfield, Massachusetts79.4%Garland, Texas79.3%Los Angeles, California79.2%Richmond, California79.0%Fontana, California78.4%Lynn, Massachusetts77.9%Ontario, California77.8%Bridgeport, Connecticut77.5%Anaheim, California77.4%Hesperia, California77.3%Inglewood, California77.3%Norwalk, California77.2%Newark, New Jersey77.2%Victorville, California77.1%Stockton, California77.0%Palmdale, California76.1%Paterson, New Jersey76.1%New Bedford, Massachusetts75.7%Rialto, California75.4%Garden Grove, California75.3%Hialeah, Florida74.3%Elizabeth, New Jersey74.3%Hartford, Connecticut74.2%Pomona, California73.8%San Bernardino, California73.6%Jurupa Valley, California73.1%Sunrise Manor, Nevada72.6%Pasadena, Texas70.8%Brownsville, Texas70.5%Laredo, Texas69.2%Oxnard, California66.1%Santa Ana, California64.2%El Monte, California63.3%Santa Maria, California62.4%Salinas, California55.0%East Los Angeles, California
Summary

Share of adults 25 and over with at least a high school diploma or equivalency, for every included city. Highlands Ranch, Colorado leads at 98.9 percent, then Carmel, Indiana at 97.9 percent and Fishers, Indiana at 97.9 percent. East Los Angeles, California is lowest at 55.0 percent. The middle city sits at 89.3 percent. 155 cities reach 90 percent. High school or higher includes a regular diploma or GED through a doctorate.

Figure 3

Graduate or professional degree, all published cities

Graduate or professional · all 346 · ranked high to low

346 items
View100%
DownloadPDFImageCSV
Graduate or professional degree, all published citiesShare of adults 25 and over with a master's, professional or doctorate degree, for every included city. Cambridge, Massachusetts leads at 50.4 percent, then Ann Arbor, Michigan at 47.2 percent and Berkeley, California at 41.6 percent. Paterson, New Jersey is lowest at 2.9 percent. The middle city sits at 12.9 percent. These bars are graduate credentials only, not the bachelor's-or-higher total.0.0%20.0%40.0%60.0%Share of adults 25 and over, percent50.4%Cambridge, Massachusetts47.2%Ann Arbor, Michigan41.6%Berkeley, California41.4%Arlington, Virginia39.9%Boulder, Colorado38.9%Sunnyvale, California37.5%Washington, District of Col…35.2%Bellevue, Washington34.5%Columbia, Maryland34.4%Alexandria, Virginia33.9%Santa Clara, California33.0%Naperville, Illinois32.9%Cary, North Carolina32.0%Carmel, Indiana31.2%Irvine, California30.2%Fremont, California30.1%Sandy Springs, Georgia30.0%Seattle, Washington27.9%The Woodlands, Texas27.6%College Station, Texas27.4%Frisco, Texas27.3%Sugar Land, Texas26.9%Durham, North Carolina26.3%Columbia, Missouri26.2%San Mateo, California26.0%Pasadena, California26.0%Gainesville, Florida25.6%Madison, Wisconsin25.6%Atlanta, Georgia25.6%Boston, Massachusetts25.5%Fort Collins, Colorado25.5%Highlands Ranch, Colorado25.3%Overland Park, Kansas25.1%San Francisco, California24.8%Centennial, Colorado24.6%Carlsbad, California24.5%Athens-Clarke County unifie…24.4%Scottsdale, Arizona24.1%Plano, Texas24.0%Fishers, Indiana23.7%Jersey City, New Jersey23.3%Pittsburgh, Pennsylvania23.1%Richardson, Texas22.8%Tallahassee, Florida22.8%Stamford, Connecticut22.6%Allen, Texas22.3%Rochester, Minnesota22.2%Charleston, South Carolina22.1%Austin, Texas22.0%Salt Lake City, Utah22.0%Norman, Oklahoma21.9%Denver, Colorado21.7%Minneapolis, Minnesota21.4%Thousand Oaks, California21.4%Portland, Oregon21.4%Oakland, California21.1%San Diego, California20.9%Columbia, South Carolina20.8%Lexington-Fayette urban cou…20.8%Albany, New York20.7%Quincy, Massachusetts20.6%Tempe, Arizona20.6%Eugene, Oregon20.4%Raleigh, North Carolina20.4%New Haven, Connecticut20.3%San Jose, California19.5%Bend, Oregon19.5%Huntsville, Alabama19.4%New Orleans, Louisiana19.3%Lee's Summit, Missouri19.0%Little Rock, Arkansas18.8%Torrance, California18.8%Olathe, Kansas18.4%McKinney, Texas18.4%Chicago, Illinois18.4%Hillsboro, Oregon18.3%St. Paul, Minnesota18.3%Tampa, Florida18.3%Arvada, Colorado18.2%St. Louis, Missouri18.2%Chandler, Arizona18.0%Richmond, Virginia18.0%Cincinnati, Ohio17.8%Nashville-Davidson metropol…17.8%Pearland, Texas17.8%Albuquerque, New Mexico17.7%Huntington Beach, California17.6%San Juan, Puerto Rico17.4%Boise City, Idaho17.4%New York, New York17.3%Baltimore, Maryland17.1%Las Cruces, New Mexico17.0%Charlotte, North Carolina16.8%Tuscaloosa, Alabama16.8%Glendale, California16.8%Irving, Texas16.7%Gilbert, Arizona16.7%Colorado Springs, Colorado16.7%Wilmington, North Carolina16.5%Concord, North Carolina16.4%Providence, Rhode Island16.4%Peoria, Illinois16.2%Lakewood, Colorado16.2%Fullerton, California16.1%Orlando, Florida16.0%Denton, Texas16.0%Fort Lauderdale, Florida15.8%San Buenaventura (Ventura),…15.8%Baton Rouge, Louisiana15.7%Greensboro, North Carolina15.6%Winston-Salem, North Caroli…15.6%Yonkers, New York15.5%Urban Honolulu, Hawaii15.5%Round Rock, Texas15.4%Virginia Beach, Virginia15.3%Philadelphia, Pennsylvania15.3%League City, Texas15.2%St. Petersburg, Florida15.1%Meridian, Idaho15.1%Coral Springs, Florida15.1%Burbank, California15.0%Metairie, Louisiana14.9%Springfield, Illinois14.7%Aurora, Illinois14.7%South Fulton, Georgia14.7%Omaha, Nebraska14.6%Davie, Florida14.6%Houston, Texas14.5%Lincoln, Nebraska14.5%Dallas, Texas14.5%Rancho Cucamonga, California14.4%Chico, California14.4%Murfreesboro, Tennessee14.3%Reno, Nevada14.3%Anchorage, Alaska14.3%Pembroke Pines, Florida14.2%Westminster, Colorado14.2%Carrollton, Texas14.2%West Palm Beach, Florida14.2%Fargo, North Dakota14.2%Dearborn, Michigan14.1%Montgomery, Alabama14.1%Miami, Florida14.1%Orange, California14.1%Columbus, Ohio14.1%Lubbock, Texas14.1%Roseville, California14.0%Kansas City, Missouri14.0%Chesapeake, Virginia14.0%Worcester, Massachusetts14.0%Peoria, Arizona13.9%Chattanooga, Tennessee13.9%Clovis, California13.8%Provo, Utah13.7%Grand Rapids, Michigan13.6%Henderson, Nevada13.6%Sacramento, California13.6%Renton, Washington13.6%Lafayette, Louisiana13.5%Temecula, California13.5%Louisville/Jefferson County…13.4%Santa Rosa, California13.4%Buffalo, New York13.4%Norfolk, Virginia13.3%Los Angeles, California13.3%Syracuse, New York13.3%Goodyear, Arizona13.2%Knoxville, Tennessee13.2%Lewisville, Texas13.1%Riverview, Florida13.1%Macon-Bibb County, Georgia12.9%Rio Rancho, New Mexico12.9%Hollywood, Florida12.8%Santa Clarita, California12.7%Costa Mesa, California12.6%Rochester, New York12.6%Elk Grove, California12.6%Tacoma, Washington12.6%Long Beach, California12.6%Simi Valley, California12.5%Indianapolis city (balance)…12.5%South Bend, Indiana12.5%Phoenix, Arizona12.5%Tucson, Arizona12.5%Tulsa, Oklahoma12.5%Oklahoma City, Oklahoma12.4%Richmond, California12.4%Jackson, Mississippi12.4%Miramar, Florida12.3%High Point, North Carolina12.3%Birmingham, Alabama12.2%Oceanside, California12.2%Salem, Oregon12.2%Columbus, Georgia12.1%Spokane, Washington12.0%Billings, Montana12.0%Sioux Falls, South Dakota12.0%Shreveport, Louisiana11.9%Lowell, Massachusetts11.9%Clearwater, Florida11.7%McAllen, Texas11.7%Concord, California11.6%Clarksville, Tennessee11.6%Springfield, Missouri11.5%Mobile, Alabama11.5%Vancouver, Washington11.5%Aurora, Colorado11.5%Savannah, Georgia11.4%Newport News, Virginia11.3%Lansing, Michigan11.3%Memphis, Tennessee11.3%Arlington, Texas11.3%Murrieta, California11.2%Waco, Texas11.2%Wichita, Kansas11.2%Pompano Beach, Florida11.1%Surprise, Arizona11.1%Davenport, Iowa11.1%Fort Worth, Texas11.0%San Antonio, Texas11.0%Enterprise, Nevada10.9%Manchester, New Hampshire10.8%Greeley, Colorado10.7%Cedar Rapids, Iowa10.7%Sterling Heights, Michigan10.6%Topeka, Kansas10.6%Broken Arrow, Oklahoma10.5%Mesa, Arizona10.5%Riverside, California10.4%Ponce, Puerto Rico10.4%Hampton, Virginia10.4%Chula Vista, California10.3%Tyler, Texas10.2%Brandon, Florida10.2%Jacksonville, Florida10.1%Corona, California10.0%Fayetteville, North Carolina10.0%Las Vegas, Nevada9.9%Lakeland, Florida9.9%Thornton, Colorado9.8%North Charleston, South Car…9.8%Midland, Texas9.5%Escondido, California9.5%Augusta-Richmond County con…9.5%Abilene, Texas9.4%Hayward, California9.4%Sparks, Nevada9.4%Carolina, Puerto Rico9.4%Edinburg, Texas9.4%Milwaukee, Wisconsin9.3%Anaheim, California9.2%Grand Prairie, Texas9.2%El Paso, Texas9.1%Fort Wayne, Indiana9.1%Elgin, Illinois9.1%Des Moines, Iowa9.1%Port St. Lucie, Florida9.1%Spring Valley, Nevada9.1%Everett, Washington9.0%Joliet, Illinois9.0%Cape Coral, Florida8.9%Wichita Falls, Texas8.9%Springfield, Massachusetts8.9%Fairfield, California8.8%Cleveland, Ohio8.8%Daly City, California8.7%Vacaville, California8.7%Garland, Texas8.6%Bridgeport, Connecticut8.6%Corpus Christi, Texas8.6%Visalia, California8.5%West Jordan, Utah8.5%West Covina, California8.4%Rockford, Illinois8.4%Bayamón, Puerto Rico8.3%Gresham, Oregon8.2%Vallejo, California8.2%Kent, Washington8.2%Palm Bay, Florida8.2%Bakersfield, California8.2%Fresno, California8.1%Amarillo, Texas8.1%Glendale, Arizona8.0%Akron, Ohio8.0%Spokane Valley, Washington7.9%Hartford, Connecticut7.9%Pueblo, Colorado7.9%Beaumont, Texas7.9%Paradise, Nevada7.8%Menifee, California7.8%Lynn, Massachusetts7.8%Downey, California7.8%Dayton, Ohio7.8%Inglewood, California7.6%Kansas City, Kansas7.4%Lancaster, California7.2%Toledo, Ohio7.2%Independence, Missouri7.2%Waterbury, Connecticut7.1%Green Bay, Wisconsin7.1%Evansville, Indiana7.1%Detroit, Michigan6.9%Warren, Michigan6.9%El Cajon, California6.9%Nampa, Idaho6.7%Brockton, Massachusetts6.5%Modesto, California6.5%Brownsville, Texas6.4%Laredo, Texas6.4%Hialeah, Florida6.4%Antioch, California6.3%Oxnard, California6.2%Spring Hill, Florida6.2%San Tan Valley, Arizona6.1%Stockton, California6.0%Garden Grove, California6.0%Mesquite, Texas6.0%Miami Gardens, Florida5.9%Killeen, Texas5.9%North Las Vegas, Nevada5.8%Pomona, California5.7%Odessa, Texas5.7%Fontana, California5.6%Ontario, California5.5%Norwalk, California5.5%Allentown, Pennsylvania5.4%Pasadena, Texas5.3%Moreno Valley, California5.2%Palmdale, California5.2%Newark, New Jersey5.2%Santa Ana, California5.1%New Bedford, Massachusetts5.0%Jurupa Valley, California4.4%Elizabeth, New Jersey4.4%Lehigh Acres, Florida4.2%Victorville, California4.1%Salinas, California4.1%Hesperia, California4.0%Santa Maria, California3.9%San Bernardino, California3.7%West Valley City, Utah3.3%Rialto, California3.3%Sunrise Manor, Nevada3.2%El Monte, California3.0%East Los Angeles, California2.9%Paterson, New Jersey
Summary

Share of adults 25 and over with a master's, professional or doctorate degree, for every included city. Cambridge, Massachusetts leads at 50.4 percent, then Ann Arbor, Michigan at 47.2 percent and Berkeley, California at 41.6 percent. Paterson, New Jersey is lowest at 2.9 percent. The middle city sits at 12.9 percent. These bars are graduate credentials only, not the bachelor's-or-higher total.

Table 1

All cities

346 rows · 12 columns · sorted by bachelor's or higher, high to low

346 rows
View100%
DownloadPDFImageCSV
Summary

Educational attainment for every US city of 100,000 or more, 346 in all, from ACS table B15003. Shares are of the population 25 years and over. Less than high school through graduate or professional are mutually exclusive highest credentials and sum to 100 percent. High school or higher and bachelor's or higher are cumulative. Sort any column or use the filter box to jump to a city by name. A city midpoint cannot be averaged into a United States figure.

All cities
???????
Cambridge, Massachusetts117,7946079,4314.3%6.0%7.1%2.4%29.8%50.4%95.7%80.2%
Ann Arbor, Michigan121,1795067,2392.4%7.0%8.9%4.0%30.5%47.2%97.6%77.7%
Arlington, Virginia235,463, 173,2274.6%7.1%8.0%3.2%35.7%41.4%95.4%77.1%
Boulder, Colorado106,2744960,7853.1%6.4%10.2%3.5%36.9%39.9%96.9%76.8%
Berkeley, California120,2235076,4053.9%6.6%10.4%4.0%33.4%41.6%96.1%75.1%
Carmel, Indiana100,50119867,3192.1%8.0%10.6%4.8%42.5%32.0%97.9%74.5%
Naperville, Illinois149,424393102,0882.8%9.3%11.3%4.9%38.8%33.0%97.2%71.7%
Bellevue, Washington151,19961110,9574.3%8.4%10.5%5.4%36.2%35.2%95.7%71.4%
Irvine, California308,160117201,4903.4%7.0%12.5%6.6%39.4%31.2%96.6%70.6%
Cary, North Carolina176,686139121,3553.7%8.0%11.8%6.3%37.4%32.9%96.3%70.2%
Sandy Springs, Georgia107,1984080,1322.9%9.2%13.5%4.6%39.8%30.1%97.1%69.9%
Sunnyvale, California153,45592112,4135.5%9.4%10.6%5.4%30.3%38.9%94.5%69.2%
Seattle, Washington741,440121562,7064.3%9.5%12.9%5.8%37.6%30.0%95.7%67.5%
Highlands Ranch, Colorado101,4372,17669,0441.1%8.8%16.1%7.1%41.4%25.5%98.9%66.8%
Fishers, Indiana100,9183565,4742.1%10.9%13.7%7.0%42.2%24.0%97.9%66.2%
Frisco, Texas210,238162136,8123.7%9.6%14.0%6.7%38.5%27.4%96.3%66.0%
Alexandria, Virginia156,788, 118,9447.1%10.6%11.5%4.9%31.4%34.4%92.9%65.8%
Santa Clara, California129,2396593,0576.0%10.7%11.6%6.4%31.4%33.9%94.0%65.3%
The Woodlands, Texas116,9165,15476,7942.7%10.2%16.6%5.4%37.2%27.9%97.3%65.1%
Washington, District of Columbia672,079, 484,4067.2%14.5%11.8%2.9%26.1%37.5%92.8%63.6%
Columbia, Maryland105,8712,63174,1774.4%11.8%13.7%6.6%29.0%34.5%95.6%63.5%
Overland Park, Kansas197,19994136,6752.9%11.7%16.1%6.4%37.5%25.3%97.1%62.9%
Fremont, California228,51857164,3627.0%13.9%11.2%5.2%32.5%30.2%93.0%62.7%
Sugar Land, Texas109,7356476,0244.9%12.6%14.0%6.2%35.2%27.3%95.1%62.4%
Centennial, Colorado107,3867077,0082.9%12.2%16.4%6.6%37.0%24.8%97.1%61.9%
Scottsdale, Arizona242,169118192,1662.5%11.2%17.9%6.9%37.1%24.4%97.5%61.5%
Carlsbad, California114,5008581,2763.9%9.1%18.3%7.2%36.8%24.6%96.1%61.4%
San Francisco, California836,321, 669,23811.2%11.3%12.0%5.3%35.1%25.1%88.8%60.1%
Fort Collins, Colorado169,70563104,3692.4%13.5%16.1%8.2%34.3%25.5%97.6%59.9%
Plano, Texas287,33974201,2586.0%12.7%15.5%6.5%35.1%24.1%94.0%59.2%
Madison, Wisconsin275,56876174,6584.3%14.6%14.4%7.5%33.5%25.6%95.7%59.2%
Atlanta, Georgia499,28790349,4977.0%16.0%13.6%5.0%32.8%25.6%93.0%58.4%
Austin, Texas967,862373691,3068.4%13.2%14.8%5.4%36.2%22.1%91.6%58.2%
Charleston, South Carolina152,01477107,3744.1%15.4%16.0%6.8%35.5%22.2%95.9%57.7%
San Mateo, California103,5555875,7439.8%12.2%13.5%6.9%31.4%26.2%90.2%57.6%
College Station, Texas122,2806652,4685.4%14.4%16.9%6.2%29.5%27.6%94.6%57.1%
Columbia, Missouri127,2006472,2644.7%16.9%15.7%6.2%30.1%26.3%95.3%56.5%
Richardson, Texas118,2699178,2856.8%11.9%16.7%8.3%33.1%23.1%93.2%56.2%
Allen, Texas107,6844470,7444.1%13.0%19.0%7.9%33.6%22.6%95.9%56.1%
Pasadena, California136,46263104,6909.9%13.1%15.0%6.0%30.0%26.0%90.1%56.0%
Durham, North Carolina288,465163197,8428.6%15.4%13.7%6.6%28.8%26.9%91.4%55.7%
Denver, Colorado713,734, 526,1078.6%14.8%15.7%5.3%33.8%21.9%91.4%55.6%
Minneapolis, Minnesota426,84569288,8548.9%13.8%15.7%7.2%32.7%21.7%91.1%54.5%
Boston, Massachusetts663,97276466,45811.1%18.3%11.6%4.9%28.5%25.6%88.9%54.1%
Portland, Oregon642,715699486,4946.7%14.7%18.5%6.7%32.1%21.4%93.3%53.5%
Jersey City, New Jersey289,69157210,3639.5%20.2%12.5%4.7%29.4%23.7%90.5%53.1%
Torrance, California143,49965105,0065.1%17.1%16.5%8.4%34.2%18.8%94.9%53.0%
Raleigh, North Carolina470,763429321,3987.5%15.9%16.2%7.4%32.5%20.4%92.5%52.9%
McKinney, Texas202,31465130,6235.0%15.4%18.6%8.5%34.1%18.4%95.0%52.6%
Stamford, Connecticut135,8064098,12311.6%17.9%13.2%5.5%28.9%22.8%88.4%51.7%
Gainesville, Florida143,6119875,9465.7%17.7%14.9%10.0%25.7%26.0%94.3%51.7%
Bend, Oregon101,4727673,7783.8%15.2%20.4%9.5%31.6%19.5%96.2%51.1%
Tallahassee, Florida199,696118110,4846.3%17.6%17.1%8.0%28.3%22.8%93.7%51.1%
Thousand Oaks, California125,6766089,3515.4%14.3%18.9%10.6%29.5%21.4%94.6%50.9%
Salt Lake City, Utah203,88877138,1848.4%17.1%16.9%6.7%28.9%22.0%91.6%50.9%
Rochester, Minnesota121,6387282,5715.5%18.9%14.9%10.6%27.7%22.3%94.5%50.1%
Arvada, Colorado122,8356689,6094.4%20.6%17.5%7.5%31.7%18.3%95.6%50.0%
San Diego, California1,385,061147976,9169.8%15.0%17.8%7.5%28.8%21.1%90.2%49.9%
Tempe, Arizona186,41981118,1086.2%15.5%21.0%7.8%28.9%20.6%93.8%49.5%
Olathe, Kansas143,7206393,5365.3%16.5%20.4%8.4%30.7%18.8%94.7%49.4%
Athens-Clarke County unified government (balance), Georgia126,98768872,68410.1%17.7%16.5%7.0%24.3%24.5%89.9%48.7%
Lee's Summit, Missouri102,5835168,9012.6%18.7%21.0%9.1%29.5%19.3%97.4%48.7%
Quincy, Massachusetts101,3613578,52610.0%20.6%13.6%7.2%28.0%20.7%90.0%48.6%
League City, Texas114,88511976,9524.7%16.6%21.0%9.8%32.7%15.3%95.3%48.0%
Oakland, California438,07258322,79515.2%16.2%15.3%5.4%26.5%21.4%84.8%47.9%
Pittsburgh, Pennsylvania303,62057206,9645.7%23.7%14.7%8.0%24.6%23.3%94.3%47.8%
Gilbert, Arizona271,118101170,6193.5%16.1%22.0%11.0%30.7%16.7%96.5%47.5%
Charlotte, North Carolina886,283226596,84610.4%16.6%17.5%8.0%30.4%17.0%89.6%47.4%
Pearland, Texas125,9837582,4585.0%18.6%19.9%9.1%29.6%17.8%95.0%47.4%
Lexington-Fayette urban county, Kentucky321,122, 209,5427.6%19.0%18.5%7.6%26.5%20.8%92.4%47.3%
Huntington Beach, California196,01078145,6816.1%16.2%21.4%9.2%29.5%17.7%93.9%47.2%
Nashville-Davidson metropolitan government (balance), Tennessee684,29877475,3219.8%20.2%17.0%6.0%29.1%17.8%90.2%46.9%
Chandler, Arizona278,12377191,4706.3%16.2%21.2%9.5%28.6%18.2%93.7%46.8%
Boise City, Idaho235,70154165,7935.2%19.3%21.5%7.3%29.2%17.4%94.8%46.6%
San Jose, California990,054201692,22014.5%16.4%15.5%7.1%26.2%20.3%85.5%46.5%
Huntsville, Alabama218,81461148,6958.4%17.3%20.8%7.3%26.7%19.5%91.6%46.2%
Norman, Oklahoma128,7147675,8896.0%19.2%21.1%7.6%24.2%22.0%94.0%46.2%
Columbia, South Carolina138,01918779,2299.1%19.2%18.2%7.4%25.2%20.9%90.9%46.1%
Burbank, California105,1658177,5107.7%14.9%20.8%10.6%31.0%15.1%92.3%46.0%
Wilmington, North Carolina118,5785379,9456.5%18.0%18.9%10.8%29.2%16.7%93.5%45.8%
Glendale, California192,27067143,13811.0%20.7%13.8%8.9%28.7%16.8%89.0%45.5%
Lakewood, Colorado156,309154116,5006.4%20.9%19.4%8.1%29.1%16.2%93.6%45.3%
Provo, Utah114,3034847,4877.5%14.4%24.4%8.7%31.1%13.8%92.5%45.0%
Albany, New York100,0814863,07210.4%20.4%15.6%8.8%24.0%20.8%89.6%44.8%
Tampa, Florida393,389134269,69010.2%22.5%14.7%8.0%26.3%18.3%89.8%44.6%
Meridian, Idaho124,8657581,8424.3%17.4%24.5%9.4%29.3%15.1%95.7%44.4%
Eugene, Oregon177,52070117,2175.2%17.4%24.3%8.8%23.7%20.6%94.8%44.2%
Roseville, California152,43880106,9054.5%15.8%24.3%11.3%30.0%14.1%95.5%44.1%
Richmond, Virginia227,595, 160,96510.7%21.2%18.8%5.3%26.0%18.0%89.3%44.1%
Westminster, Colorado115,5468382,9667.1%20.4%20.4%8.1%29.8%14.2%92.9%44.0%
Little Rock, Arkansas202,73978135,1367.7%21.2%20.7%6.5%25.0%19.0%92.3%44.0%
San Juan, Puerto Rico320,6911,975240,24513.6%20.3%10.7%11.8%26.0%17.6%86.4%43.6%
Fullerton, California141,2786595,07011.7%15.7%20.7%8.2%27.4%16.2%88.3%43.6%
Costa Mesa, California110,5388379,86512.2%16.6%20.2%7.4%30.9%12.7%87.8%43.6%
Round Rock, Texas124,28889882,0886.1%19.0%21.8%9.5%28.1%15.5%93.9%43.6%
St. Paul, Minnesota307,76248202,08211.1%20.8%16.9%7.7%25.2%18.3%88.9%43.5%
Chicago, Illinois2,707,648721,914,61613.2%21.3%16.4%5.8%24.9%18.4%86.8%43.3%
Carrollton, Texas132,74117095,05810.6%17.8%20.9%7.4%29.1%14.2%89.4%43.3%
Fargo, North Dakota129,0644981,1984.7%18.7%20.7%12.7%29.0%14.2%95.3%43.2%
Orlando, Florida311,732141220,4788.1%23.1%15.7%10.9%26.1%16.1%91.9%42.2%
Hillsboro, Oregon107,0504375,4399.4%18.0%20.5%10.2%23.6%18.4%90.6%42.0%
New Orleans, Louisiana376,035, 268,01210.9%21.3%20.7%5.2%22.5%19.4%89.1%42.0%
Colorado Springs, Colorado483,09979328,4665.4%19.2%23.0%10.6%25.2%16.7%94.6%41.9%
Denton, Texas146,9876890,2857.8%20.3%22.8%7.3%25.9%16.0%92.2%41.9%
Concord, North Carolina106,5184968,5008.7%21.8%18.3%9.4%25.3%16.5%91.3%41.7%
Irving, Texas255,03657164,74419.5%18.7%14.2%6.0%24.8%16.8%80.5%41.6%
Chico, California102,0325761,0736.8%16.1%24.8%11.1%26.9%14.4%93.2%41.3%
St. Petersburg, Florida260,64654198,8196.3%22.5%20.4%9.6%26.1%15.2%93.7%41.3%
Cincinnati, Ohio309,59563202,80010.3%24.1%17.0%7.3%23.2%18.0%89.7%41.3%
San Buenaventura (Ventura), California109,9006279,7458.8%17.0%22.7%10.4%25.3%15.8%91.2%41.1%
Murfreesboro, Tennessee157,5475396,7716.1%23.7%21.6%7.4%26.7%14.4%93.9%41.1%
New York, New York8,516,202, 6,090,65316.3%23.0%13.2%6.5%23.6%17.4%83.7%41.0%
Lincoln, Nebraska291,93271181,8377.0%20.4%20.3%11.4%26.4%14.5%93.0%41.0%
Urban Honolulu, Hawaii346,323116262,5619.1%22.8%17.2%10.1%25.2%15.5%90.9%40.8%
Lafayette, Louisiana121,5377583,5309.1%25.3%18.9%6.0%27.1%13.6%90.9%40.6%
Virginia Beach, Virginia457,066, 317,2255.3%21.3%22.4%10.5%25.0%15.4%94.7%40.4%
Omaha, Nebraska488,19768320,2679.5%21.3%21.3%7.7%25.6%14.7%90.5%40.3%
St. Louis, Missouri293,109, 212,9209.5%24.5%19.7%6.1%22.0%18.2%90.5%40.2%
Orange, California138,7236895,38111.9%17.9%22.3%7.9%25.9%14.1%88.1%40.1%
Grand Rapids, Michigan197,76888129,26811.0%21.7%20.0%7.3%26.3%13.7%89.0%40.1%
Metairie, Louisiana138,9953,016101,3378.2%24.2%20.6%7.1%24.8%15.0%91.8%39.9%
Greensboro, North Carolina298,564102190,9449.9%21.5%20.1%8.7%24.2%15.7%90.1%39.9%
Fort Lauderdale, Florida183,03256138,43210.2%24.7%17.2%8.1%23.8%16.0%89.8%39.8%
Coral Springs, Florida133,9626487,1365.7%23.8%19.9%10.9%24.6%15.1%94.3%39.7%
Lewisville, Texas128,31347086,99110.3%20.5%21.8%8.0%26.2%13.2%89.7%39.4%
Santa Clarita, California229,02197153,3688.7%18.6%23.3%10.1%26.5%12.8%91.3%39.3%
Temecula, California110,4046472,2116.6%18.1%25.7%10.4%25.7%13.5%93.4%39.2%
Davie, Florida106,4126272,0878.6%22.5%17.9%11.9%24.5%14.6%91.4%39.1%
Renton, Washington105,2797075,39910.3%20.4%20.2%10.1%25.4%13.6%89.7%39.0%
South Fulton, Georgia109,1575170,3037.0%23.7%19.7%10.8%24.2%14.7%93.0%38.9%
Albuquerque, New Mexico562,488118395,7549.1%21.6%21.2%9.5%20.9%17.8%90.9%38.7%
Columbus, Ohio906,480134602,49110.2%25.2%19.2%7.2%24.1%14.1%89.8%38.2%
Pembroke Pines, Florida170,55764123,9076.4%29.2%15.9%10.4%23.9%14.3%93.6%38.1%
Tuscaloosa, Alabama107,6994658,7848.7%25.4%20.1%7.7%21.3%16.8%91.3%38.1%
Elk Grove, California177,221134118,1919.2%17.6%25.1%10.2%25.4%12.6%90.8%38.0%
Daly City, California102,5605277,50711.5%21.9%21.0%7.7%29.2%8.8%88.5%38.0%
Peoria, Illinois112,12642973,2947.9%25.5%20.4%8.3%21.6%16.4%92.1%38.0%
Los Angeles, California3,857,897752,739,88920.7%18.5%16.6%6.3%24.5%13.3%79.3%37.8%
Kansas City, Missouri508,233121347,2668.2%25.0%21.6%7.4%23.8%14.0%91.8%37.8%
Concord, California124,2604289,17711.9%19.5%21.4%9.4%26.1%11.7%88.1%37.8%
New Haven, Connecticut132,8937684,44114.0%29.1%13.5%5.6%17.3%20.4%86.0%37.7%
Anchorage, Alaska289,069, 192,4956.0%24.5%23.2%8.6%23.4%14.3%94.0%37.7%
West Palm Beach, Florida119,50811786,98813.6%20.8%18.6%9.3%23.4%14.2%86.4%37.7%
Simi Valley, California125,7697790,0659.1%19.7%22.9%10.8%24.9%12.6%90.9%37.4%
Sioux Falls, South Dakota197,64266130,1726.9%24.3%20.1%11.2%25.4%12.0%93.1%37.4%
Dallas, Texas1,299,553141859,92919.2%21.5%16.7%5.1%22.9%14.5%80.8%37.4%
Las Cruces, New Mexico112,6128671,05311.9%19.5%21.6%9.7%20.2%17.1%88.1%37.3%
Rancho Cucamonga, California174,69383120,7438.0%20.5%23.1%11.2%22.8%14.5%92.0%37.3%
Aurora, Illinois179,867480114,16917.9%21.0%17.9%5.9%22.5%14.7%82.1%37.2%
Winston-Salem, North Carolina250,88768162,59511.6%23.7%19.5%7.9%21.6%15.6%88.4%37.2%
Billings, Montana118,3214381,3684.5%27.6%22.5%8.3%25.0%12.0%95.5%37.0%
Henderson, Nevada324,52351236,3386.1%23.4%24.6%9.1%23.2%13.6%93.9%36.8%
Clovis, California122,7196977,9137.9%19.9%24.3%11.2%22.9%13.9%92.1%36.7%
Chesapeake, Virginia251,153, 169,8716.6%24.1%22.9%10.0%22.4%14.0%93.4%36.4%
Sacramento, California524,802252363,00313.1%20.5%21.6%8.4%22.9%13.6%86.9%36.4%
Houston, Texas2,300,4191721,531,06519.7%21.5%16.6%6.2%21.3%14.6%80.3%36.0%
Baton Rouge, Louisiana223,69958134,46812.5%26.4%20.0%5.3%20.0%15.8%87.5%35.8%
Carolina, Puerto Rico139,0511,354104,21310.8%26.4%12.7%14.2%26.4%9.4%89.2%35.8%
Reno, Nevada268,959101188,20010.7%22.8%22.6%8.3%21.4%14.3%89.3%35.7%
Miami, Florida446,66377340,64720.0%25.2%11.6%7.5%21.5%14.1%80.0%35.6%
Peoria, Arizona194,338207137,1317.4%22.4%23.9%10.8%21.6%14.0%92.6%35.5%
Chattanooga, Tennessee182,83279126,30810.4%24.3%21.8%8.0%21.6%13.9%89.6%35.5%
Goodyear, Arizona102,8916272,2047.5%19.8%23.2%14.0%22.2%13.3%92.5%35.5%
Baltimore, Maryland577,193, 404,30012.8%27.9%18.4%5.5%18.1%17.3%87.2%35.4%
Enterprise, Nevada232,0435,278160,6977.8%23.7%22.9%10.4%24.2%11.0%92.2%35.2%
Yonkers, New York209,52981145,51016.3%25.3%15.8%7.4%19.6%15.6%83.7%35.2%
Springfield, Illinois113,71437679,8347.4%27.3%21.3%9.0%20.1%14.9%92.6%35.1%
Broken Arrow, Oklahoma115,9198577,7295.7%24.1%24.3%10.9%24.5%10.6%94.3%35.0%
Lubbock, Texas261,07849153,31410.8%24.2%22.5%7.5%20.8%14.1%89.2%34.9%
Long Beach, California458,49171320,74018.4%17.9%21.9%6.9%22.3%12.6%81.6%34.8%
Miramar, Florida135,9866395,6578.3%31.2%14.8%11.0%22.4%12.4%91.7%34.8%
Riverview, Florida107,7763,79472,6957.3%24.4%19.4%14.2%21.6%13.1%92.7%34.8%
Santa Rosa, California177,21654126,40514.5%19.2%21.9%9.7%21.3%13.4%85.5%34.8%
Providence, Rhode Island190,21461120,32218.1%27.5%14.8%4.9%18.3%16.4%81.9%34.7%
Philadelphia, Pennsylvania1,582,432, 1,088,96912.6%29.8%16.4%6.5%19.4%15.3%87.4%34.6%
Dearborn, Michigan107,8465766,04416.0%22.6%17.7%9.4%20.1%14.2%84.0%34.3%
Oceanside, California172,54276121,03613.5%18.8%24.5%8.8%22.1%12.2%86.5%34.3%
Indianapolis city (balance), Indiana882,043878577,58512.5%26.8%18.9%7.7%21.7%12.5%87.5%34.2%
Worcester, Massachusetts205,50174134,83614.3%27.9%16.0%7.7%20.1%14.0%85.7%34.1%
Oklahoma City, Oklahoma688,693148452,37912.2%24.5%21.3%8.0%21.5%12.5%87.8%34.0%
High Point, North Carolina115,2636375,95813.6%23.6%19.9%9.0%21.7%12.3%86.4%33.9%
Brandon, Florida116,3653,13782,8969.8%25.4%20.2%10.8%23.5%10.2%90.2%33.8%
Knoxville, Tennessee193,72180123,64410.2%27.1%20.4%8.6%20.5%13.2%89.8%33.7%
Midland, Texas133,9984783,58413.5%22.5%22.4%8.0%23.9%9.8%86.5%33.7%
Rio Rancho, New Mexico106,5337273,2425.6%23.3%25.3%12.3%20.7%12.9%94.4%33.6%
Montgomery, Alabama198,44040130,60611.3%26.3%21.3%7.6%19.4%14.1%88.7%33.5%
Tacoma, Washington220,48273157,6188.7%25.6%22.3%9.9%21.0%12.6%91.3%33.5%
Manchester, New Hampshire115,4156183,59911.3%29.1%18.1%8.0%22.5%10.9%88.7%33.5%
Louisville/Jefferson County metro government (balance), Kentucky627,210145430,1579.5%27.7%21.0%8.4%19.9%13.5%90.5%33.4%
Tulsa, Oklahoma412,322129271,75412.4%25.0%21.2%8.2%20.8%12.5%87.6%33.3%
Arlington, Texas394,769103250,72914.0%23.3%21.3%8.3%21.8%11.3%86.0%33.1%
Aurora, Colorado390,201117258,90213.4%23.3%20.9%9.4%21.4%11.5%86.6%32.9%
Cedar Rapids, Iowa136,8596092,9355.9%25.9%22.4%12.9%22.2%10.7%94.1%32.9%
Hollywood, Florida152,93560111,05710.7%26.6%20.0%10.0%19.8%12.9%89.3%32.7%
Norfolk, Virginia235,037, 151,85510.4%24.9%23.6%8.5%19.3%13.4%89.6%32.7%
Ponce, Puerto Rico109,7651,85879,75617.7%28.2%11.5%10.0%22.2%10.4%82.3%32.6%
Hayward, California159,20169113,99917.5%23.9%18.7%7.3%23.2%9.4%82.5%32.6%
Spokane, Washington229,22874161,1526.6%23.9%24.9%12.1%20.5%12.1%93.4%32.6%
Bayamón, Puerto Rico167,3121,545125,24614.8%22.8%17.7%12.1%24.2%8.4%85.2%32.6%
Richmond, California115,3965479,84420.8%19.8%19.6%7.1%20.2%12.4%79.2%32.5%
Clearwater, Florida117,0755889,1159.1%29.1%20.5%8.8%20.6%11.9%90.9%32.5%
Phoenix, Arizona1,624,8321121,072,38315.6%23.1%21.1%7.9%19.9%12.5%84.4%32.3%
Chula Vista, California275,03061184,43414.3%20.7%22.8%9.8%21.9%10.4%85.7%32.3%
Thornton, Colorado142,8787792,53312.1%26.3%20.9%8.4%22.3%9.9%87.9%32.2%
McAllen, Texas143,7895690,11520.1%20.7%20.6%6.5%20.3%11.7%79.9%32.0%
Savannah, Georgia147,5468597,19110.1%27.0%23.7%7.2%20.6%11.5%89.9%32.0%
Jacksonville, Florida961,73952657,6679.2%28.2%20.7%10.0%21.6%10.2%90.8%31.8%
Murrieta, California111,6216371,7546.8%21.0%29.8%10.6%20.6%11.3%93.2%31.8%
Fort Worth, Texas941,311527599,41115.7%24.7%20.5%7.4%20.6%11.1%84.3%31.7%
Vancouver, Washington192,696110134,2418.9%24.6%25.0%10.0%20.1%11.5%91.1%31.5%
Mobile, Alabama185,09752126,2349.4%29.7%21.0%8.5%20.0%11.5%90.6%31.5%
Mesa, Arizona507,47887345,8669.0%23.9%26.0%9.6%20.9%10.5%91.0%31.5%
Salem, Oregon176,66696118,10711.3%22.4%25.4%9.3%19.3%12.2%88.7%31.4%
Sterling Heights, Michigan133,4737396,07112.5%27.7%19.2%9.4%20.5%10.7%87.5%31.2%
Pompano Beach, Florida112,2128083,41814.7%27.0%20.3%6.8%20.0%11.2%85.3%31.1%
Spring Valley, Nevada219,9135,139161,08210.6%27.2%22.8%8.3%22.0%9.1%89.4%31.0%
Surprise, Arizona149,51964103,0465.7%25.2%26.7%11.3%19.9%11.1%94.3%31.0%
Corona, California158,83997105,59314.2%24.7%21.1%9.1%20.8%10.1%85.8%30.9%
Wichita, Kansas396,48882260,39112.0%26.0%23.0%8.1%19.7%11.2%88.0%30.9%
Tyler, Texas107,7186369,16312.1%22.0%24.7%10.5%20.4%10.3%87.9%30.7%
Birmingham, Alabama199,322646137,79011.3%28.2%21.4%8.4%18.4%12.3%88.7%30.7%
Clarksville, Tennessee171,89751105,7595.8%27.4%24.2%12.0%18.9%11.6%94.2%30.6%
Syracuse, New York146,2116590,15514.8%26.8%17.9%10.0%17.2%13.3%85.2%30.5%
Buffalo, New York276,39765183,79913.4%27.2%19.3%9.7%16.9%13.4%86.6%30.3%
Springfield, Missouri169,43292108,7017.9%28.7%25.4%7.7%18.7%11.6%92.1%30.3%
Tucson, Arizona543,34898353,60212.7%23.0%25.2%9.0%17.7%12.5%87.3%30.2%
Davenport, Iowa101,0833469,2187.4%28.8%22.1%11.7%18.9%11.1%92.6%30.0%
Rochester, New York209,720114139,42115.6%27.8%16.7%10.0%17.3%12.6%84.4%29.9%
Lowell, Massachusetts114,7994676,35716.7%30.8%15.0%7.6%18.0%11.9%83.3%29.9%
West Covina, California107,4367677,13014.6%26.3%20.0%9.3%21.4%8.5%85.4%29.8%
Columbus, Georgia204,383, 134,73211.0%26.8%22.8%9.6%17.6%12.2%89.0%29.7%
Lansing, Michigan112,5466674,50510.1%25.1%24.9%10.2%18.3%11.3%89.9%29.6%
South Bend, Indiana102,86661265,94612.3%29.7%20.0%8.5%16.9%12.5%87.7%29.4%
Kent, Washington135,0157390,49913.1%24.9%21.6%11.0%21.1%8.2%86.9%29.4%
Topeka, Kansas126,1034384,9568.2%31.9%22.9%7.9%18.5%10.6%91.8%29.1%
Newport News, Virginia184,774, 120,3648.2%29.8%22.6%10.3%17.7%11.4%91.8%29.1%
Grand Prairie, Texas198,56492124,38218.3%25.2%19.1%8.4%19.8%9.2%81.7%29.1%
Des Moines, Iowa212,464185140,84012.7%29.1%20.0%9.1%19.9%9.1%87.3%29.0%
Edinburg, Texas102,5615160,40419.3%23.2%22.7%6.0%19.5%9.4%80.7%28.9%
Everett, Washington111,0838078,94911.0%26.2%24.6%9.3%19.8%9.1%89.0%28.9%
Anaheim, California344,553138232,54622.5%21.7%19.4%7.7%19.5%9.3%77.5%28.8%
San Antonio, Texas1,458,954118954,36515.7%25.6%21.8%8.2%17.7%11.0%84.3%28.7%
West Jordan, Utah116,2777371,5168.8%26.7%24.3%11.6%20.1%8.5%91.2%28.6%
Waco, Texas141,92513781,07913.8%26.9%22.0%8.6%17.4%11.2%86.2%28.6%
Fayetteville, North Carolina209,69287129,8006.6%25.6%27.6%11.6%18.6%10.0%93.4%28.6%
Jackson, Mississippi149,8277096,52813.5%25.3%24.0%8.6%16.2%12.4%86.5%28.6%
Fort Wayne, Indiana266,235395173,98211.1%28.7%21.8%9.9%19.4%9.1%88.9%28.5%
Memphis, Tennessee629,06384412,05912.6%30.6%22.5%6.1%16.9%11.3%87.4%28.2%
North Charleston, South Carolina117,4608079,29513.3%26.6%22.0%10.1%18.2%9.8%86.7%28.0%
Vallejo, California124,6377088,70312.5%24.8%25.6%9.2%19.7%8.2%87.5%27.9%
Escondido, California149,91383102,89519.6%23.2%21.4%8.0%18.3%9.5%80.4%27.8%
Lakeland, Florida117,0306480,9379.4%31.8%21.4%9.7%17.7%9.9%90.6%27.7%
Vacaville, California102,0856371,4688.5%24.9%27.6%11.4%18.9%8.7%91.5%27.6%
Shreveport, Louisiana183,48360124,29812.7%30.4%22.8%6.6%15.5%12.0%87.3%27.5%
Hampton, Virginia137,334, 93,0557.3%29.2%25.5%10.5%17.1%10.4%92.7%27.5%
El Paso, Texas678,147153434,18318.1%24.4%21.3%8.8%18.3%9.2%81.9%27.5%
Las Vegas, Nevada650,873108449,18914.2%26.7%23.7%8.1%17.3%10.0%85.8%27.3%
Abilene, Texas127,13026278,63011.7%30.1%21.6%9.6%17.6%9.5%88.3%27.1%
Port St. Lucie, Florida220,45373159,1449.1%31.1%21.5%11.5%17.7%9.1%90.9%26.8%
Greeley, Colorado109,4216268,20916.8%25.5%21.9%9.0%15.9%10.8%83.2%26.7%
Fairfield, California119,9855079,66512.9%24.6%25.1%10.8%17.8%8.9%87.1%26.7%
Milwaukee, Wisconsin569,75649357,72614.5%30.8%20.9%7.3%17.2%9.4%85.5%26.6%
Sparks, Nevada109,1067574,13812.9%25.6%25.7%9.5%16.9%9.4%87.1%26.3%
Macon-Bibb County, Georgia156,543, 103,35512.6%31.2%22.2%8.1%12.9%13.1%87.4%26.0%
Elgin, Illinois114,10639974,03218.8%25.8%21.2%8.3%16.9%9.1%81.2%26.0%
Riverside, California316,241115198,88616.9%28.2%21.3%7.9%15.2%10.5%83.1%25.7%
Cape Coral, Florida206,38742158,2976.8%35.3%22.6%9.5%16.7%9.0%93.2%25.7%
Downey, California111,7936177,22018.7%25.2%21.8%8.7%17.8%7.8%81.3%25.6%
Green Bay, Wisconsin106,5859170,17811.0%31.4%20.4%11.7%18.4%7.1%89.0%25.5%
Beaumont, Texas113,7106373,51613.3%30.7%22.1%8.6%17.3%7.9%86.7%25.2%
Amarillo, Texas200,94543129,57114.1%26.6%24.7%9.4%17.0%8.1%85.9%25.1%
Joliet, Illinois149,78591495,53915.1%29.4%22.1%8.3%16.0%9.0%84.9%25.0%
Wichita Falls, Texas102,5583964,76813.3%30.5%23.3%7.9%16.1%8.9%86.7%25.0%
Garland, Texas245,298145156,68320.6%25.5%20.8%8.1%16.3%8.7%79.4%25.0%
Garden Grove, California170,60385119,05024.6%23.8%19.0%7.6%18.9%6.0%75.4%24.9%
Fresno, California543,615107337,58119.9%22.9%23.0%9.4%16.7%8.2%80.1%24.9%
Spokane Valley, Washington105,4607173,8795.4%29.2%27.2%13.4%16.7%8.0%94.6%24.8%
Corpus Christi, Texas317,38378209,28514.2%28.6%23.6%9.2%15.8%8.6%85.8%24.3%
Augusta-Richmond County consolidated government (balance), Georgia201,50420133,01212.1%31.8%22.2%9.7%14.7%9.5%87.9%24.2%
Inglewood, California105,5755773,50822.7%22.4%23.9%6.8%16.4%7.8%77.3%24.2%
San Tan Valley, Arizona105,2312,93267,0936.6%29.8%28.3%11.3%17.8%6.2%93.4%24.0%
Antioch, California115,75911078,97114.8%27.6%24.4%9.2%17.5%6.4%85.2%23.9%
Paradise, Nevada186,1784,601133,96214.5%30.7%23.0%7.9%16.0%7.9%85.5%23.9%
Nampa, Idaho106,2895268,42111.0%29.8%25.9%9.6%16.8%6.9%89.0%23.6%
Gresham, Oregon112,8185876,67612.8%26.7%26.5%10.4%15.2%8.3%87.2%23.6%
Glendale, Arizona250,19386160,78715.5%27.7%24.3%9.0%15.4%8.1%84.5%23.5%
Lynn, Massachusetts100,9058366,71021.6%31.4%15.2%8.5%15.5%7.8%78.4%23.3%
Akron, Ohio189,52676128,80511.3%33.3%23.8%8.4%15.3%8.0%88.7%23.3%
Bakersfield, California408,36697247,45018.1%25.7%24.4%8.5%15.1%8.2%81.9%23.3%
Rockford, Illinois147,64930098,60915.1%30.1%22.9%8.7%14.9%8.4%84.9%23.2%
Bridgeport, Connecticut148,01210099,09722.2%31.7%16.6%6.4%14.5%8.6%77.8%23.1%
Visalia, California142,6491,06590,06913.5%25.9%26.0%11.8%14.3%8.6%86.5%22.9%
Pueblo, Colorado111,5145176,42611.0%31.2%24.0%10.9%14.9%7.9%89.0%22.8%
Menifee, California107,0206372,71811.3%26.1%28.7%11.0%14.9%7.8%88.7%22.7%
Palm Bay, Florida125,27310488,6659.2%32.6%23.2%12.3%14.4%8.2%90.8%22.6%
Evansville, Indiana116,4413480,24410.7%34.4%22.1%10.5%15.2%7.1%89.3%22.3%
Brownsville, Texas188,02390110,43529.2%24.8%16.4%7.3%15.8%6.5%70.8%22.3%
El Cajon, California104,9099468,75115.6%28.9%24.0%9.3%15.3%6.9%84.4%22.2%
Killeen, Texas156,1446093,2497.6%27.5%31.5%11.3%16.2%5.9%92.4%22.0%
Laredo, Texas255,94941145,59229.5%22.1%19.3%7.6%15.1%6.4%70.5%21.5%
Norwalk, California100,7135968,39522.7%28.1%20.5%7.3%15.8%5.5%77.3%21.3%
Cleveland, Ohio367,52361254,40316.5%33.5%21.6%7.1%12.5%8.8%83.5%21.3%
Brockton, Massachusetts105,0805068,28818.2%34.1%18.8%7.6%14.6%6.7%81.8%21.3%
Hialeah, Florida221,90167166,76124.7%33.6%11.2%9.4%14.8%6.4%75.3%21.2%
Toledo, Ohio268,46164179,49012.0%33.0%24.0%10.0%13.7%7.2%88.0%21.0%
Independence, Missouri121,9447483,7269.8%37.2%23.6%8.5%13.7%7.2%90.2%20.9%
Ontario, California178,34766115,39522.1%26.6%22.1%8.5%15.1%5.6%77.9%20.7%
Dayton, Ohio136,7417087,30512.9%30.9%27.0%8.5%12.9%7.8%87.1%20.7%
Warren, Michigan138,1285697,24713.8%32.5%23.5%9.8%13.5%6.9%86.2%20.4%
Fontana, California211,92198132,00421.0%29.8%21.5%7.3%14.7%5.7%79.0%20.4%
Modesto, California218,61491143,33716.7%29.0%25.2%8.8%13.8%6.5%83.3%20.3%
Kansas City, Kansas154,7762697,95418.8%32.1%20.5%8.4%12.6%7.6%81.2%20.2%
Lancaster, California170,01362107,69218.0%29.6%23.8%8.6%12.7%7.4%82.0%20.1%
Spring Hill, Florida118,8142,31086,41710.3%32.3%25.8%11.9%13.5%6.2%89.7%19.7%
Springfield, Massachusetts154,7519197,79920.2%33.6%18.4%8.2%10.8%8.9%79.8%19.7%
Oxnard, California201,01462127,88530.8%25.4%16.8%7.3%13.4%6.3%69.2%19.6%
Pomona, California148,3915497,65425.8%26.6%20.8%7.2%13.7%5.8%74.2%19.5%
Allentown, Pennsylvania125,3205378,86818.8%37.6%17.2%6.9%13.9%5.5%81.2%19.4%
Stockton, California320,470131201,15522.9%28.1%21.0%8.9%13.0%6.1%77.1%19.1%
Mesquite, Texas148,84847393,02919.1%30.5%24.0%7.9%12.5%6.0%80.9%18.5%
Odessa, Texas114,0804969,15118.4%30.6%23.3%9.3%12.6%5.7%81.6%18.3%
Hartford, Connecticut119,9705375,84725.7%31.9%18.3%5.8%10.3%7.9%74.3%18.3%
North Las Vegas, Nevada270,77364174,83617.0%32.5%23.4%8.8%12.4%5.9%83.0%18.2%
Santa Ana, California311,63989204,02933.9%26.0%16.7%5.4%12.8%5.2%66.1%18.0%
Detroit, Michigan636,644159419,12116.6%33.2%25.4%7.2%10.5%7.1%83.4%17.6%
Miami Gardens, Florida111,26411175,37916.5%37.3%19.7%8.9%11.6%6.0%83.5%17.6%
Newark, New Jersey307,18849199,92622.8%37.4%16.9%5.5%12.2%5.2%77.2%17.4%
Moreno Valley, California210,37868130,73320.1%30.6%23.5%8.5%12.1%5.3%79.9%17.3%
Waterbury, Connecticut114,3563976,91019.6%36.9%18.7%7.8%9.8%7.2%80.4%17.0%
New Bedford, Massachusetts100,7316267,90923.9%34.4%16.1%8.8%11.7%5.1%76.1%16.8%
Palmdale, California165,48766101,71223.0%30.6%22.1%7.6%11.4%5.2%77.0%16.6%
Pasadena, Texas149,3455990,89727.4%30.7%18.8%7.0%10.7%5.4%72.6%16.1%
West Valley City, Utah137,9555580,13318.6%35.1%22.0%8.6%12.0%3.7%81.4%15.7%
Jurupa Valley, California106,2445467,98026.4%31.6%19.0%7.3%10.6%5.0%73.6%15.6%
Lehigh Acres, Florida127,3913,33980,26517.9%37.0%17.6%12.0%11.2%4.4%82.1%15.6%
Salinas, California161,99310996,92837.6%23.5%16.1%7.3%11.4%4.1%62.4%15.5%
Santa Maria, California109,8804861,60536.7%21.6%18.9%7.6%11.2%4.0%63.3%15.1%
El Monte, California107,06611373,08135.8%28.9%15.7%4.9%11.4%3.2%64.2%14.7%
Elizabeth, New Jersey135,8877988,02825.7%38.5%17.0%4.7%9.8%4.4%74.3%14.2%
San Bernardino, California221,77488136,64126.2%34.7%19.5%6.8%9.0%3.9%73.8%12.8%
Rialto, California103,8666064,31324.3%35.8%21.0%6.4%9.2%3.3%75.7%12.5%
Paterson, New Jersey157,66013798,65723.9%43.0%15.9%4.7%9.5%2.9%76.1%12.5%
Victorville, California135,9838081,11022.8%31.2%25.4%8.1%8.3%4.2%77.2%12.4%
Hesperia, California100,1414460,80522.6%33.2%23.3%8.6%8.2%4.1%77.4%12.3%
Sunrise Manor, Nevada199,0993,940125,21426.9%33.0%21.4%6.7%8.6%3.3%73.1%11.9%
East Los Angeles, California114,6173,05873,83945.0%24.4%15.8%4.2%7.6%3.0%55.0%10.6%

Image files

Download all

Figure 1

Bachelor's or higher, US cities
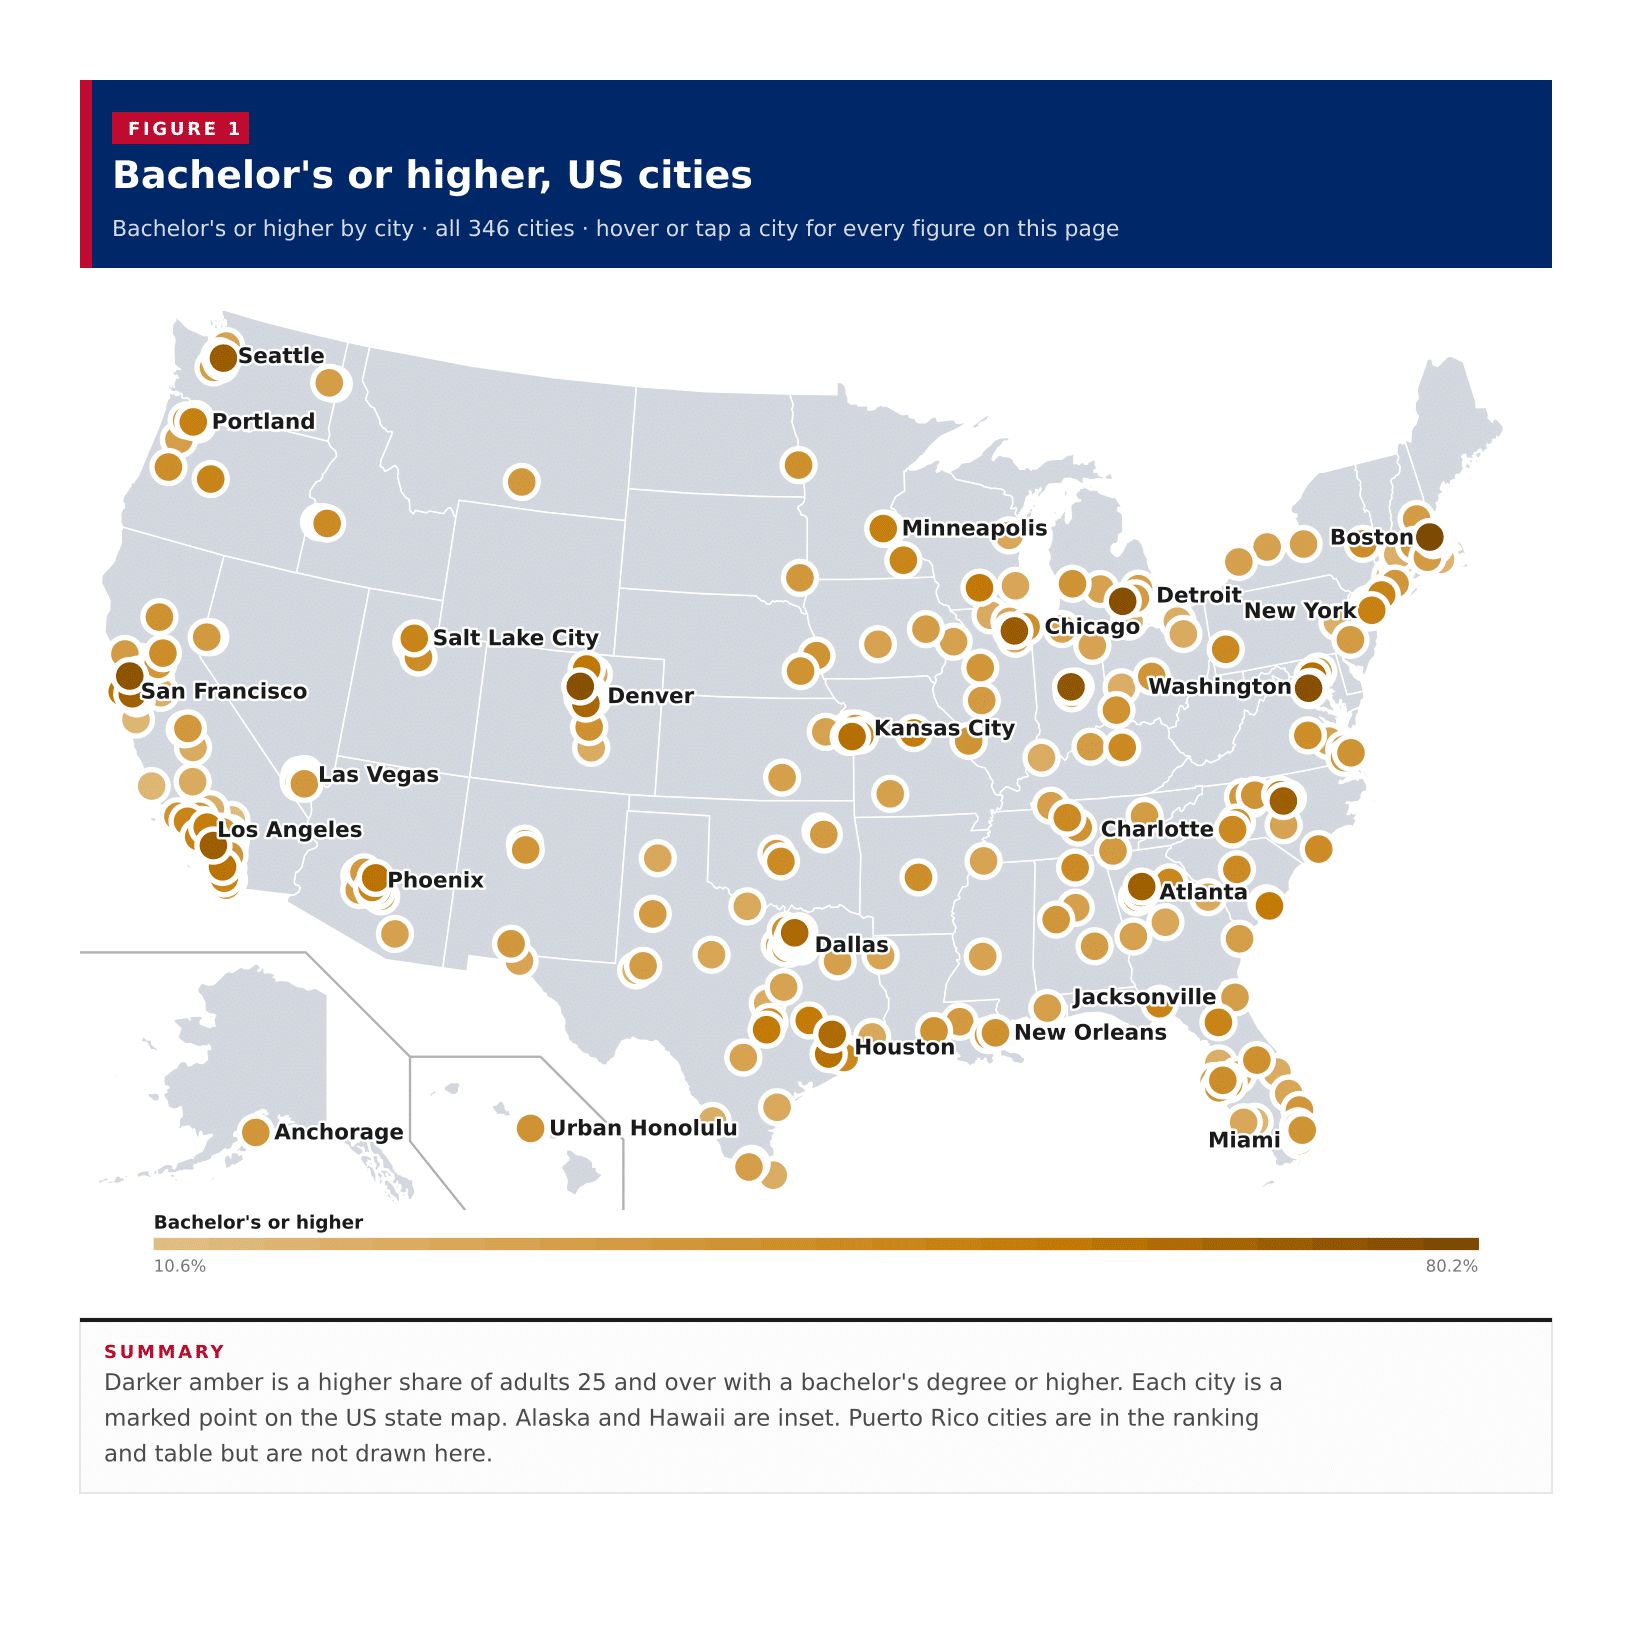
Figure 1: Bachelor's or higher, US cities
DownloadPDFImageCSV

Figure 2

Bachelor's or higher, all published cities

Figure 2: Bachelor's or higher, all published cities
DownloadPDFImageCSV

Figure 3

High school or higher, all published cities

Figure 3: High school or higher, all published cities
DownloadPDFImageCSV

Figure 4

Graduate or professional degree, all published cities

Figure 4: Graduate or professional degree, all published cities
DownloadPDFImageCSV

About this data

  • Educational attainment is the highest credential completed among people 25 years and over (ACS table B15003). A person with a master's degree is counted only there, not again as a bachelor's holder. Bachelor's or higher sums bachelor's, master's, professional and doctorate. High school or higher sums a regular diploma or GED through a doctorate.
  • A city is included when the ACS published at least 100,000 residents in the 2023 five-year estimates (table B01003). Smaller places are left out. The 100,000 cutoff uses total population, not the 25-and-over count.
  • A city share is that place's own ACS estimate. The midpoint of the 346 included cities is not a national figure, because cities differ in population.
  • The map covers the 48 contiguous states. Cities in Alaska, Hawaii and Puerto Rico stay in the ranking and table.
  • For 20 cities the ACS does not publish a population margin of error (code *****): the estimate is controlled to official counts, so a sampling error is not applicable. Those cells are shown as a dash, not as −555,555,555.



