SNAP participation by US state

Summary

SNAP participation rate, US states

SNAP participation rate by state · all 52 states · hover or tap a state for every figure on this page

52 items
View100%
DownloadPDFImageCSV
StatesNew Mexico
SNAP participation rate, US statesDarker amber is a higher share of households that received Food Stamps/SNAP in the past 12 months. Puerto Rico is listed in the ranking and table but is not on this map.Alabama · SNAP participation rate: 13.6% · Margin of error: 0.2% · Households receiving SNAP: 267,155 · Total households: 1,969,105 · SNAP rate, households with someone 60+: 11.0%Alaska · SNAP participation rate: 10.2% · Margin of error: 0.4% · Households receiving SNAP: 27,289 · Total households: 267,865 · SNAP rate, households with someone 60+: 9.7%Arizona · SNAP participation rate: 10.1% · Margin of error: 0.1% · Households receiving SNAP: 282,772 · Total households: 2,796,790 · SNAP rate, households with someone 60+: 8.6%Arkansas · SNAP participation rate: 10.5% · Margin of error: 0.2% · Households receiving SNAP: 124,380 · Total households: 1,189,160 · SNAP rate, households with someone 60+: 8.3%California · SNAP participation rate: 11.4% · Margin of error: 0.1% · Households receiving SNAP: 1,526,052 · Total households: 13,434,847 · SNAP rate, households with someone 60+: 11.5%Colorado · SNAP participation rate: 8.0% · Margin of error: 0.1% · Households receiving SNAP: 186,848 · Total households: 2,325,576 · SNAP rate, households with someone 60+: 8.2%Connecticut · SNAP participation rate: 11.7% · Margin of error: 0.2% · Households receiving SNAP: 165,735 · Total households: 1,420,170 · SNAP rate, households with someone 60+: 11.5%Delaware · SNAP participation rate: 10.9% · Margin of error: 0.4% · Households receiving SNAP: 43,021 · Total households: 396,209 · SNAP rate, households with someone 60+: 9.5%Florida · SNAP participation rate: 12.6% · Margin of error: 0.1% · Households receiving SNAP: 1,078,978 · Total households: 8,550,911 · SNAP rate, households with someone 60+: 12.3%Georgia · SNAP participation rate: 12.3% · Margin of error: 0.2% · Households receiving SNAP: 491,615 · Total households: 4,008,013 · SNAP rate, households with someone 60+: 12.1%Hawaii · SNAP participation rate: 11.2% · Margin of error: 0.4% · Households receiving SNAP: 54,955 · Total households: 488,991 · SNAP rate, households with someone 60+: 11.3%Idaho · SNAP participation rate: 7.8% · Margin of error: 0.3% · Households receiving SNAP: 54,328 · Total households: 693,821 · SNAP rate, households with someone 60+: 6.5%Illinois · SNAP participation rate: 13.5% · Margin of error: 0.1% · Households receiving SNAP: 673,465 · Total households: 5,001,904 · SNAP rate, households with someone 60+: 12.5%Indiana · SNAP participation rate: 9.0% · Margin of error: 0.2% · Households receiving SNAP: 241,196 · Total households: 2,681,537 · SNAP rate, households with someone 60+: 7.0%Iowa · SNAP participation rate: 9.2% · Margin of error: 0.2% · Households receiving SNAP: 119,631 · Total households: 1,303,763 · SNAP rate, households with someone 60+: 7.0%Kansas · SNAP participation rate: 7.0% · Margin of error: 0.2% · Households receiving SNAP: 80,799 · Total households: 1,160,715 · SNAP rate, households with someone 60+: 5.5%Kentucky · SNAP participation rate: 12.7% · Margin of error: 0.2% · Households receiving SNAP: 226,825 · Total households: 1,791,991 · SNAP rate, households with someone 60+: 9.9%Louisiana · SNAP participation rate: 16.6% · Margin of error: 0.2% · Households receiving SNAP: 296,885 · Total households: 1,783,168 · SNAP rate, households with someone 60+: 13.5%Maine · SNAP participation rate: 11.8% · Margin of error: 0.3% · Households receiving SNAP: 69,623 · Total households: 589,085 · SNAP rate, households with someone 60+: 10.7%Maryland · SNAP participation rate: 11.0% · Margin of error: 0.2% · Households receiving SNAP: 257,146 · Total households: 2,339,510 · SNAP rate, households with someone 60+: 10.7%Massachusetts · SNAP participation rate: 13.8% · Margin of error: 0.2% · Households receiving SNAP: 382,480 · Total households: 2,762,070 · SNAP rate, households with someone 60+: 14.2%Michigan · SNAP participation rate: 13.1% · Margin of error: 0.1% · Households receiving SNAP: 528,080 · Total households: 4,040,168 · SNAP rate, households with someone 60+: 11.0%Minnesota · SNAP participation rate: 7.6% · Margin of error: 0.1% · Households receiving SNAP: 173,507 · Total households: 2,282,967 · SNAP rate, households with someone 60+: 6.8%Mississippi · SNAP participation rate: 13.6% · Margin of error: 0.3% · Households receiving SNAP: 154,243 · Total households: 1,131,760 · SNAP rate, households with someone 60+: 11.2%Missouri · SNAP participation rate: 9.9% · Margin of error: 0.2% · Households receiving SNAP: 246,339 · Total households: 2,484,834 · SNAP rate, households with someone 60+: 8.1%Montana · SNAP participation rate: 8.3% · Margin of error: 0.3% · Households receiving SNAP: 37,655 · Total households: 452,683 · SNAP rate, households with someone 60+: 7.0%Nebraska · SNAP participation rate: 8.0% · Margin of error: 0.2% · Households receiving SNAP: 62,927 · Total households: 786,885 · SNAP rate, households with someone 60+: 6.7%Nevada · SNAP participation rate: 12.4% · Margin of error: 0.3% · Households receiving SNAP: 146,183 · Total households: 1,183,393 · SNAP rate, households with someone 60+: 11.1%New Hampshire · SNAP participation rate: 6.0% · Margin of error: 0.3% · Households receiving SNAP: 32,826 · Total households: 551,186 · SNAP rate, households with someone 60+: 5.1%New Jersey · SNAP participation rate: 8.8% · Margin of error: 0.1% · Households receiving SNAP: 305,880 · Total households: 3,478,355 · SNAP rate, households with someone 60+: 8.9%New Mexico · SNAP participation rate: 18.7% · Margin of error: 0.4% · Households receiving SNAP: 153,928 · Total households: 825,021 · SNAP rate, households with someone 60+: 14.5%New York · SNAP participation rate: 15.0% · Margin of error: 0.1% · Households receiving SNAP: 1,152,804 · Total households: 7,668,956 · SNAP rate, households with someone 60+: 16.7%North Carolina · SNAP participation rate: 12.5% · Margin of error: 0.1% · Households receiving SNAP: 524,968 · Total households: 4,186,924 · SNAP rate, households with someone 60+: 11.3%North Dakota · SNAP participation rate: 6.4% · Margin of error: 0.4% · Households receiving SNAP: 20,776 · Total households: 325,079 · SNAP rate, households with someone 60+: 5.5%Ohio · SNAP participation rate: 12.4% · Margin of error: 0.1% · Households receiving SNAP: 598,938 · Total households: 4,829,571 · SNAP rate, households with someone 60+: 10.8%Oklahoma · SNAP participation rate: 13.6% · Margin of error: 0.2% · Households receiving SNAP: 209,740 · Total households: 1,542,780 · SNAP rate, households with someone 60+: 10.5%Oregon · SNAP participation rate: 15.4% · Margin of error: 0.3% · Households receiving SNAP: 261,284 · Total households: 1,701,548 · SNAP rate, households with someone 60+: 14.3%Pennsylvania · SNAP participation rate: 14.0% · Margin of error: 0.1% · Households receiving SNAP: 734,855 · Total households: 5,235,339 · SNAP rate, households with someone 60+: 13.1%Rhode Island · SNAP participation rate: 14.0% · Margin of error: 0.5% · Households receiving SNAP: 61,152 · Total households: 436,902 · SNAP rate, households with someone 60+: 14.7%South Carolina · SNAP participation rate: 10.5% · Margin of error: 0.2% · Households receiving SNAP: 217,015 · Total households: 2,070,390 · SNAP rate, households with someone 60+: 9.1%South Dakota · SNAP participation rate: 8.1% · Margin of error: 0.4% · Households receiving SNAP: 28,955 · Total households: 358,552 · SNAP rate, households with someone 60+: 6.6%Tennessee · SNAP participation rate: 11.2% · Margin of error: 0.2% · Households receiving SNAP: 310,084 · Total households: 2,768,743 · SNAP rate, households with someone 60+: 9.6%Texas · SNAP participation rate: 11.4% · Margin of error: 0.1% · Households receiving SNAP: 1,227,194 · Total households: 10,747,240 · SNAP rate, households with someone 60+: 10.7%Utah · SNAP participation rate: 5.3% · Margin of error: 0.2% · Households receiving SNAP: 58,154 · Total households: 1,094,896 · SNAP rate, households with someone 60+: 5.2%Vermont · SNAP participation rate: 10.5% · Margin of error: 0.4% · Households receiving SNAP: 28,256 · Total households: 269,466 · SNAP rate, households with someone 60+: 10.1%Virginia · SNAP participation rate: 8.8% · Margin of error: 0.1% · Households receiving SNAP: 293,101 · Total households: 3,326,260 · SNAP rate, households with someone 60+: 8.1%Washington · SNAP participation rate: 11.4% · Margin of error: 0.2% · Households receiving SNAP: 343,448 · Total households: 3,020,558 · SNAP rate, households with someone 60+: 11.3%West Virginia · SNAP participation rate: 17.2% · Margin of error: 0.4% · Households receiving SNAP: 123,756 · Total households: 721,448 · SNAP rate, households with someone 60+: 13.8%Wisconsin · SNAP participation rate: 10.8% · Margin of error: 0.2% · Households receiving SNAP: 263,244 · Total households: 2,446,028 · SNAP rate, households with someone 60+: 9.1%Wyoming · SNAP participation rate: 5.0% · Margin of error: 0.3% · Households receiving SNAP: 11,890 · Total households: 238,176 · SNAP rate, households with someone 60+: 3.7%District of Columbia · SNAP participation rate: 13.2% · Margin of error: 0.5% · Households receiving SNAP: 42,590 · Total households: 321,556 · SNAP rate, households with someone 60+: 17.0%District of Columbia · SNAP participation rate: 13.2% · Margin of error: 0.5% · Households receiving SNAP: 42,590 · Total households: 321,556 · SNAP rate, households with someone 60+: 17.0%SNAP participation rate5.0%18.7%
Summary

Darker amber is a higher share of households that received Food Stamps/SNAP in the past 12 months. Puerto Rico is listed in the ranking and table but is not on this map.

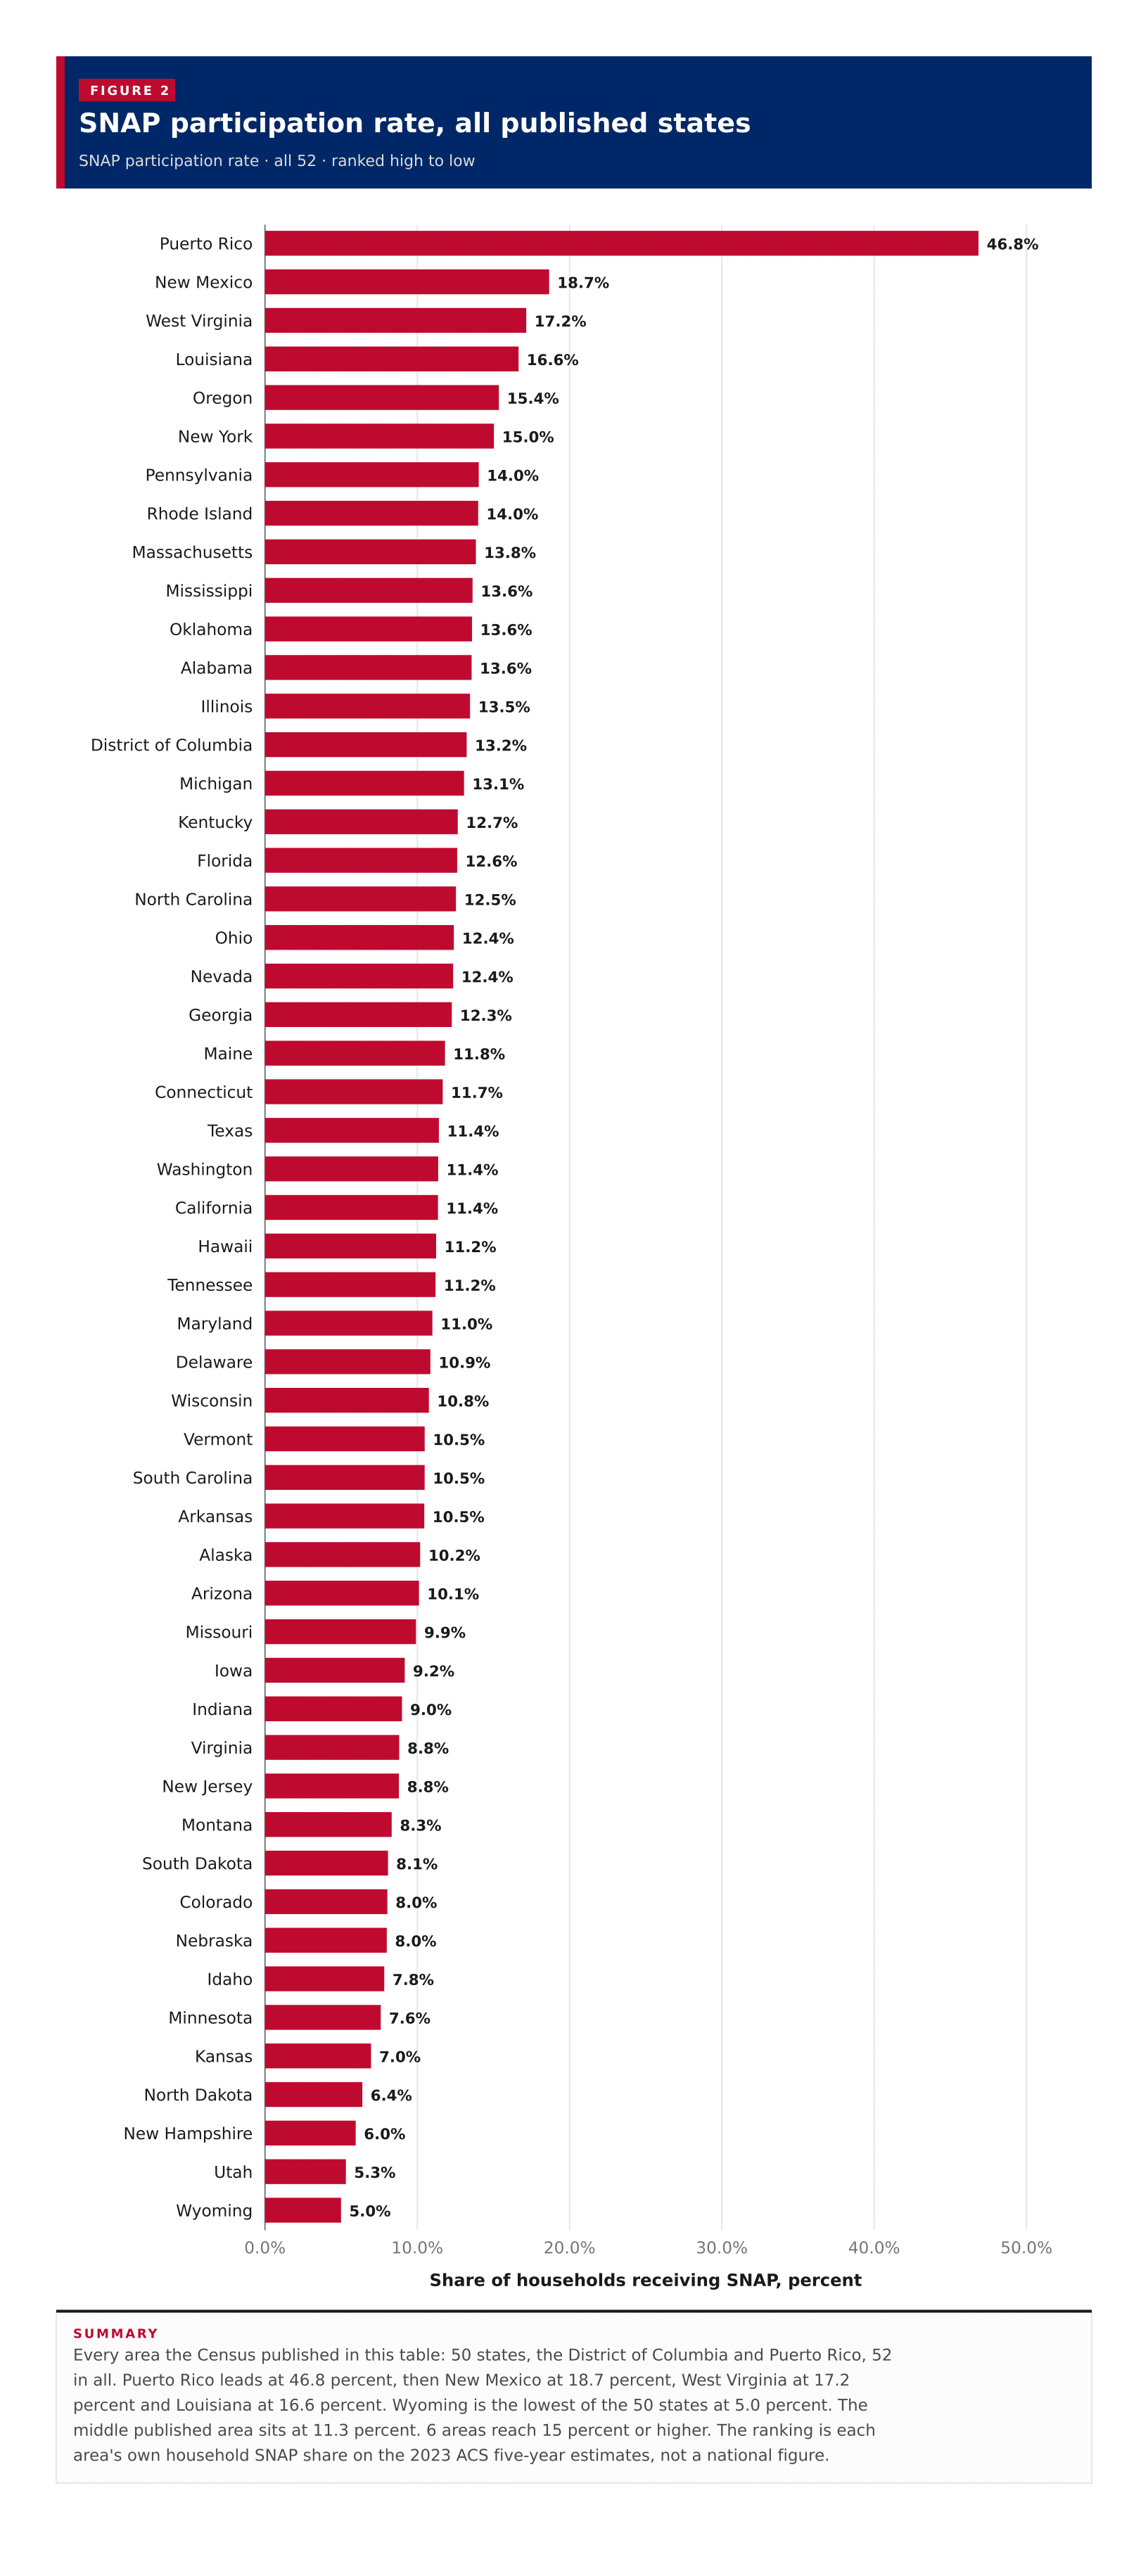
A typical published area has a SNAP participation rate of 11.3 percent, the midpoint of the 50 states, the District of Columbia and Puerto Rico on the 2023 ACS five-year estimates. New Mexico has the highest share among the 50 states at 18.7 percent, followed by West Virginia at 17.2 percent and Louisiana at 16.6 percent. Wyoming is the lowest at 5.0 percent. Puerto Rico, which this table also returns, sits far higher at 46.8 percent. New Mexico is 13.7 percentage points above Wyoming, and Puerto Rico is 41.9 points above Wyoming. These are each area's own share of households that received Food Stamps/SNAP in the past 12 months, not a national average of states and not a United States SNAP rate.

In short

11.3%typical published areamidpoint of 52 areas, not a US SNAP rate
46.8%Puerto Ricohighest figure the Census published
18.7%New Mexicohighest of the 50 states
5.0%Wyominglowest SNAP participation rate
6areas at or above 15%Puerto Rico, New Mexico, West Virginia, Louisiana, Oregon, New York
Figure 1

SNAP participation rate, all published states

SNAP participation rate · all 52 · ranked high to low

52 items
View100%
DownloadPDFImageCSV
SNAP participation rate, all published statesEvery area the Census published in this table: 50 states, the District of Columbia and Puerto Rico, 52 in all. Puerto Rico leads at 46.8 percent, then New Mexico at 18.7 percent, West Virginia at 17.2 percent and Louisiana at 16.6 percent. Wyoming is the lowest of the 50 states at 5.0 percent. The middle published area sits at 11.3 percent. 6 areas reach 15 percent or higher. The ranking is each area's own household SNAP share on the 2023 ACS five-year estimates, not a national figure.0.0%10.0%20.0%30.0%40.0%50.0%Share of households receiving SNAP, percent46.8%Puerto Rico18.7%New Mexico17.2%West Virginia16.6%Louisiana15.4%Oregon15.0%New York14.0%Pennsylvania14.0%Rhode Island13.8%Massachusetts13.6%Mississippi13.6%Oklahoma13.6%Alabama13.5%Illinois13.2%District of Columbia13.1%Michigan12.7%Kentucky12.6%Florida12.5%North Carolina12.4%Ohio12.4%Nevada12.3%Georgia11.8%Maine11.7%Connecticut11.4%Texas11.4%Washington11.4%California11.2%Hawaii11.2%Tennessee11.0%Maryland10.9%Delaware10.8%Wisconsin10.5%Vermont10.5%South Carolina10.5%Arkansas10.2%Alaska10.1%Arizona9.9%Missouri9.2%Iowa9.0%Indiana8.8%Virginia8.8%New Jersey8.3%Montana8.1%South Dakota8.0%Colorado8.0%Nebraska7.8%Idaho7.6%Minnesota7.0%Kansas6.4%North Dakota6.0%New Hampshire5.3%Utah5.0%Wyoming
Summary

Every area the Census published in this table: 50 states, the District of Columbia and Puerto Rico, 52 in all. Puerto Rico leads at 46.8 percent, then New Mexico at 18.7 percent, West Virginia at 17.2 percent and Louisiana at 16.6 percent. Wyoming is the lowest of the 50 states at 5.0 percent. The middle published area sits at 11.3 percent. 6 areas reach 15 percent or higher. The ranking is each area's own household SNAP share on the 2023 ACS five-year estimates, not a national figure.

Figure 2

SNAP rate among households with someone 60+, all published states

SNAP rate, households with someone 60+ · all 52 · ranked high to low

52 items
View100%
DownloadPDFImageCSV
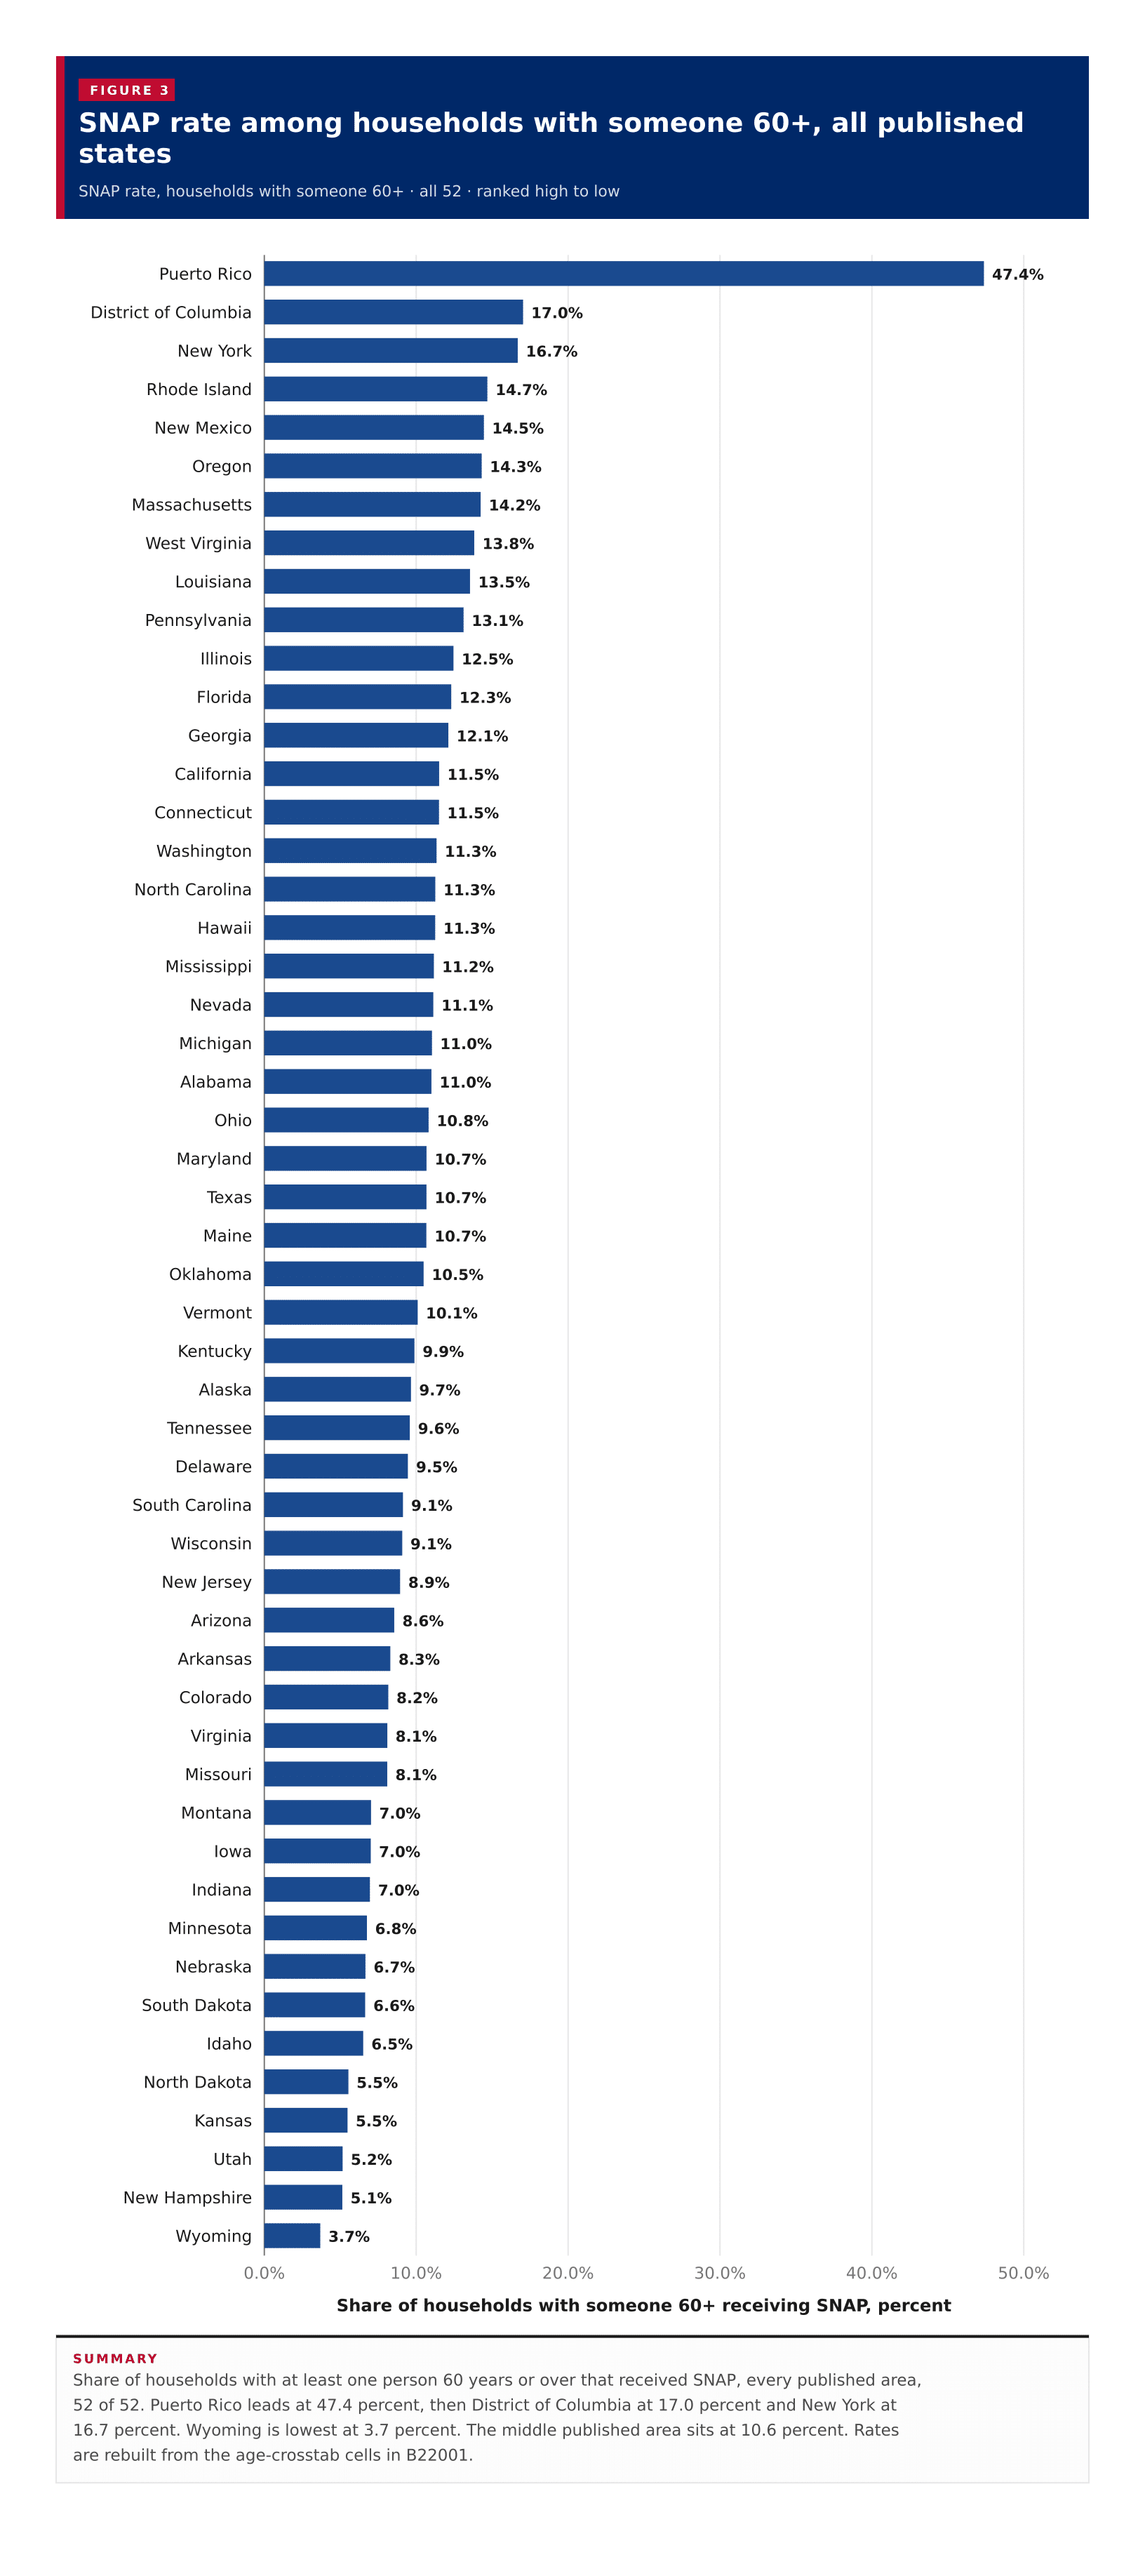
SNAP rate among households with someone 60+, all published statesShare of households with at least one person 60 years or over that received SNAP, every published area, 52 of 52. Puerto Rico leads at 47.4 percent, then District of Columbia at 17.0 percent and New York at 16.7 percent. Wyoming is lowest at 3.7 percent. The middle published area sits at 10.6 percent. Rates are rebuilt from the age-crosstab cells in B22001.0.0%10.0%20.0%30.0%40.0%50.0%Share of households with someone 60+ receiving SNAP, percent47.4%Puerto Rico17.0%District of Columbia16.7%New York14.7%Rhode Island14.5%New Mexico14.3%Oregon14.2%Massachusetts13.8%West Virginia13.5%Louisiana13.1%Pennsylvania12.5%Illinois12.3%Florida12.1%Georgia11.5%California11.5%Connecticut11.3%Washington11.3%North Carolina11.3%Hawaii11.2%Mississippi11.1%Nevada11.0%Michigan11.0%Alabama10.8%Ohio10.7%Maryland10.7%Texas10.7%Maine10.5%Oklahoma10.1%Vermont9.9%Kentucky9.7%Alaska9.6%Tennessee9.5%Delaware9.1%South Carolina9.1%Wisconsin8.9%New Jersey8.6%Arizona8.3%Arkansas8.2%Colorado8.1%Virginia8.1%Missouri7.0%Montana7.0%Iowa7.0%Indiana6.8%Minnesota6.7%Nebraska6.6%South Dakota6.5%Idaho5.5%North Dakota5.5%Kansas5.2%Utah5.1%New Hampshire3.7%Wyoming
Summary

Share of households with at least one person 60 years or over that received SNAP, every published area, 52 of 52. Puerto Rico leads at 47.4 percent, then District of Columbia at 17.0 percent and New York at 16.7 percent. Wyoming is lowest at 3.7 percent. The middle published area sits at 10.6 percent. Rates are rebuilt from the age-crosstab cells in B22001.

Table 1

All states

52 rows · 6 columns

52 rows
View100%
DownloadPDFImageCSV
Summary

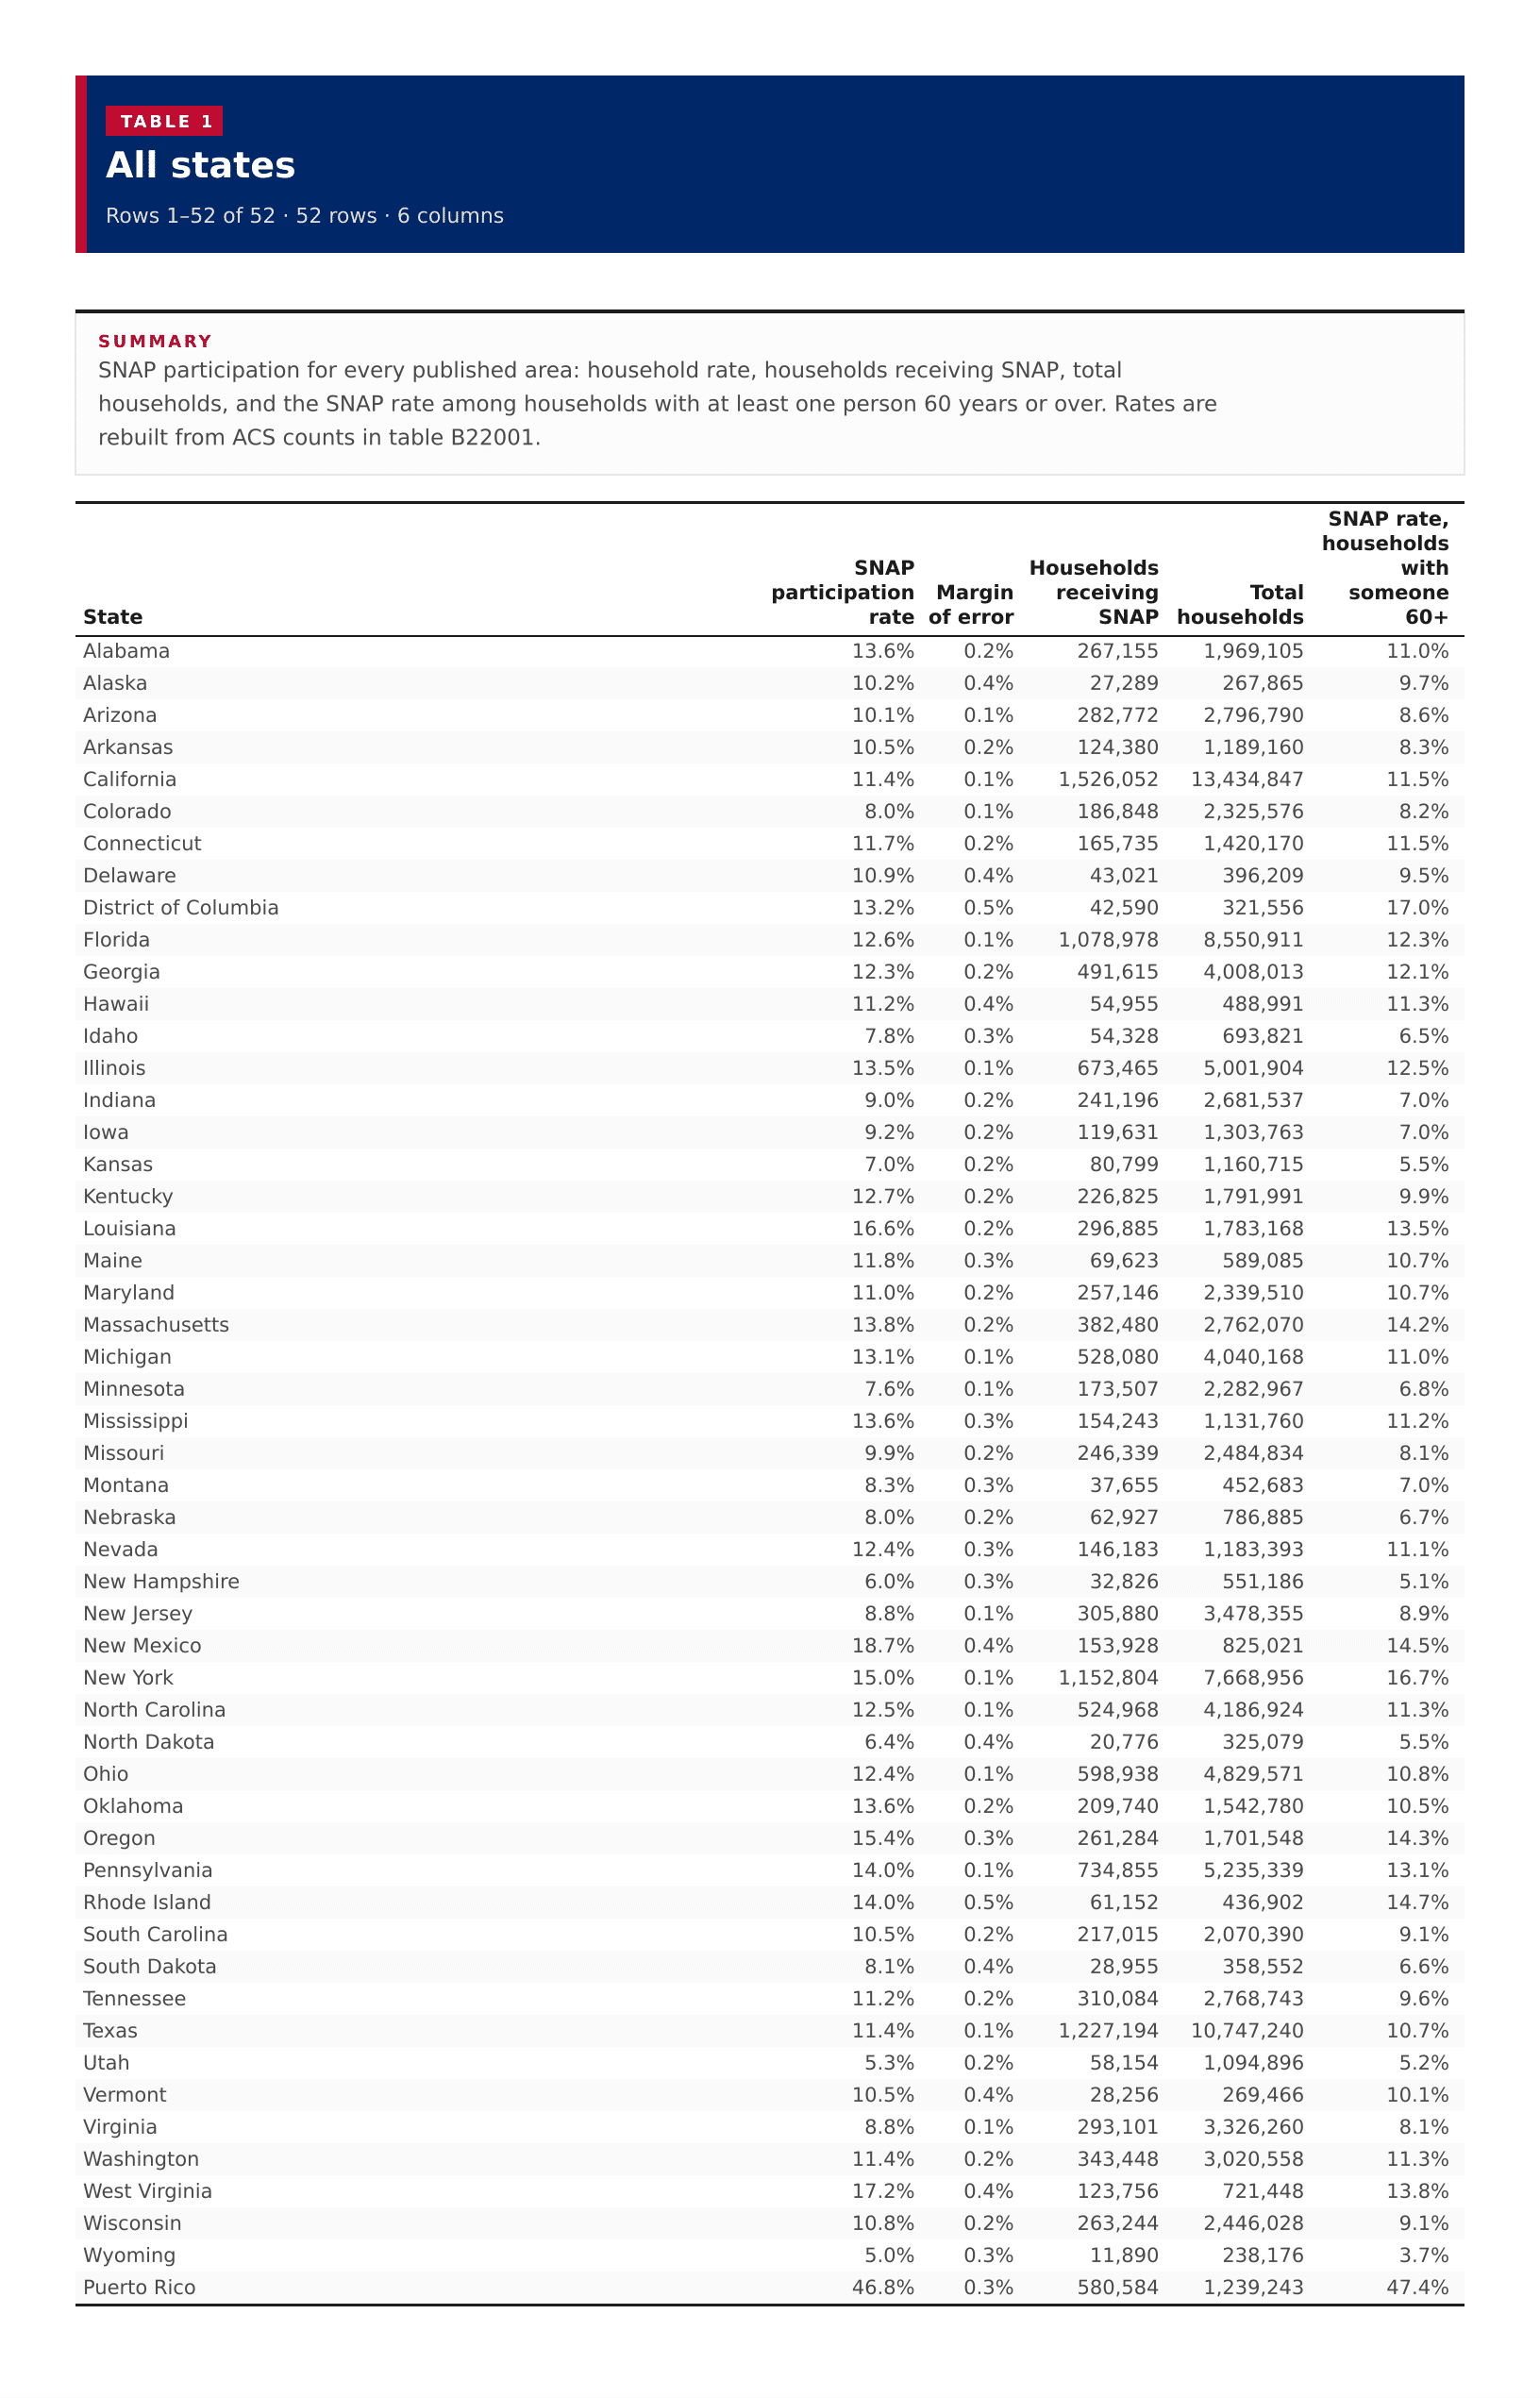
SNAP participation for every published area: household rate, households receiving SNAP, total households, and the SNAP rate among households with at least one person 60 years or over. Rates are rebuilt from ACS counts in table B22001.

All states
?????
Alabama13.6%0.2%267,1551,969,10511.0%
Alaska10.2%0.4%27,289267,8659.7%
Arizona10.1%0.1%282,7722,796,7908.6%
Arkansas10.5%0.2%124,3801,189,1608.3%
California11.4%0.1%1,526,05213,434,84711.5%
Colorado8.0%0.1%186,8482,325,5768.2%
Connecticut11.7%0.2%165,7351,420,17011.5%
Delaware10.9%0.4%43,021396,2099.5%
District of Columbia13.2%0.5%42,590321,55617.0%
Florida12.6%0.1%1,078,9788,550,91112.3%
Georgia12.3%0.2%491,6154,008,01312.1%
Hawaii11.2%0.4%54,955488,99111.3%
Idaho7.8%0.3%54,328693,8216.5%
Illinois13.5%0.1%673,4655,001,90412.5%
Indiana9.0%0.2%241,1962,681,5377.0%
Iowa9.2%0.2%119,6311,303,7637.0%
Kansas7.0%0.2%80,7991,160,7155.5%
Kentucky12.7%0.2%226,8251,791,9919.9%
Louisiana16.6%0.2%296,8851,783,16813.5%
Maine11.8%0.3%69,623589,08510.7%
Maryland11.0%0.2%257,1462,339,51010.7%
Massachusetts13.8%0.2%382,4802,762,07014.2%
Michigan13.1%0.1%528,0804,040,16811.0%
Minnesota7.6%0.1%173,5072,282,9676.8%
Mississippi13.6%0.3%154,2431,131,76011.2%
Missouri9.9%0.2%246,3392,484,8348.1%
Montana8.3%0.3%37,655452,6837.0%
Nebraska8.0%0.2%62,927786,8856.7%
Nevada12.4%0.3%146,1831,183,39311.1%
New Hampshire6.0%0.3%32,826551,1865.1%
New Jersey8.8%0.1%305,8803,478,3558.9%
New Mexico18.7%0.4%153,928825,02114.5%
New York15.0%0.1%1,152,8047,668,95616.7%
North Carolina12.5%0.1%524,9684,186,92411.3%
North Dakota6.4%0.4%20,776325,0795.5%
Ohio12.4%0.1%598,9384,829,57110.8%
Oklahoma13.6%0.2%209,7401,542,78010.5%
Oregon15.4%0.3%261,2841,701,54814.3%
Pennsylvania14.0%0.1%734,8555,235,33913.1%
Rhode Island14.0%0.5%61,152436,90214.7%
South Carolina10.5%0.2%217,0152,070,3909.1%
South Dakota8.1%0.4%28,955358,5526.6%
Tennessee11.2%0.2%310,0842,768,7439.6%
Texas11.4%0.1%1,227,19410,747,24010.7%
Utah5.3%0.2%58,1541,094,8965.2%
Vermont10.5%0.4%28,256269,46610.1%
Virginia8.8%0.1%293,1013,326,2608.1%
Washington11.4%0.2%343,4483,020,55811.3%
West Virginia17.2%0.4%123,756721,44813.8%
Wisconsin10.8%0.2%263,2442,446,0289.1%
Wyoming5.0%0.3%11,890238,1763.7%
Puerto Rico46.8%0.3%580,5841,239,24347.4%

Image files

Download all

Figure 1

SNAP participation rate, US states
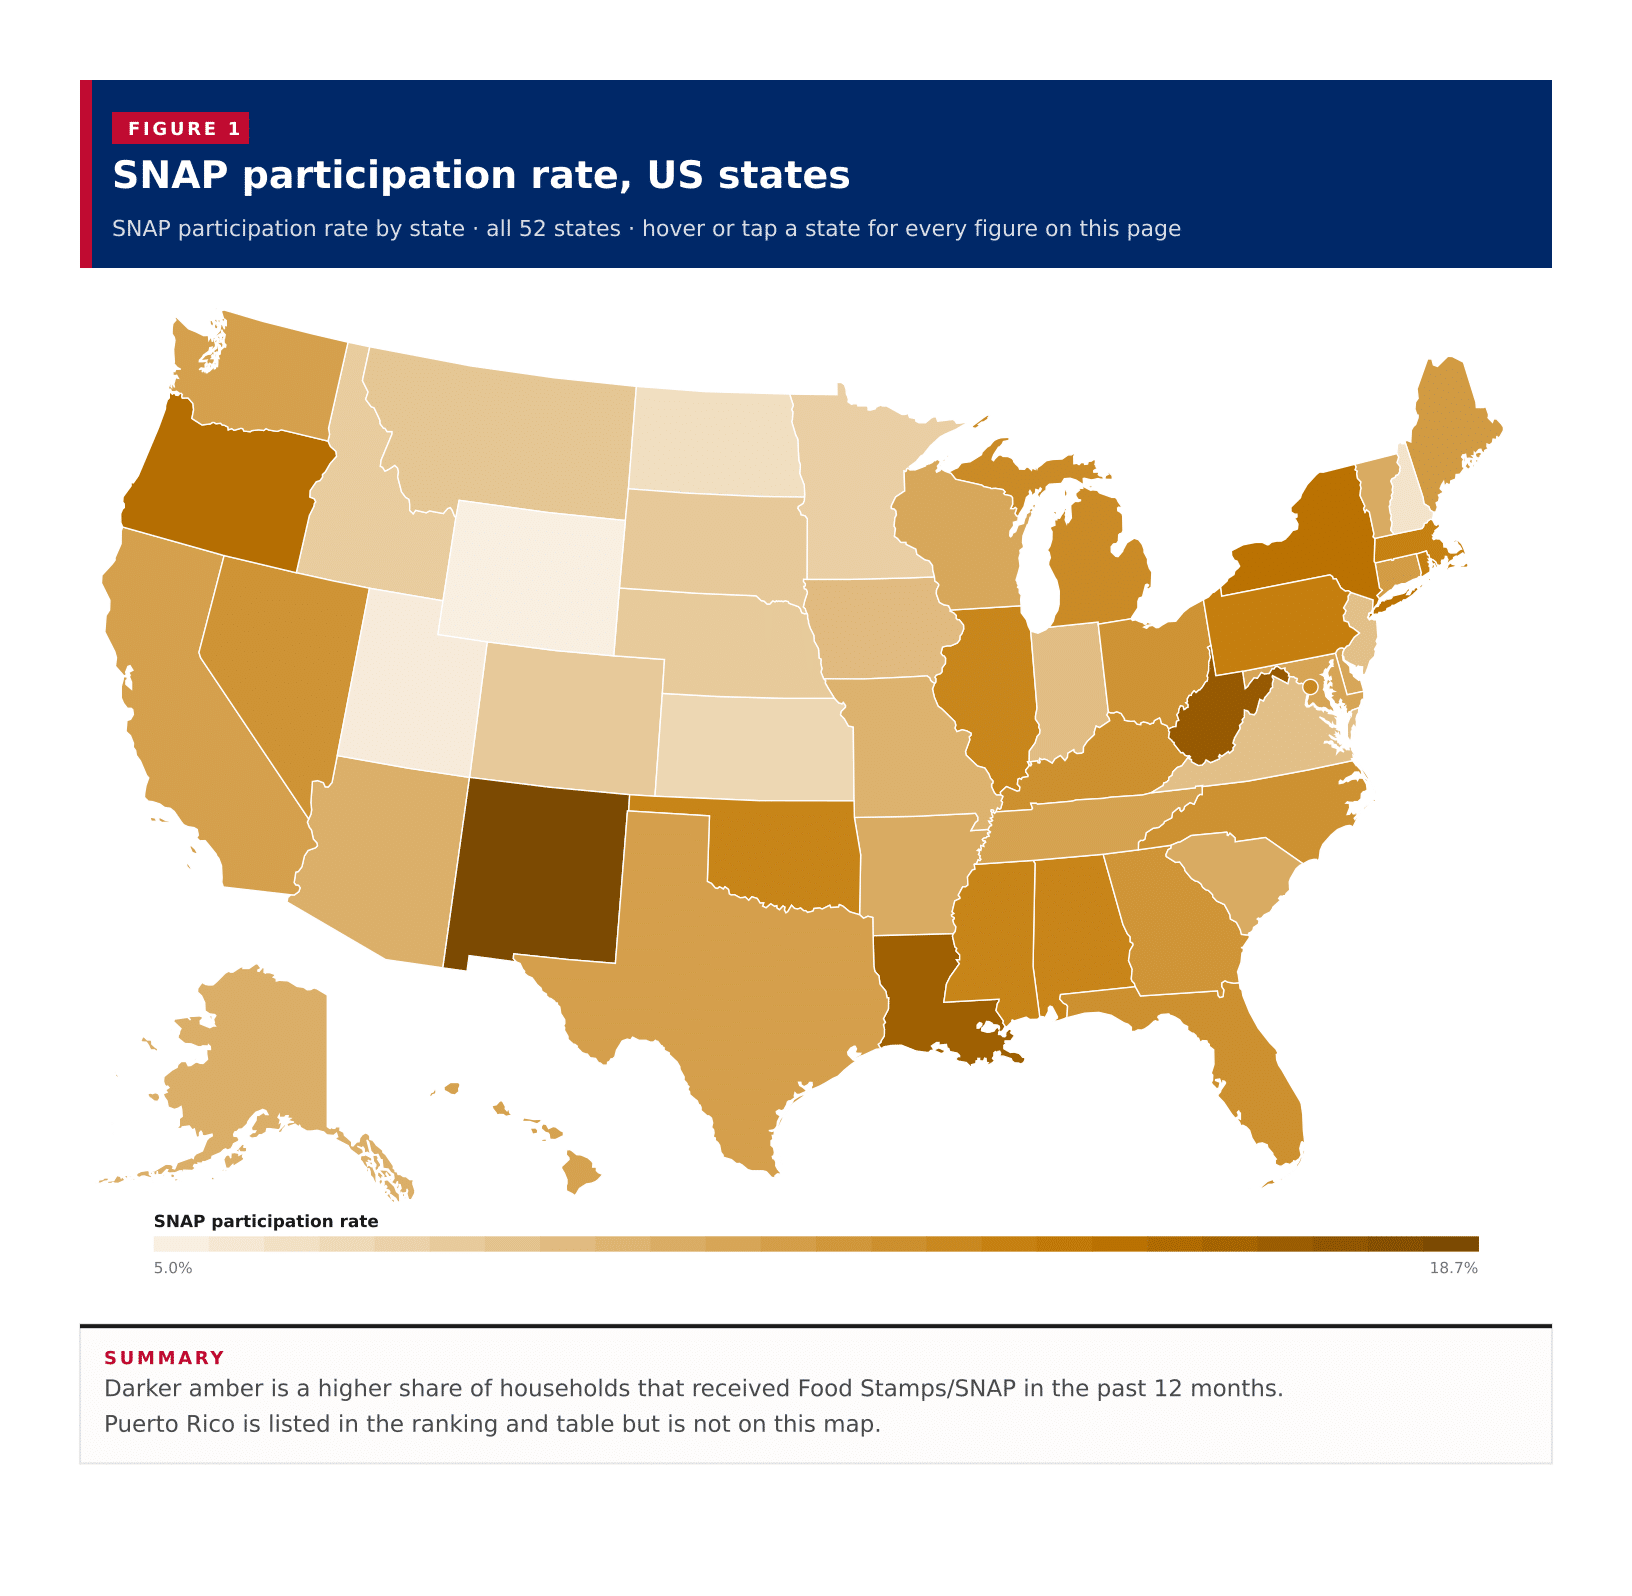
Figure 1: SNAP participation rate, US states
DownloadPDFImageCSV

Figure 2

SNAP participation rate, all published states

Figure 2: SNAP participation rate, all published states
DownloadPDFImageCSV

Figure 3

SNAP rate among households with someone 60+, all published states

Figure 3: SNAP rate among households with someone 60+, all published states
DownloadPDFImageCSV

About this data

  • SNAP participation is the share of households that received Food Stamps/SNAP benefits in the past 12 months. The denominator is households, not people.
  • A state SNAP rate is that state's own household share, so these figures cannot be averaged to produce a national figure. The midpoint of the 52 published areas is not a United States SNAP rate.
  • Rates are recomputed from the component counts in ACS table B22001 (households receiving SNAP divided by total households). The 60-and-over rate uses households with at least one person 60 years or over from the same table.
  • The Census published 50 states, the District of Columbia and Puerto Rico. None of the household counts were suppressed.
  • Alaska and Hawaii appear in the ranking and table. On the map they are drawn as insets. Puerto Rico is in the ranking and table but is not on the state map.