Remote work by US state

Summary

Worked from home, US states

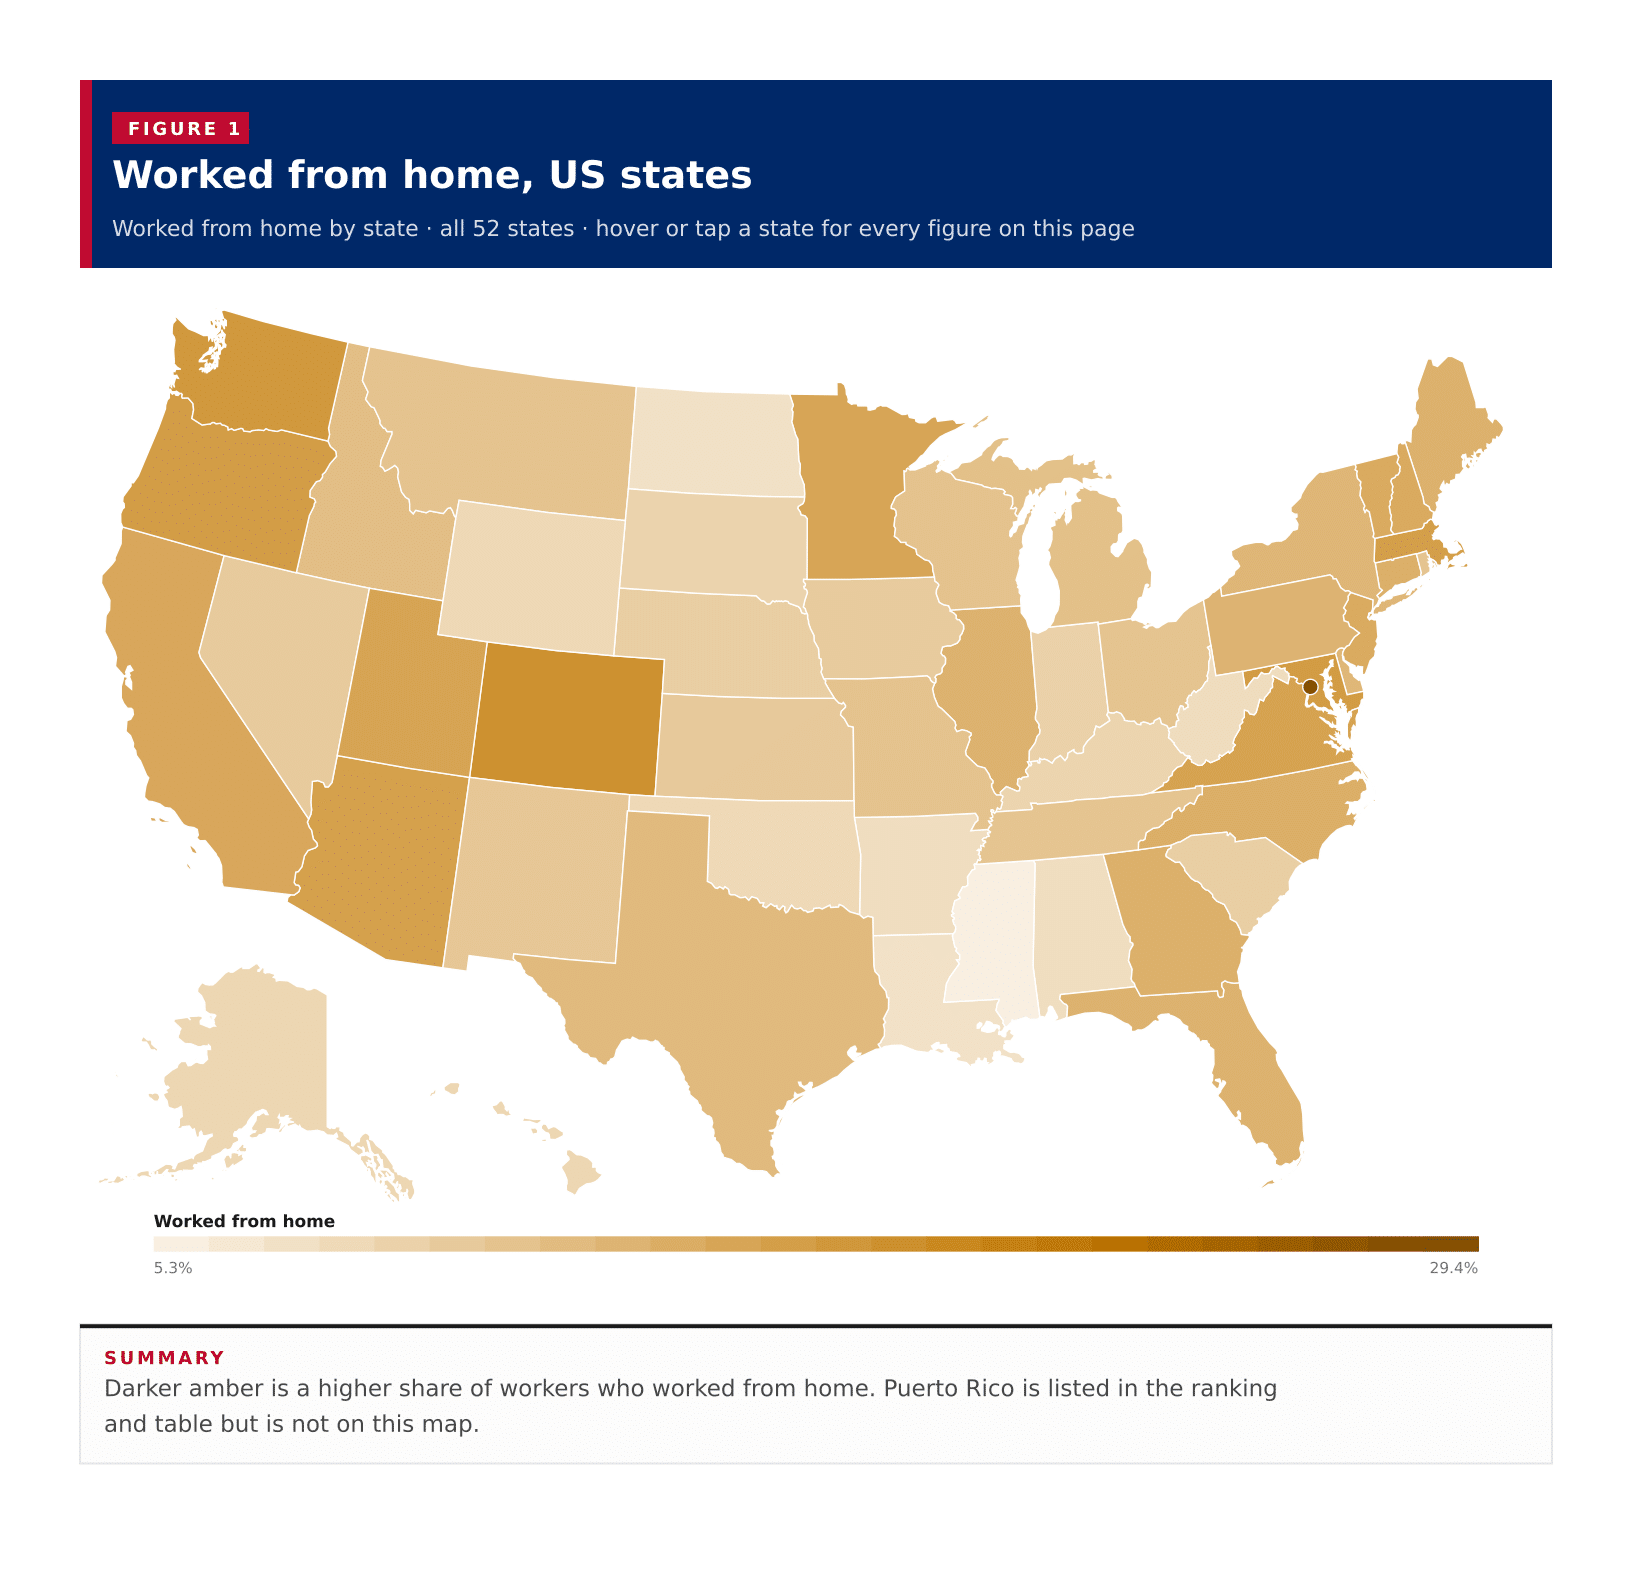
Worked from home by state · all 52 states · hover or tap a state for every figure on this page

52 items
View100%
DownloadPDFImageCSV
StatesDistrict of Columbia
Worked from home, US statesDarker amber is a higher share of workers who worked from home. Puerto Rico is listed in the ranking and table but is not on this map.Alabama · Worked from home: 7.8% · Margin of error: 0.2% · Workers from home: 171,143 · Workers: 2,202,219Alaska · Worked from home: 8.8% · Margin of error: 0.5% · Workers from home: 30,903 · Workers: 351,270Arizona · Worked from home: 16.5% · Margin of error: 0.2% · Workers from home: 546,481 · Workers: 3,306,501Arkansas · Worked from home: 7.8% · Margin of error: 0.2% · Workers from home: 102,122 · Workers: 1,313,067California · Worked from home: 15.5% · Margin of error: 0.1% · Workers from home: 2,832,962 · Workers: 18,331,098Colorado · Worked from home: 18.8% · Margin of error: 0.2% · Workers from home: 571,667 · Workers: 3,040,109Connecticut · Worked from home: 14.4% · Margin of error: 0.2% · Workers from home: 258,466 · Workers: 1,800,904Delaware · Worked from home: 13.3% · Margin of error: 0.5% · Workers from home: 63,317 · Workers: 476,276Florida · Worked from home: 13.9% · Margin of error: 0.1% · Workers from home: 1,406,025 · Workers: 10,084,671Georgia · Worked from home: 14.2% · Margin of error: 0.2% · Workers from home: 722,138 · Workers: 5,071,788Hawaii · Worked from home: 8.8% · Margin of error: 0.3% · Workers from home: 61,271 · Workers: 697,455Idaho · Worked from home: 12.2% · Margin of error: 0.3% · Workers from home: 108,150 · Workers: 885,092Illinois · Worked from home: 14.0% · Margin of error: 0.1% · Workers from home: 860,338 · Workers: 6,144,838Indiana · Worked from home: 9.6% · Margin of error: 0.2% · Workers from home: 309,882 · Workers: 3,240,266Iowa · Worked from home: 10.4% · Margin of error: 0.2% · Workers from home: 166,940 · Workers: 1,601,329Kansas · Worked from home: 10.7% · Margin of error: 0.2% · Workers from home: 154,506 · Workers: 1,448,523Kentucky · Worked from home: 9.1% · Margin of error: 0.2% · Workers from home: 182,100 · Workers: 2,002,703Louisiana · Worked from home: 7.2% · Margin of error: 0.2% · Workers from home: 143,919 · Workers: 1,989,634Maine · Worked from home: 14.1% · Margin of error: 0.4% · Workers from home: 95,335 · Workers: 674,654Maryland · Worked from home: 17.2% · Margin of error: 0.2% · Workers from home: 532,724 · Workers: 3,104,587Massachusetts · Worked from home: 16.7% · Margin of error: 0.2% · Workers from home: 604,422 · Workers: 3,609,524Michigan · Worked from home: 12.0% · Margin of error: 0.1% · Workers from home: 552,302 · Workers: 4,616,510Minnesota · Worked from home: 15.8% · Margin of error: 0.2% · Workers from home: 465,176 · Workers: 2,935,254Mississippi · Worked from home: 5.3% · Margin of error: 0.2% · Workers from home: 65,344 · Workers: 1,236,023Missouri · Worked from home: 11.6% · Margin of error: 0.2% · Workers from home: 340,575 · Workers: 2,938,053Montana · Worked from home: 11.6% · Margin of error: 0.4% · Workers from home: 61,565 · Workers: 532,519Nebraska · Worked from home: 10.0% · Margin of error: 0.3% · Workers from home: 100,900 · Workers: 1,008,387Nevada · Worked from home: 10.5% · Margin of error: 0.2% · Workers from home: 152,480 · Workers: 1,453,257New Hampshire · Worked from home: 15.1% · Margin of error: 0.4% · Workers from home: 110,362 · Workers: 731,095New Jersey · Worked from home: 15.0% · Margin of error: 0.2% · Workers from home: 683,255 · Workers: 4,541,915New Mexico · Worked from home: 11.0% · Margin of error: 0.4% · Workers from home: 100,080 · Workers: 910,663New York · Worked from home: 13.3% · Margin of error: 0.1% · Workers from home: 1,246,469 · Workers: 9,350,213North Carolina · Worked from home: 14.5% · Margin of error: 0.1% · Workers from home: 722,489 · Workers: 4,991,806North Dakota · Worked from home: 7.3% · Margin of error: 0.4% · Workers from home: 29,689 · Workers: 404,739Ohio · Worked from home: 11.5% · Margin of error: 0.1% · Workers from home: 640,644 · Workers: 5,591,912Oklahoma · Worked from home: 8.5% · Margin of error: 0.2% · Workers from home: 152,208 · Workers: 1,800,553Oregon · Worked from home: 17.0% · Margin of error: 0.3% · Workers from home: 343,010 · Workers: 2,012,012Pennsylvania · Worked from home: 13.8% · Margin of error: 0.1% · Workers from home: 853,137 · Workers: 6,195,018Rhode Island · Worked from home: 11.4% · Margin of error: 0.5% · Workers from home: 62,202 · Workers: 543,710South Carolina · Worked from home: 10.0% · Margin of error: 0.2% · Workers from home: 237,424 · Workers: 2,381,241South Dakota · Worked from home: 9.3% · Margin of error: 0.3% · Workers from home: 42,038 · Workers: 453,223Tennessee · Worked from home: 11.4% · Margin of error: 0.2% · Workers from home: 370,383 · Workers: 3,255,576Texas · Worked from home: 12.8% · Margin of error: 0.1% · Workers from home: 1,796,441 · Workers: 13,992,594Utah · Worked from home: 16.0% · Margin of error: 0.2% · Workers from home: 263,991 · Workers: 1,650,868Vermont · Worked from home: 15.0% · Margin of error: 0.4% · Workers from home: 49,705 · Workers: 330,599Virginia · Worked from home: 16.2% · Margin of error: 0.2% · Workers from home: 699,959 · Workers: 4,308,387Washington · Worked from home: 17.7% · Margin of error: 0.2% · Workers from home: 664,230 · Workers: 3,750,832West Virginia · Worked from home: 8.0% · Margin of error: 0.3% · Workers from home: 58,070 · Workers: 728,505Wisconsin · Worked from home: 11.6% · Margin of error: 0.1% · Workers from home: 345,659 · Workers: 2,971,525Wyoming · Worked from home: 8.5% · Margin of error: 0.5% · Workers from home: 24,153 · Workers: 282,769District of Columbia · Worked from home: 29.4% · Margin of error: 0.8% · Workers from home: 108,622 · Workers: 368,917District of Columbia · Worked from home: 29.4% · Margin of error: 0.8% · Workers from home: 108,622 · Workers: 368,917Worked from home5.3%29.4%
Summary

Darker amber is a higher share of workers who worked from home. Puerto Rico is listed in the ranking and table but is not on this map.

A typical published area has 11.8 percent of workers who worked from home, the midpoint of the 50 states, the District of Columbia and Puerto Rico on the 2023 ACS five-year estimates. The District of Columbia leads at 29.4 percent. Colorado is the highest of the 50 states at 18.8 percent, followed by Washington at 17.7 percent and Maryland at 17.2 percent. Mississippi is the lowest at 5.3 percent. These are each area's own share of workers, not a national remote-work rate.
In short

11.8%typical published areathe middle area, not an average
29.4%District of Columbiahighest share who worked from home
18.8%Coloradohighest of the 50 states
5.3%Mississippilowest figure the Census published
14areas at or above 15%District of Columbia, Colorado, Washington, Maryland and 10 more
Figure 1

Worked from home, all published states

Worked from home · all 52 · ranked high to low

52 items
View100%
DownloadPDFImageCSV
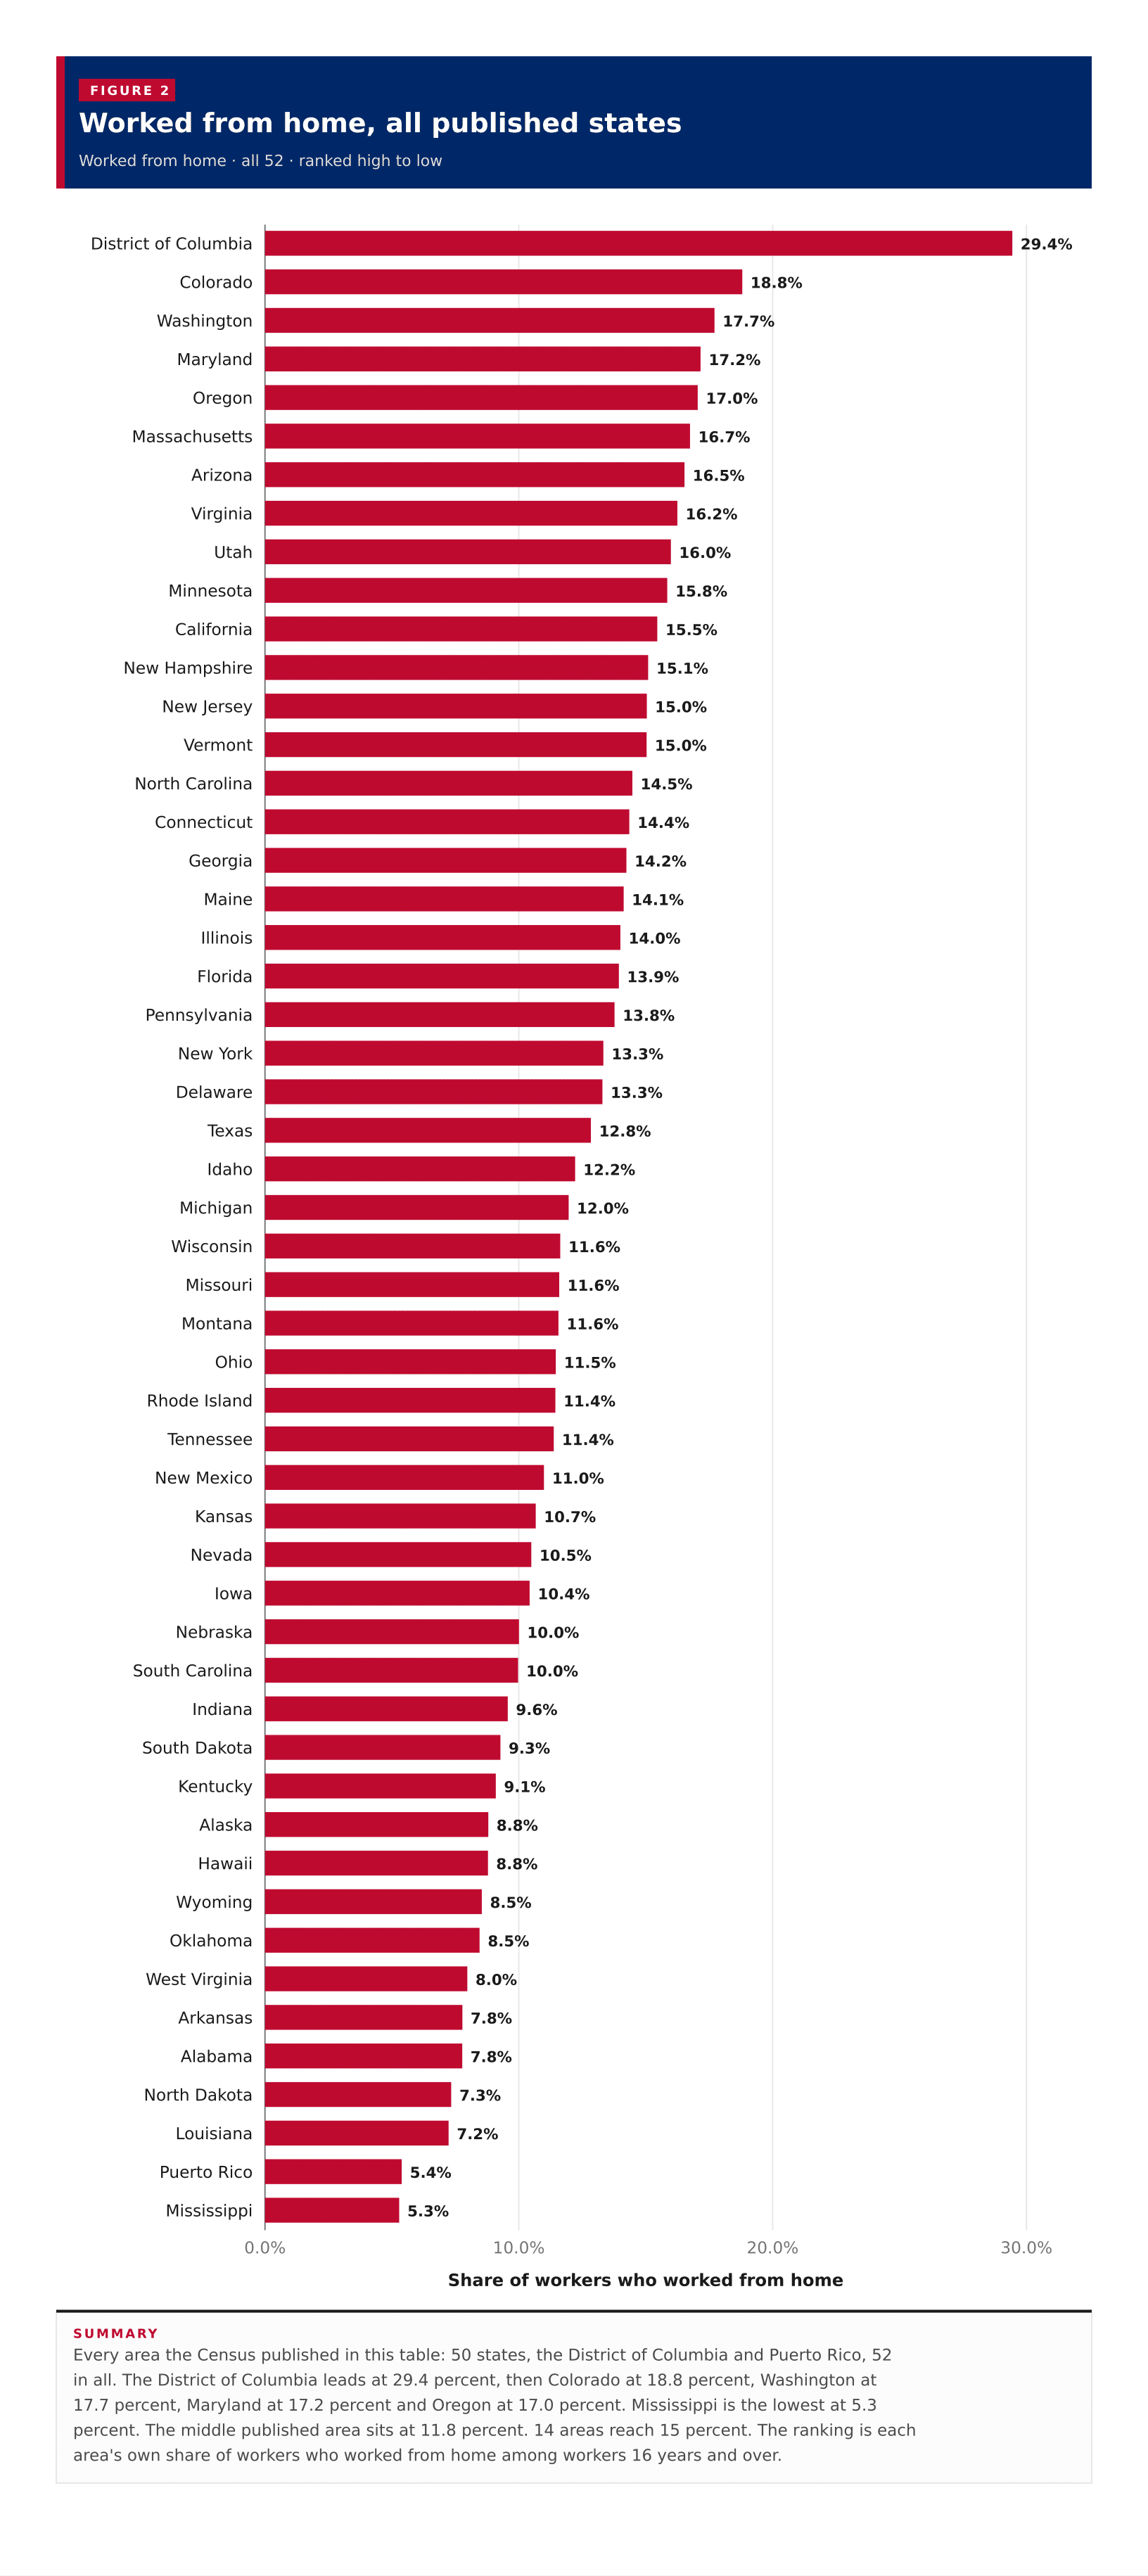
Worked from home, all published statesEvery area the Census published in this table: 50 states, the District of Columbia and Puerto Rico, 52 in all. The District of Columbia leads at 29.4 percent, then Colorado at 18.8 percent, Washington at 17.7 percent, Maryland at 17.2 percent and Oregon at 17.0 percent. Mississippi is the lowest at 5.3 percent. The middle published area sits at 11.8 percent. 14 areas reach 15 percent. The ranking is each area's own share of workers who worked from home among workers 16 years and over.0.0%10.0%20.0%30.0%Share of workers who worked from home29.4%District of Columbia18.8%Colorado17.7%Washington17.2%Maryland17.0%Oregon16.7%Massachusetts16.5%Arizona16.2%Virginia16.0%Utah15.8%Minnesota15.5%California15.1%New Hampshire15.0%New Jersey15.0%Vermont14.5%North Carolina14.4%Connecticut14.2%Georgia14.1%Maine14.0%Illinois13.9%Florida13.8%Pennsylvania13.3%New York13.3%Delaware12.8%Texas12.2%Idaho12.0%Michigan11.6%Wisconsin11.6%Missouri11.6%Montana11.5%Ohio11.4%Rhode Island11.4%Tennessee11.0%New Mexico10.7%Kansas10.5%Nevada10.4%Iowa10.0%Nebraska10.0%South Carolina9.6%Indiana9.3%South Dakota9.1%Kentucky8.8%Alaska8.8%Hawaii8.5%Wyoming8.5%Oklahoma8.0%West Virginia7.8%Arkansas7.8%Alabama7.3%North Dakota7.2%Louisiana5.4%Puerto Rico5.3%Mississippi
Summary

Every area the Census published in this table: 50 states, the District of Columbia and Puerto Rico, 52 in all. The District of Columbia leads at 29.4 percent, then Colorado at 18.8 percent, Washington at 17.7 percent, Maryland at 17.2 percent and Oregon at 17.0 percent. Mississippi is the lowest at 5.3 percent. The middle published area sits at 11.8 percent. 14 areas reach 15 percent. The ranking is each area's own share of workers who worked from home among workers 16 years and over.

Table 1

All states

52 rows · 5 columns · sorted by worked from home, high to low

52 rows
View100%
DownloadPDFImageCSV
Summary

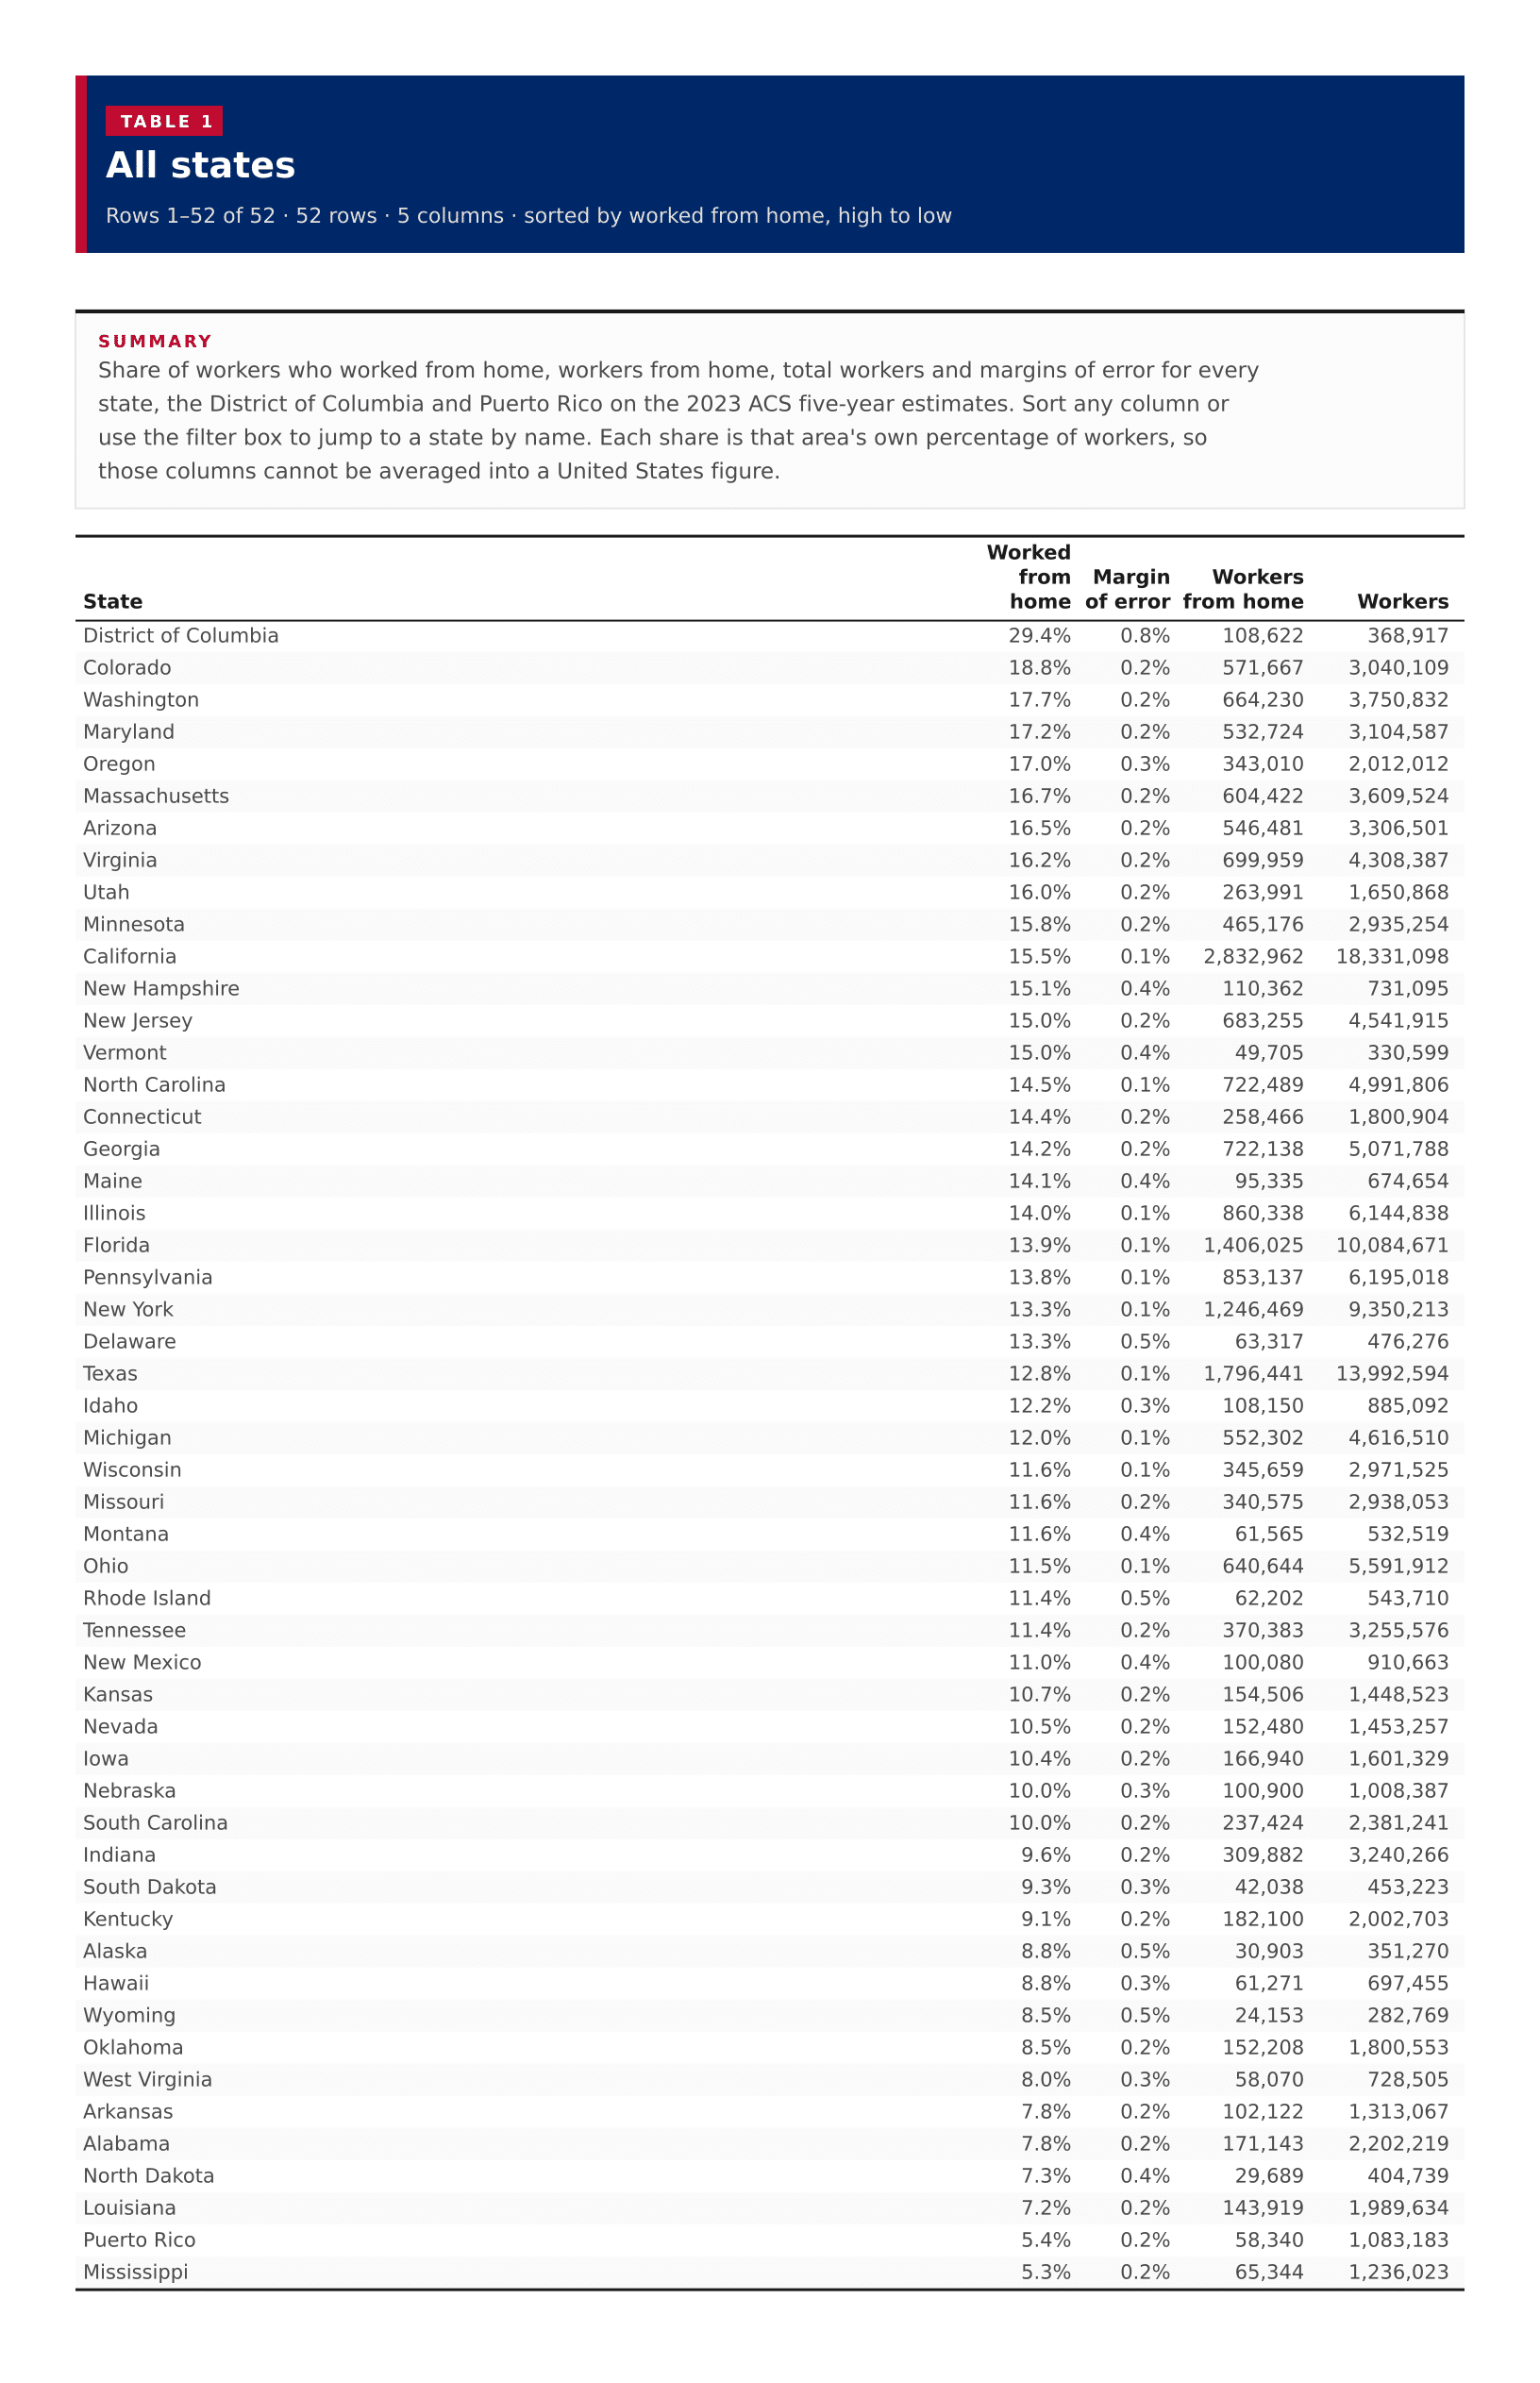
Share of workers who worked from home, workers from home, total workers and margins of error for every state, the District of Columbia and Puerto Rico on the 2023 ACS five-year estimates. Sort any column or use the filter box to jump to a state by name. Each share is that area's own percentage of workers, so those columns cannot be averaged into a United States figure.

All states
????
District of Columbia29.4%0.8%108,622368,917
Colorado18.8%0.2%571,6673,040,109
Washington17.7%0.2%664,2303,750,832
Maryland17.2%0.2%532,7243,104,587
Oregon17.0%0.3%343,0102,012,012
Massachusetts16.7%0.2%604,4223,609,524
Arizona16.5%0.2%546,4813,306,501
Virginia16.2%0.2%699,9594,308,387
Utah16.0%0.2%263,9911,650,868
Minnesota15.8%0.2%465,1762,935,254
California15.5%0.1%2,832,96218,331,098
New Hampshire15.1%0.4%110,362731,095
New Jersey15.0%0.2%683,2554,541,915
Vermont15.0%0.4%49,705330,599
North Carolina14.5%0.1%722,4894,991,806
Connecticut14.4%0.2%258,4661,800,904
Georgia14.2%0.2%722,1385,071,788
Maine14.1%0.4%95,335674,654
Illinois14.0%0.1%860,3386,144,838
Florida13.9%0.1%1,406,02510,084,671
Pennsylvania13.8%0.1%853,1376,195,018
New York13.3%0.1%1,246,4699,350,213
Delaware13.3%0.5%63,317476,276
Texas12.8%0.1%1,796,44113,992,594
Idaho12.2%0.3%108,150885,092
Michigan12.0%0.1%552,3024,616,510
Wisconsin11.6%0.1%345,6592,971,525
Missouri11.6%0.2%340,5752,938,053
Montana11.6%0.4%61,565532,519
Ohio11.5%0.1%640,6445,591,912
Rhode Island11.4%0.5%62,202543,710
Tennessee11.4%0.2%370,3833,255,576
New Mexico11.0%0.4%100,080910,663
Kansas10.7%0.2%154,5061,448,523
Nevada10.5%0.2%152,4801,453,257
Iowa10.4%0.2%166,9401,601,329
Nebraska10.0%0.3%100,9001,008,387
South Carolina10.0%0.2%237,4242,381,241
Indiana9.6%0.2%309,8823,240,266
South Dakota9.3%0.3%42,038453,223
Kentucky9.1%0.2%182,1002,002,703
Alaska8.8%0.5%30,903351,270
Hawaii8.8%0.3%61,271697,455
Wyoming8.5%0.5%24,153282,769
Oklahoma8.5%0.2%152,2081,800,553
West Virginia8.0%0.3%58,070728,505
Arkansas7.8%0.2%102,1221,313,067
Alabama7.8%0.2%171,1432,202,219
North Dakota7.3%0.4%29,689404,739
Louisiana7.2%0.2%143,9191,989,634
Puerto Rico5.4%0.2%58,3401,083,183
Mississippi5.3%0.2%65,3441,236,023

Image files

Download all

Figure 2

Worked from home, all published states

Figure 2: Worked from home, all published states
DownloadPDFImageCSV

About this data

  • Worked from home is the means-of-transportation response for workers 16 years and over who usually worked from home. The denominator is workers, not all residents.
  • A state remote-work share is that state's own percentage of workers, so these figures cannot be averaged to produce a national remote-work rate.
  • The Census published 50 states, the District of Columbia and Puerto Rico. None of the rates were suppressed, and no margins of error used ACS annotation sentinels.
  • Shares are recomputed from B08301 component counts (worked from home divided by total workers).
  • Puerto Rico is listed in the ranking and table but is not on the choropleth. Alaska and Hawaii appear on the ranking and as insets on the map.