Poverty rate by US state

Summary

Poverty rate, US states

Poverty rate by state · all 52 states · hover or tap a state for every figure on this page

52 items
View100%
DownloadPDFImageCSV
StatesMississippi
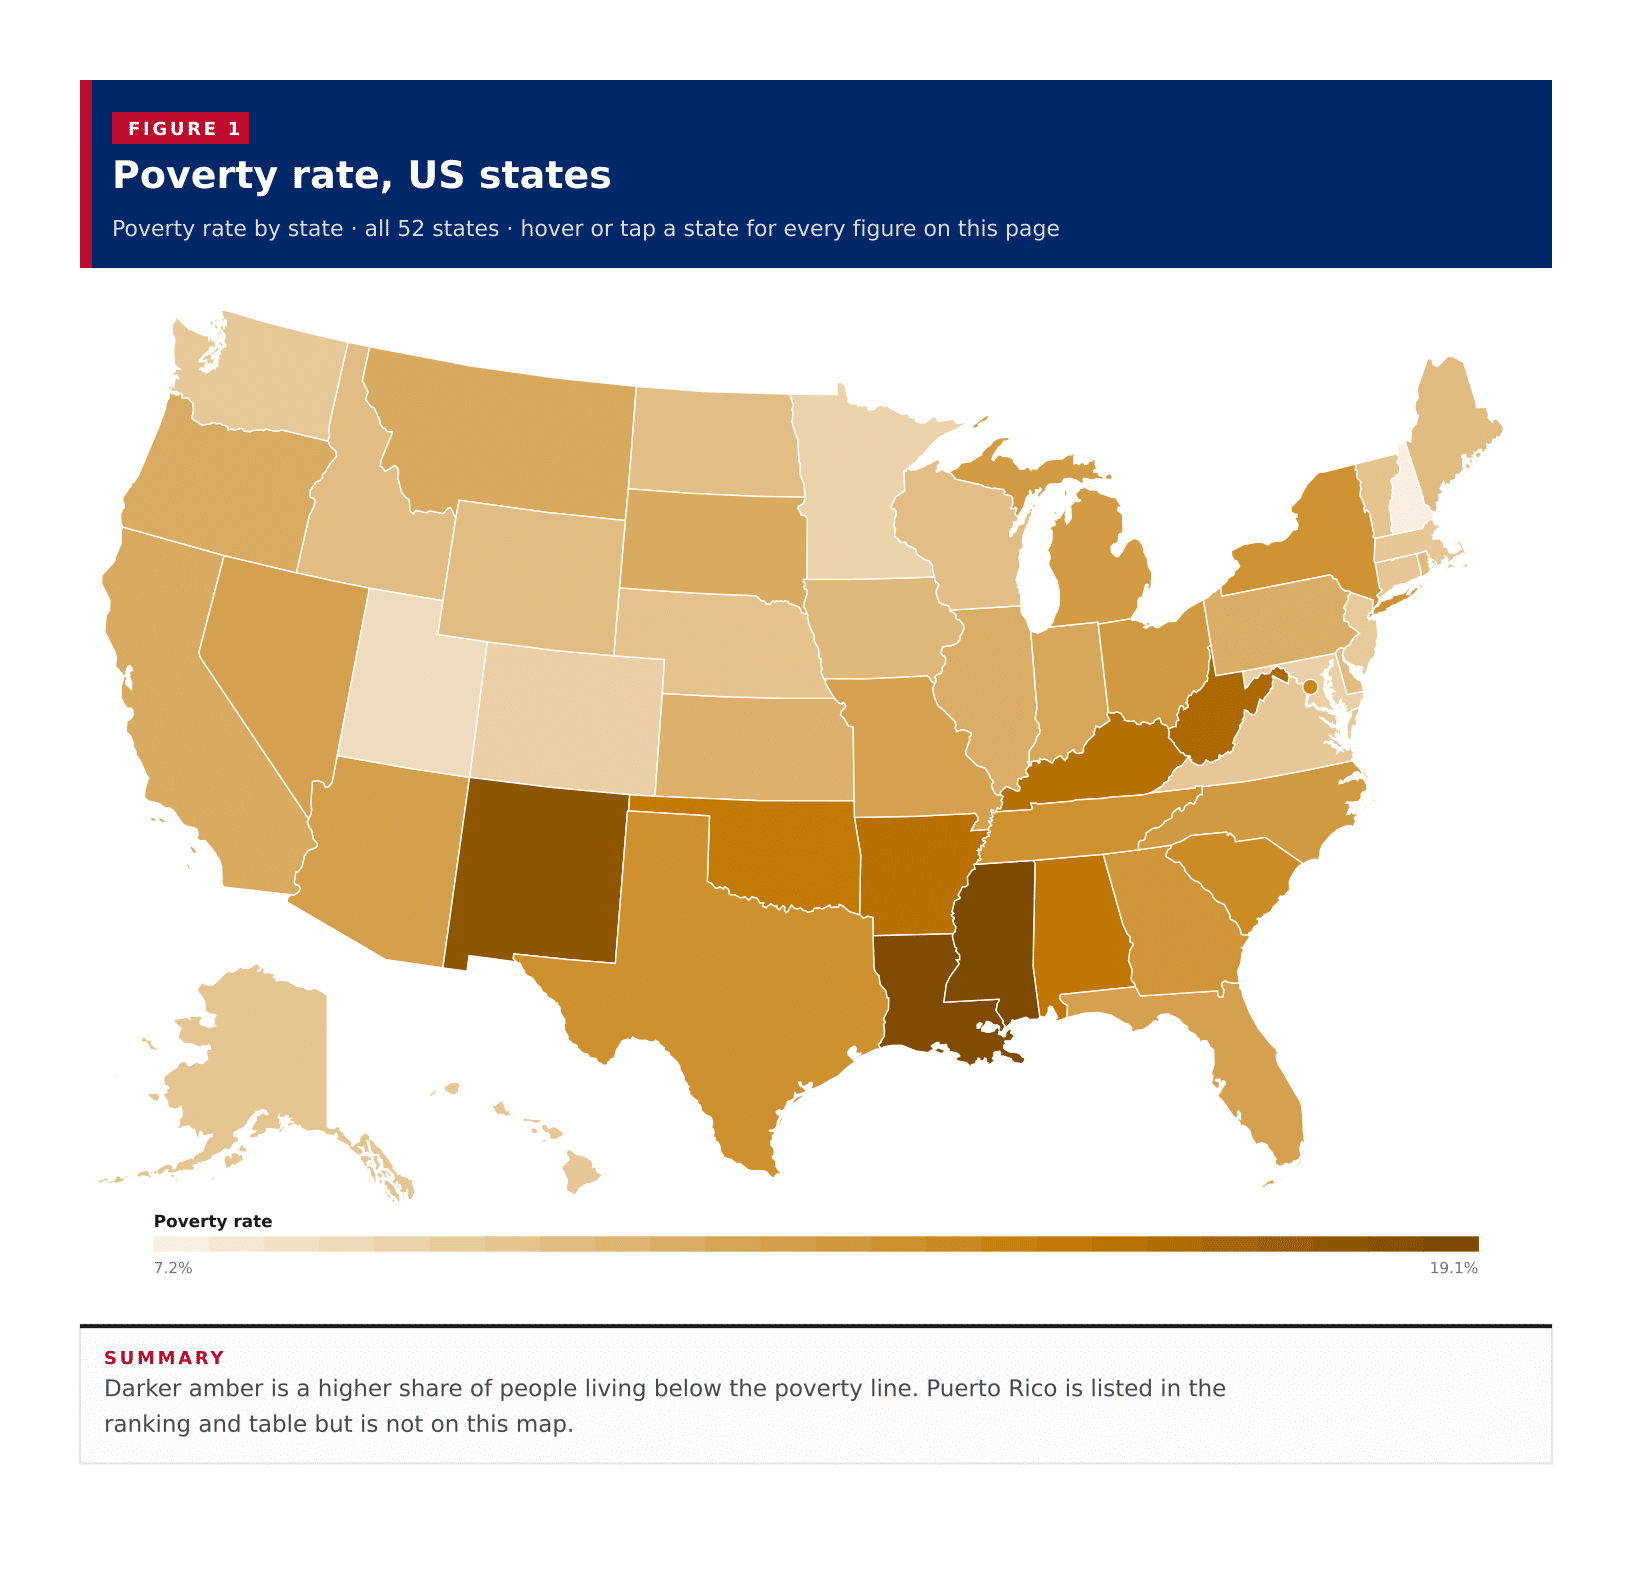
Poverty rate, US statesDarker amber is a higher share of people living below the poverty line. Puerto Rico is listed in the ranking and table but is not on this map.Alabama · Poverty rate: 15.6% · Margin of error: 0.2% · People below poverty: 768,185 · Poverty universe: 4,913,932 · Child poverty rate: 21.5% · 65 years and over: 11.4%Alaska · Poverty rate: 10.2% · Margin of error: 0.3% · People below poverty: 72,978 · Poverty universe: 716,703 · Child poverty rate: 12.5% · 65 years and over: 8.0%Arizona · Poverty rate: 12.8% · Margin of error: 0.2% · People below poverty: 907,125 · Poverty universe: 7,109,159 · Child poverty rate: 17.0% · 65 years and over: 9.9%Arkansas · Poverty rate: 16.0% · Margin of error: 0.3% · People below poverty: 471,783 · Poverty universe: 2,944,742 · Child poverty rate: 21.4% · 65 years and over: 11.2%California · Poverty rate: 12.0% · Margin of error: 0.1% · People below poverty: 4,610,600 · Poverty universe: 38,529,452 · Child poverty rate: 15.1% · 65 years and over: 11.3%Colorado · Poverty rate: 9.4% · Margin of error: 0.2% · People below poverty: 534,188 · Poverty universe: 5,693,064 · Child poverty rate: 10.9% · 65 years and over: 8.0%Connecticut · Poverty rate: 10.0% · Margin of error: 0.2% · People below poverty: 351,948 · Poverty universe: 3,510,193 · Child poverty rate: 13.1% · 65 years and over: 8.3%Delaware · Poverty rate: 10.7% · Margin of error: 0.5% · People below poverty: 105,246 · Poverty universe: 981,264 · Child poverty rate: 15.8% · 65 years and over: 7.0%Florida · Poverty rate: 12.6% · Margin of error: 0.1% · People below poverty: 2,707,698 · Poverty universe: 21,459,978 · Child poverty rate: 16.9% · 65 years and over: 11.4%Georgia · Poverty rate: 13.5% · Margin of error: 0.2% · People below poverty: 1,423,159 · Poverty universe: 10,560,625 · Child poverty rate: 18.7% · 65 years and over: 10.8%Hawaii · Poverty rate: 10.0% · Margin of error: 0.3% · People below poverty: 140,461 · Poverty universe: 1,409,460 · Child poverty rate: 12.5% · 65 years and over: 8.9%Idaho · Poverty rate: 10.6% · Margin of error: 0.3% · People below poverty: 196,060 · Poverty universe: 1,843,325 · Child poverty rate: 12.5% · 65 years and over: 8.3%Illinois · Poverty rate: 11.7% · Margin of error: 0.1% · People below poverty: 1,454,217 · Poverty universe: 12,410,718 · Child poverty rate: 15.4% · 65 years and over: 9.8%Indiana · Poverty rate: 12.2% · Margin of error: 0.2% · People below poverty: 807,582 · Poverty universe: 6,616,834 · Child poverty rate: 15.7% · 65 years and over: 8.6%Iowa · Poverty rate: 11.0% · Margin of error: 0.2% · People below poverty: 340,362 · Poverty universe: 3,096,878 · Child poverty rate: 12.7% · 65 years and over: 8.2%Kansas · Poverty rate: 11.5% · Margin of error: 0.2% · People below poverty: 328,475 · Poverty universe: 2,850,379 · Child poverty rate: 13.7% · 65 years and over: 8.5%Kentucky · Poverty rate: 16.1% · Margin of error: 0.2% · People below poverty: 707,480 · Poverty universe: 4,382,816 · Child poverty rate: 20.9% · 65 years and over: 12.3%Louisiana · Poverty rate: 18.9% · Margin of error: 0.3% · People below poverty: 848,769 · Poverty universe: 4,494,539 · Child poverty rate: 25.7% · 65 years and over: 14.1%Maine · Poverty rate: 10.8% · Margin of error: 0.3% · People below poverty: 144,263 · Poverty universe: 1,338,071 · Child poverty rate: 13.1% · 65 years and over: 9.2%Maryland · Poverty rate: 9.3% · Margin of error: 0.2% · People below poverty: 564,966 · Poverty universe: 6,042,502 · Child poverty rate: 11.5% · 65 years and over: 9.0%Massachusetts · Poverty rate: 10.0% · Margin of error: 0.2% · People below poverty: 676,516 · Poverty universe: 6,777,241 · Child poverty rate: 11.8% · 65 years and over: 10.2%Michigan · Poverty rate: 13.1% · Margin of error: 0.1% · People below poverty: 1,284,470 · Poverty universe: 9,842,260 · Child poverty rate: 17.5% · 65 years and over: 9.3%Minnesota · Poverty rate: 9.2% · Margin of error: 0.2% · People below poverty: 514,300 · Poverty universe: 5,591,806 · Child poverty rate: 10.6% · 65 years and over: 8.4%Mississippi · Poverty rate: 19.1% · Margin of error: 0.4% · People below poverty: 543,697 · Poverty universe: 2,851,847 · Child poverty rate: 26.4% · 65 years and over: 14.3%Missouri · Poverty rate: 12.6% · Margin of error: 0.2% · People below poverty: 756,528 · Poverty universe: 5,994,199 · Child poverty rate: 16.0% · 65 years and over: 10.0%Montana · Poverty rate: 12.0% · Margin of error: 0.3% · People below poverty: 129,998 · Poverty universe: 1,079,200 · Child poverty rate: 13.8% · 65 years and over: 9.6%Nebraska · Poverty rate: 10.3% · Margin of error: 0.3% · People below poverty: 197,300 · Poverty universe: 1,916,409 · Child poverty rate: 11.6% · 65 years and over: 8.9%Nevada · Poverty rate: 12.6% · Margin of error: 0.3% · People below poverty: 390,414 · Poverty universe: 3,100,449 · Child poverty rate: 16.8% · 65 years and over: 10.4%New Hampshire · Poverty rate: 7.2% · Margin of error: 0.2% · People below poverty: 96,457 · Poverty universe: 1,347,951 · Child poverty rate: 7.8% · 65 years and over: 7.4%New Jersey · Poverty rate: 9.8% · Margin of error: 0.2% · People below poverty: 889,287 · Poverty universe: 9,101,339 · Child poverty rate: 13.3% · 65 years and over: 9.5%New Mexico · Poverty rate: 18.1% · Margin of error: 0.4% · People below poverty: 375,381 · Poverty universe: 2,073,857 · Child poverty rate: 24.5% · 65 years and over: 13.1%New York · Poverty rate: 13.7% · Margin of error: 0.1% · People below poverty: 2,656,674 · Poverty universe: 19,391,750 · Child poverty rate: 18.2% · 65 years and over: 12.7%North Carolina · Poverty rate: 13.2% · Margin of error: 0.2% · People below poverty: 1,355,827 · Poverty universe: 10,297,193 · Child poverty rate: 18.1% · 65 years and over: 10.2%North Dakota · Poverty rate: 10.6% · Margin of error: 0.4% · People below poverty: 79,628 · Poverty universe: 752,523 · Child poverty rate: 10.6% · 65 years and over: 9.2%Ohio · Poverty rate: 13.2% · Margin of error: 0.2% · People below poverty: 1,519,610 · Poverty universe: 11,478,861 · Child poverty rate: 18.0% · 65 years and over: 9.5%Oklahoma · Poverty rate: 15.3% · Margin of error: 0.2% · People below poverty: 593,820 · Poverty universe: 3,872,738 · Child poverty rate: 20.1% · 65 years and over: 10.2%Oregon · Poverty rate: 11.9% · Margin of error: 0.2% · People below poverty: 494,736 · Poverty universe: 4,159,818 · Child poverty rate: 13.3% · 65 years and over: 9.4%Pennsylvania · Poverty rate: 11.8% · Margin of error: 0.2% · People below poverty: 1,480,981 · Poverty universe: 12,575,248 · Child poverty rate: 16.0% · 65 years and over: 9.4%Rhode Island · Poverty rate: 10.9% · Margin of error: 0.5% · People below poverty: 114,890 · Poverty universe: 1,053,498 · Child poverty rate: 13.3% · 65 years and over: 10.5%South Carolina · Poverty rate: 14.2% · Margin of error: 0.3% · People below poverty: 719,720 · Poverty universe: 5,072,217 · Child poverty rate: 19.7% · 65 years and over: 10.7%South Dakota · Poverty rate: 12.0% · Margin of error: 0.4% · People below poverty: 104,511 · Poverty universe: 869,964 · Child poverty rate: 15.0% · 65 years and over: 9.3%Tennessee · Poverty rate: 13.8% · Margin of error: 0.2% · People below poverty: 940,092 · Poverty universe: 6,825,291 · Child poverty rate: 18.7% · 65 years and over: 10.8%Texas · Poverty rate: 13.8% · Margin of error: 0.1% · People below poverty: 4,005,417 · Poverty universe: 29,016,925 · Child poverty rate: 18.9% · 65 years and over: 11.7%Utah · Poverty rate: 8.6% · Margin of error: 0.2% · People below poverty: 280,516 · Poverty universe: 3,278,204 · Child poverty rate: 8.9% · 65 years and over: 7.2%Vermont · Poverty rate: 10.3% · Margin of error: 0.4% · People below poverty: 63,902 · Poverty universe: 622,390 · Child poverty rate: 10.8% · 65 years and over: 8.2%Virginia · Poverty rate: 9.9% · Margin of error: 0.2% · People below poverty: 834,866 · Poverty universe: 8,413,302 · Child poverty rate: 12.7% · 65 years and over: 8.3%Washington · Poverty rate: 9.9% · Margin of error: 0.2% · People below poverty: 753,455 · Poverty universe: 7,606,327 · Child poverty rate: 11.9% · 65 years and over: 8.5%West Virginia · Poverty rate: 16.6% · Margin of error: 0.4% · People below poverty: 287,660 · Poverty universe: 1,728,580 · Child poverty rate: 21.4% · 65 years and over: 11.2%Wisconsin · Poverty rate: 10.6% · Margin of error: 0.2% · People below poverty: 609,003 · Poverty universe: 5,757,334 · Child poverty rate: 13.0% · 65 years and over: 8.6%Wyoming · Poverty rate: 10.7% · Margin of error: 0.6% · People below poverty: 60,704 · Poverty universe: 565,918 · Child poverty rate: 12.6% · 65 years and over: 7.9%District of Columbia · Poverty rate: 14.5% · Margin of error: 0.7% · People below poverty: 94,140 · Poverty universe: 647,874 · Child poverty rate: 20.4% · 65 years and over: 14.6%District of Columbia · Poverty rate: 14.5% · Margin of error: 0.7% · People below poverty: 94,140 · Poverty universe: 647,874 · Child poverty rate: 20.4% · 65 years and over: 14.6%Poverty rate7.2%19.1%
Summary

Darker amber is a higher share of people living below the poverty line. Puerto Rico is listed in the ranking and table but is not on this map.

A typical published area has a poverty rate of 11.9 percent, the midpoint of the 50 states, the District of Columbia and Puerto Rico on the 2023 ACS five-year estimates. Mississippi has the highest rate among the 50 states at 19.1 percent, followed by Louisiana at 18.9 percent and New Mexico at 18.1 percent. New Hampshire is the lowest at 7.2 percent. Puerto Rico, which this table also returns, sits far higher at 41.6 percent. Mississippi is 11.9 percentage points above New Hampshire, and Puerto Rico is 34.4 points above New Hampshire. These are each area's own poverty rate for people whose poverty status was determined, not a national average of states.
In short

11.9%typical published areathe middle area, not an average
19.1%Mississippihighest of the 50 states
7.2%New Hampshirelowest poverty rate
41.6%Puerto Ricohighest figure the Census published
8states at or above 15%Mississippi, Louisiana, New Mexico, West Virginia, Kentucky, Arkansas, Alabama and Oklahoma
Figure 1

Poverty rate, all published states

Poverty rate · all 52 · ranked high to low

52 items
View100%
DownloadPDFImageCSV
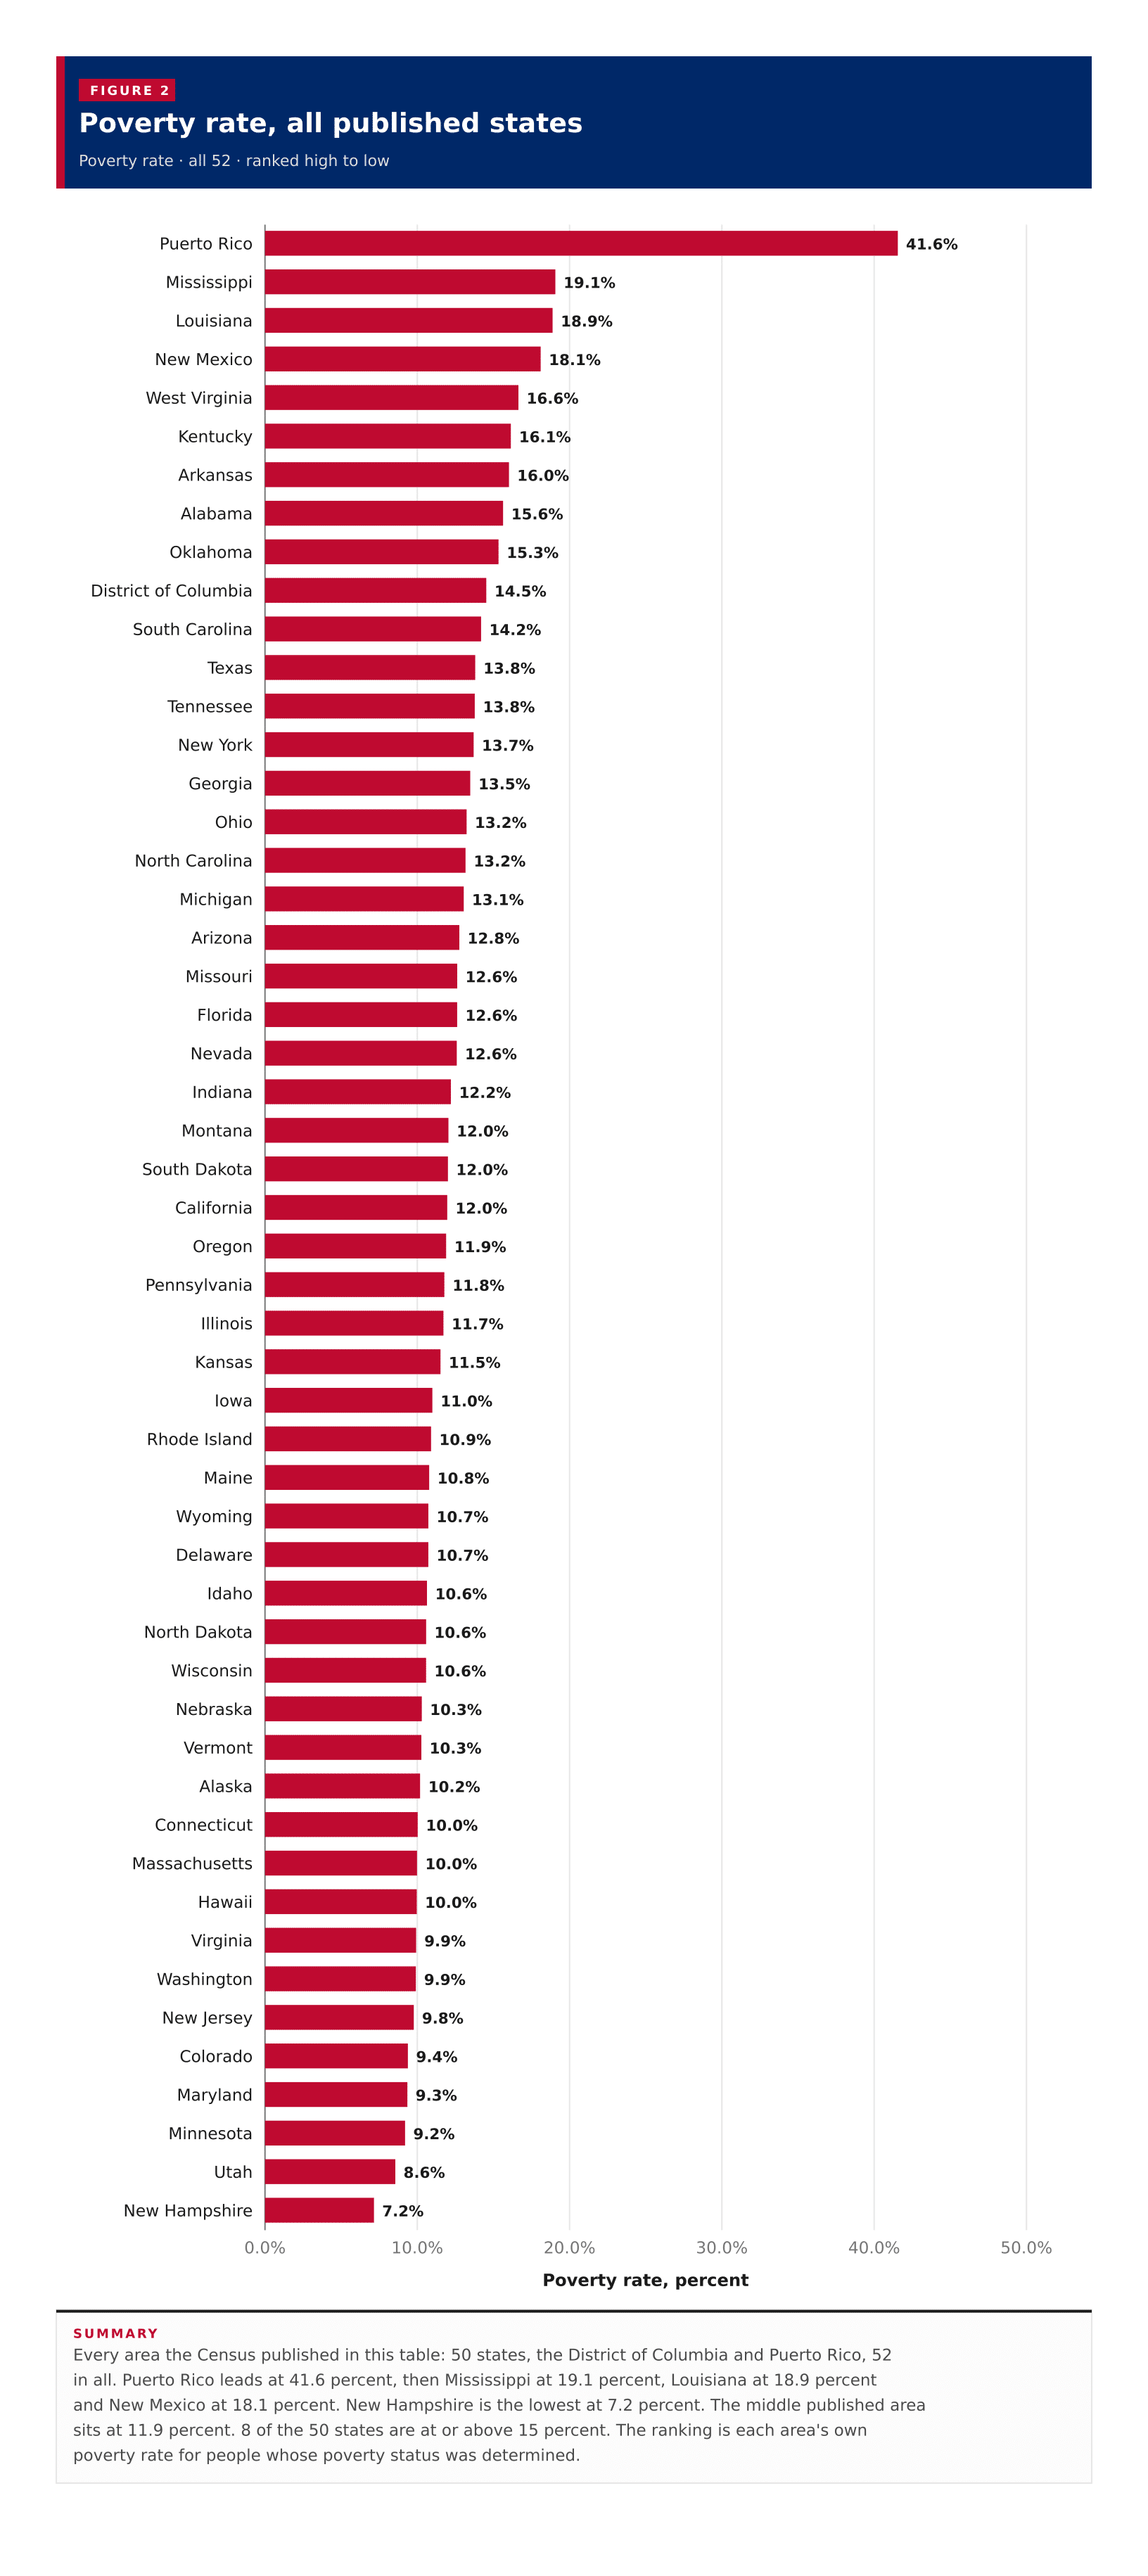
Poverty rate, all published statesEvery area the Census published in this table: 50 states, the District of Columbia and Puerto Rico, 52 in all. Puerto Rico leads at 41.6 percent, then Mississippi at 19.1 percent, Louisiana at 18.9 percent and New Mexico at 18.1 percent. New Hampshire is the lowest at 7.2 percent. The middle published area sits at 11.9 percent. 8 of the 50 states are at or above 15 percent. The ranking is each area's own poverty rate for people whose poverty status was determined.0.0%10.0%20.0%30.0%40.0%50.0%Poverty rate, percent41.6%Puerto Rico19.1%Mississippi18.9%Louisiana18.1%New Mexico16.6%West Virginia16.1%Kentucky16.0%Arkansas15.6%Alabama15.3%Oklahoma14.5%District of Columbia14.2%South Carolina13.8%Texas13.8%Tennessee13.7%New York13.5%Georgia13.2%Ohio13.2%North Carolina13.1%Michigan12.8%Arizona12.6%Missouri12.6%Florida12.6%Nevada12.2%Indiana12.0%Montana12.0%South Dakota12.0%California11.9%Oregon11.8%Pennsylvania11.7%Illinois11.5%Kansas11.0%Iowa10.9%Rhode Island10.8%Maine10.7%Wyoming10.7%Delaware10.6%Idaho10.6%North Dakota10.6%Wisconsin10.3%Nebraska10.3%Vermont10.2%Alaska10.0%Connecticut10.0%Massachusetts10.0%Hawaii9.9%Virginia9.9%Washington9.8%New Jersey9.4%Colorado9.3%Maryland9.2%Minnesota8.6%Utah7.2%New Hampshire
Summary

Every area the Census published in this table: 50 states, the District of Columbia and Puerto Rico, 52 in all. Puerto Rico leads at 41.6 percent, then Mississippi at 19.1 percent, Louisiana at 18.9 percent and New Mexico at 18.1 percent. New Hampshire is the lowest at 7.2 percent. The middle published area sits at 11.9 percent. 8 of the 50 states are at or above 15 percent. The ranking is each area's own poverty rate for people whose poverty status was determined.

Figure 2

Child poverty rate, all published states

Child poverty rate · all 52 · ranked high to low

52 items
View100%
DownloadPDFImageCSV
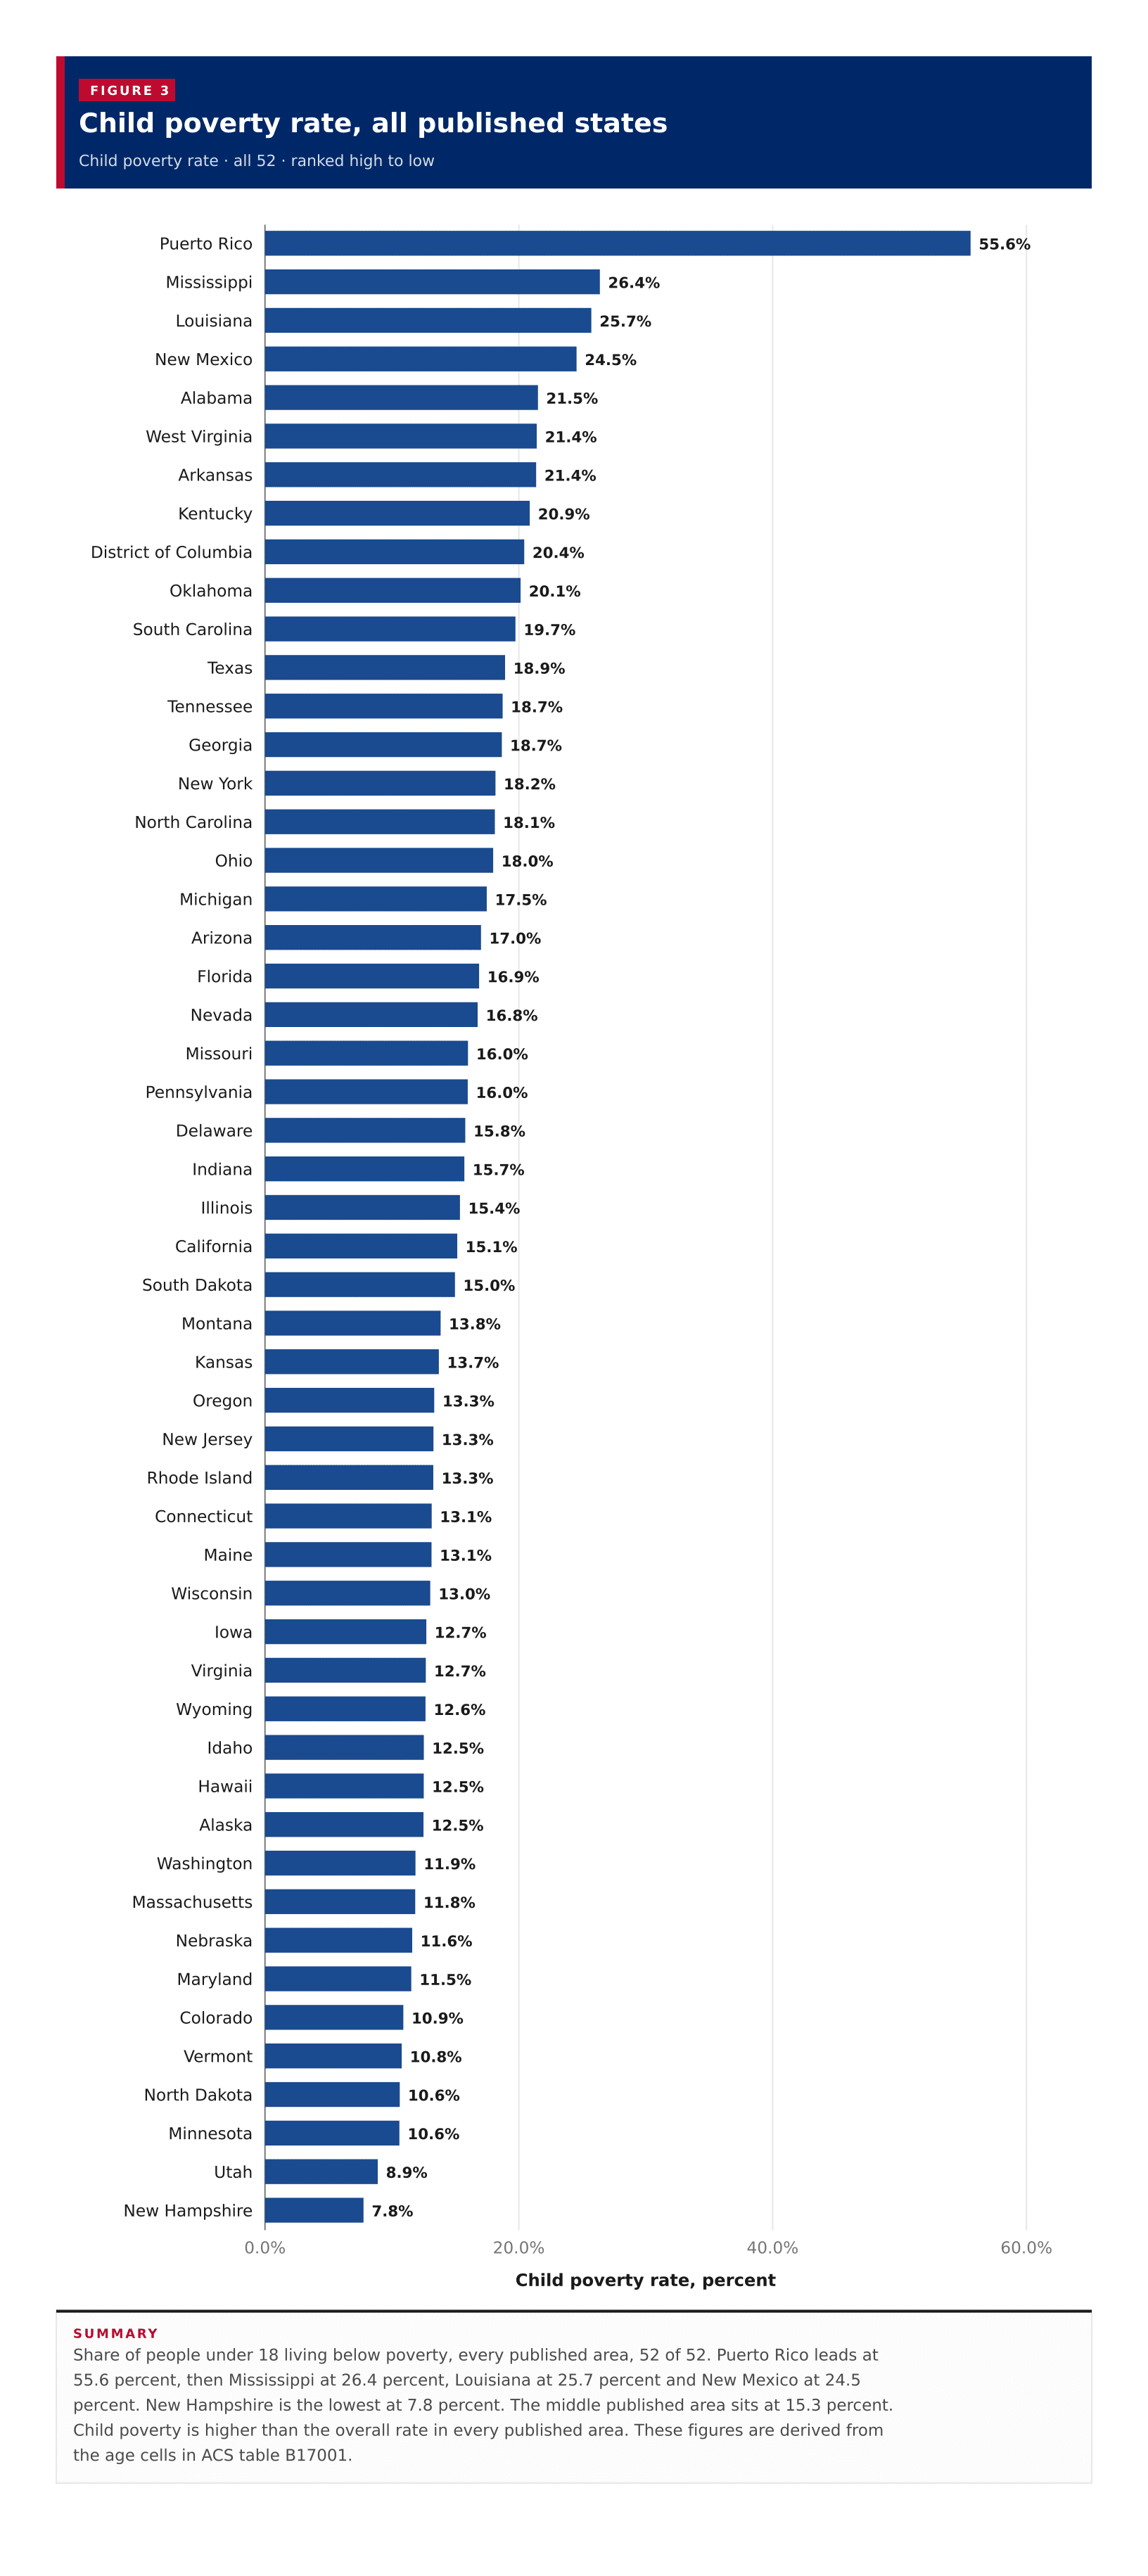
Child poverty rate, all published statesShare of people under 18 living below poverty, every published area, 52 of 52. Puerto Rico leads at 55.6 percent, then Mississippi at 26.4 percent, Louisiana at 25.7 percent and New Mexico at 24.5 percent. New Hampshire is the lowest at 7.8 percent. The middle published area sits at 15.3 percent. Child poverty is higher than the overall rate in every published area. These figures are derived from the age cells in ACS table B17001.0.0%20.0%40.0%60.0%Child poverty rate, percent55.6%Puerto Rico26.4%Mississippi25.7%Louisiana24.5%New Mexico21.5%Alabama21.4%West Virginia21.4%Arkansas20.9%Kentucky20.4%District of Columbia20.1%Oklahoma19.7%South Carolina18.9%Texas18.7%Tennessee18.7%Georgia18.2%New York18.1%North Carolina18.0%Ohio17.5%Michigan17.0%Arizona16.9%Florida16.8%Nevada16.0%Missouri16.0%Pennsylvania15.8%Delaware15.7%Indiana15.4%Illinois15.1%California15.0%South Dakota13.8%Montana13.7%Kansas13.3%Oregon13.3%New Jersey13.3%Rhode Island13.1%Connecticut13.1%Maine13.0%Wisconsin12.7%Iowa12.7%Virginia12.6%Wyoming12.5%Idaho12.5%Hawaii12.5%Alaska11.9%Washington11.8%Massachusetts11.6%Nebraska11.5%Maryland10.9%Colorado10.8%Vermont10.6%North Dakota10.6%Minnesota8.9%Utah7.8%New Hampshire
Summary

Share of people under 18 living below poverty, every published area, 52 of 52. Puerto Rico leads at 55.6 percent, then Mississippi at 26.4 percent, Louisiana at 25.7 percent and New Mexico at 24.5 percent. New Hampshire is the lowest at 7.8 percent. The middle published area sits at 15.3 percent. Child poverty is higher than the overall rate in every published area. These figures are derived from the age cells in ACS table B17001.

Figure 3

Poverty rate against child poverty

Child poverty rate against poverty rate · one point per row, 52 of 52 plotted

52 items
View100%
DownloadPDFImageCSV
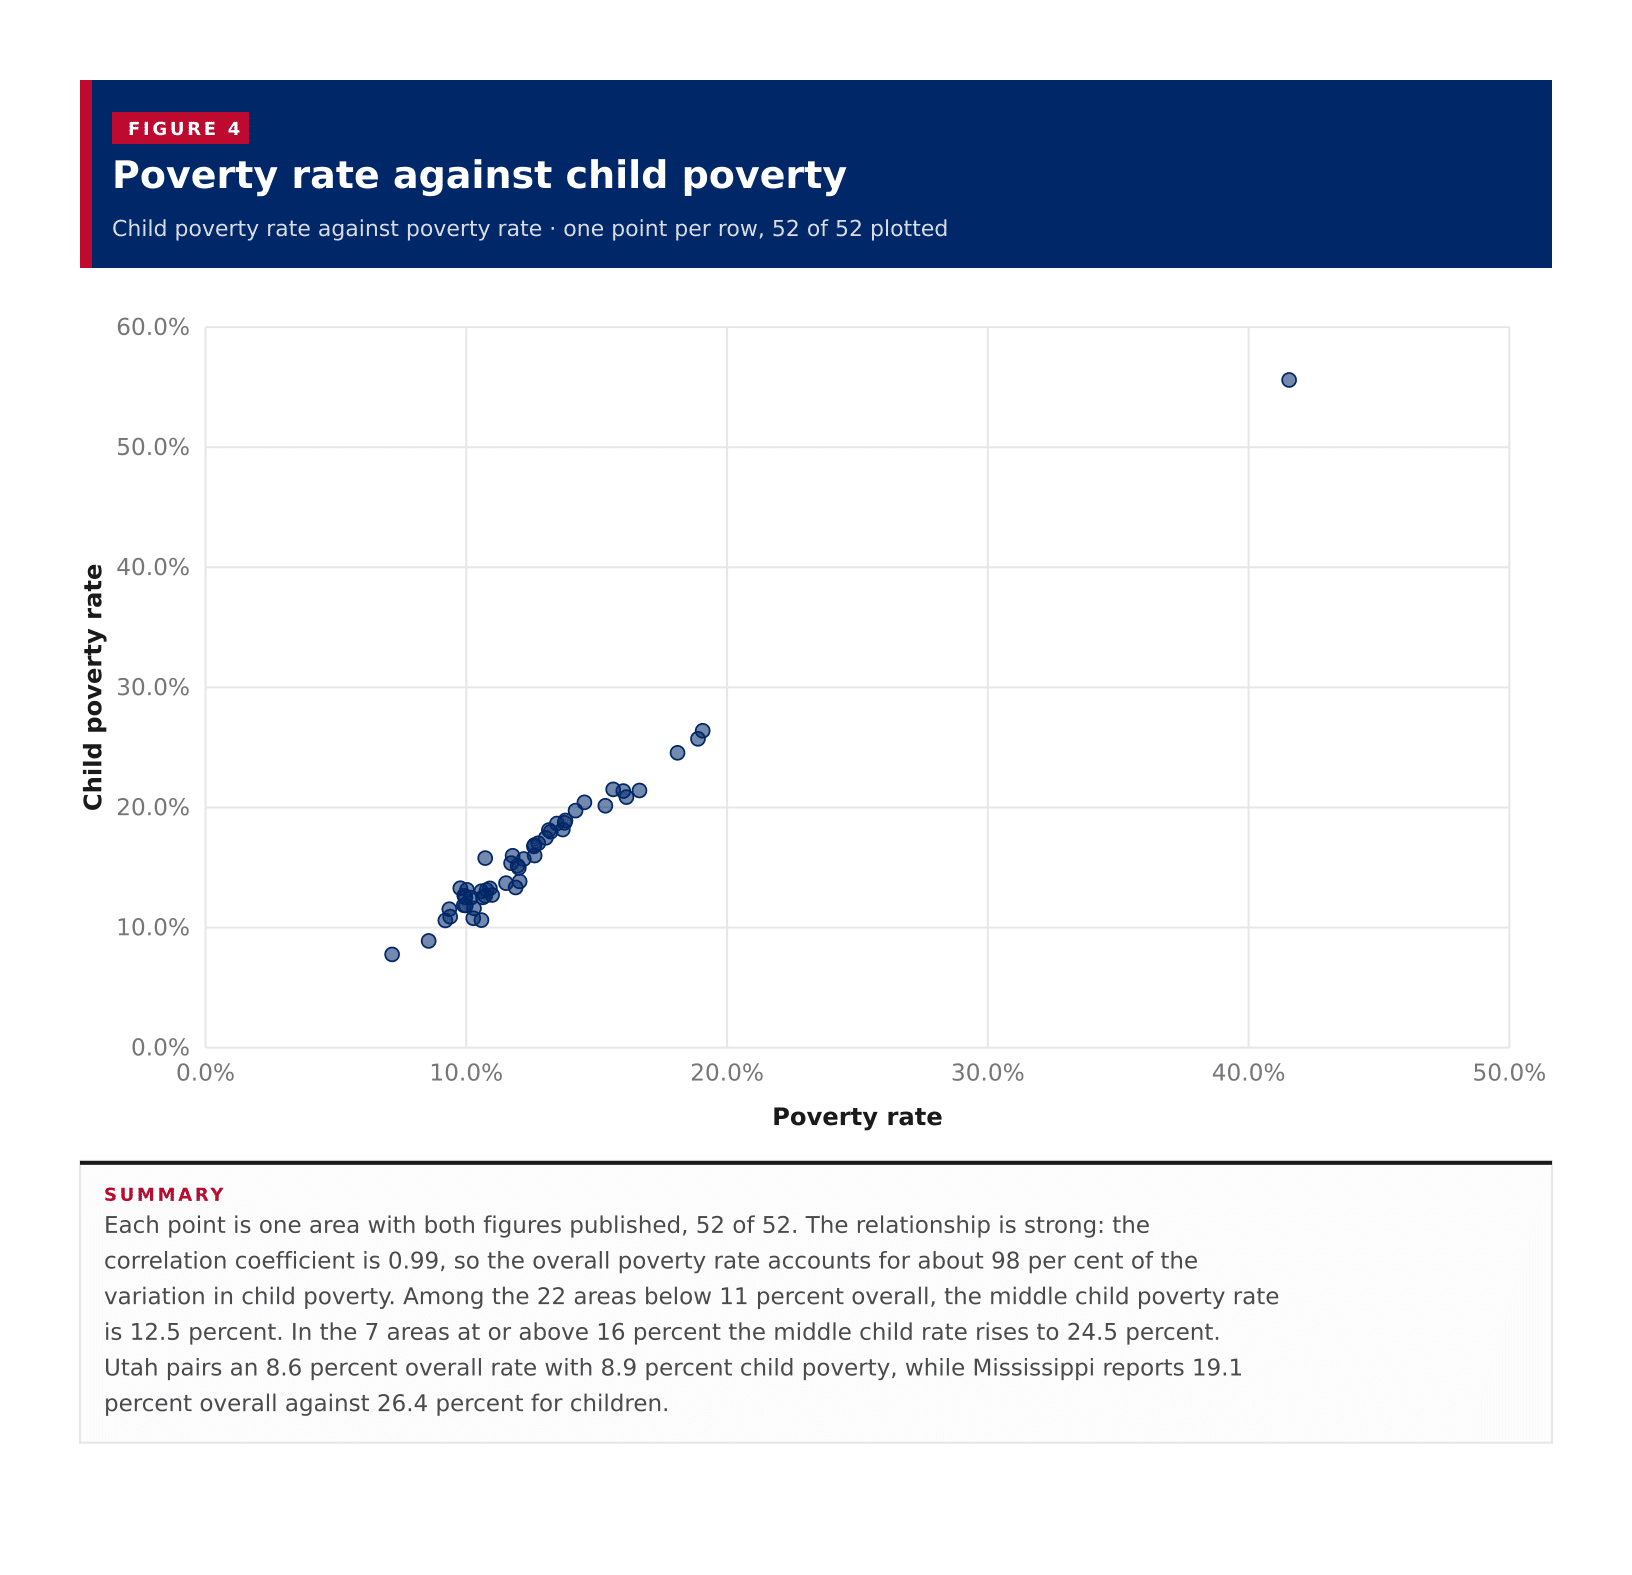
Poverty rate against child povertyEach point is one area with both figures published, 52 of 52. The relationship is strong: the correlation coefficient is 0.99, so the overall poverty rate accounts for about 98 per cent of the variation in child poverty. Among the 22 areas below 11 percent overall, the middle child poverty rate is 12.5 percent. In the 7 areas at or above 16 percent the middle child rate rises to 24.5 percent. Utah pairs an 8.6 percent overall rate with 8.9 percent child poverty, while Mississippi reports 19.1 percent overall against 26.4 percent for children.0.0%10.0%20.0%30.0%40.0%50.0%60.0%0.0%10.0%20.0%30.0%40.0%50.0%Child poverty ratePoverty rate
Summary

Each point is one area with both figures published, 52 of 52. The relationship is strong: the correlation coefficient is 0.99, so the overall poverty rate accounts for about 98 per cent of the variation in child poverty. Among the 22 areas below 11 percent overall, the middle child poverty rate is 12.5 percent. In the 7 areas at or above 16 percent the middle child rate rises to 24.5 percent. Utah pairs an 8.6 percent overall rate with 8.9 percent child poverty, while Mississippi reports 19.1 percent overall against 26.4 percent for children.

Table 1

All states

52 rows · 7 columns · sorted by poverty rate, high to low

52 rows
View100%
DownloadPDFImageCSV
Summary

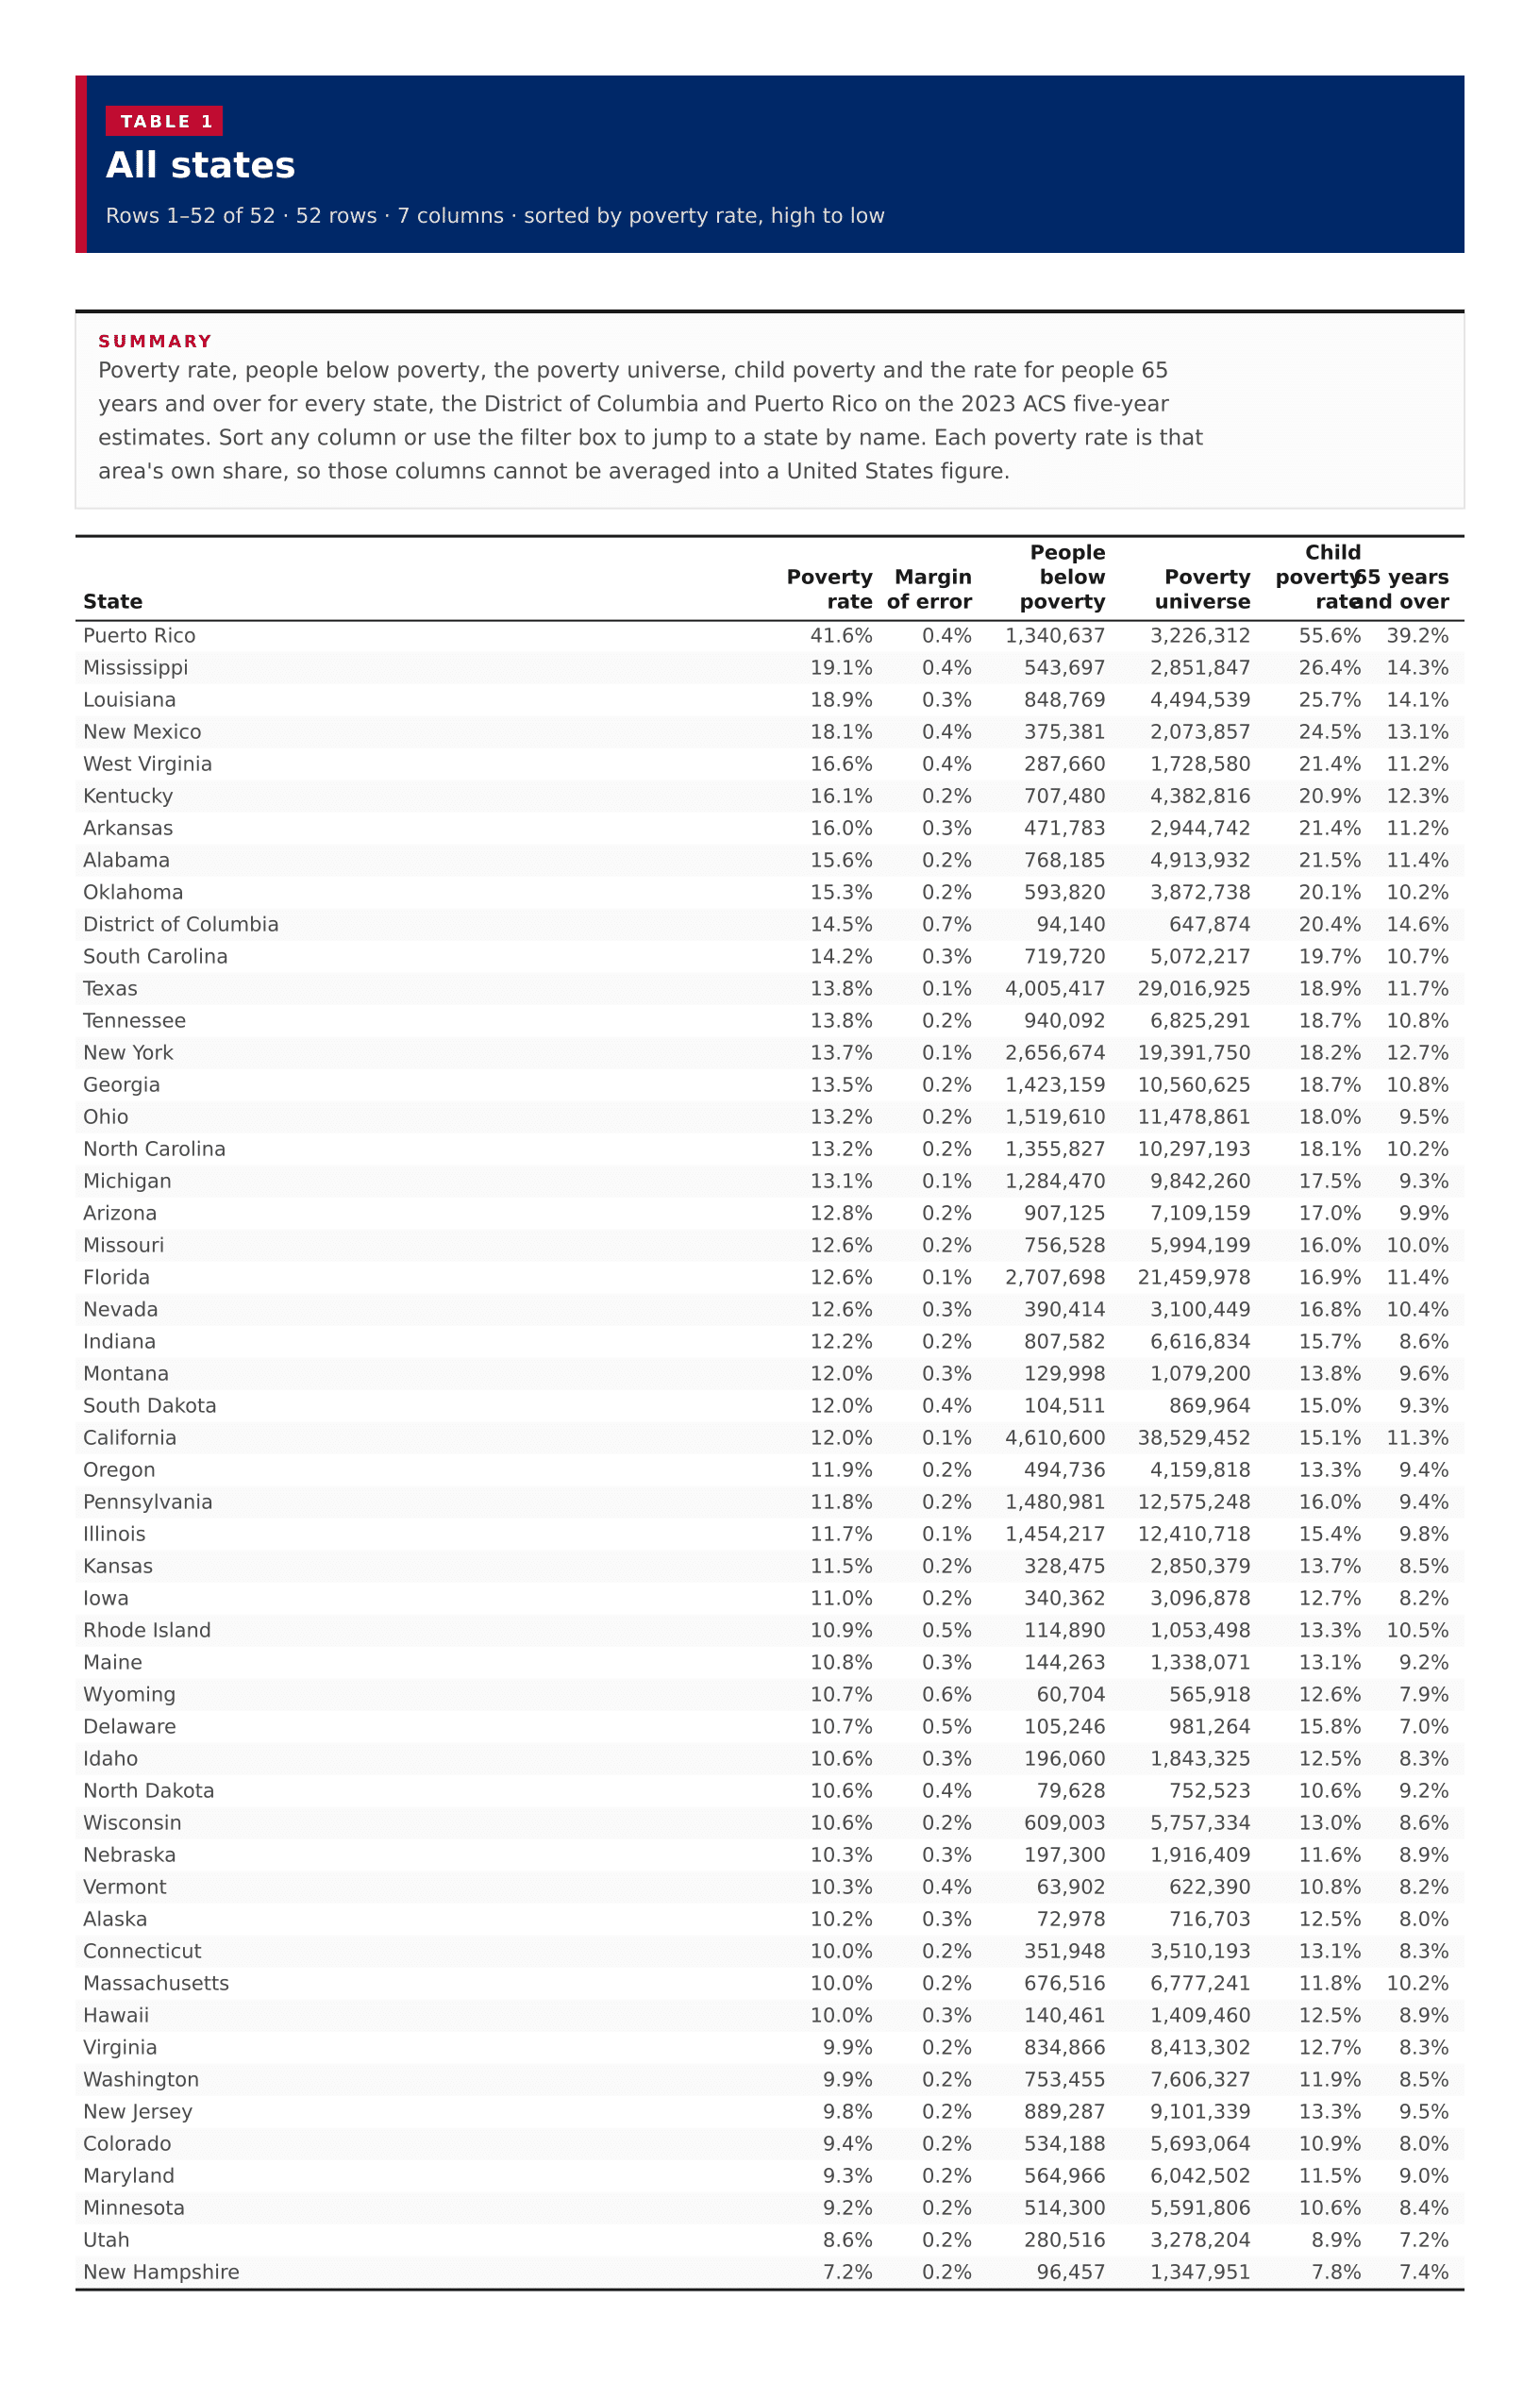
Poverty rate, people below poverty, the poverty universe, child poverty and the rate for people 65 years and over for every state, the District of Columbia and Puerto Rico on the 2023 ACS five-year estimates. Sort any column or use the filter box to jump to a state by name. Each poverty rate is that area's own share, so those columns cannot be averaged into a United States figure.

All states
??????
Puerto Rico41.6%0.4%1,340,6373,226,31255.6%39.2%
Mississippi19.1%0.4%543,6972,851,84726.4%14.3%
Louisiana18.9%0.3%848,7694,494,53925.7%14.1%
New Mexico18.1%0.4%375,3812,073,85724.5%13.1%
West Virginia16.6%0.4%287,6601,728,58021.4%11.2%
Kentucky16.1%0.2%707,4804,382,81620.9%12.3%
Arkansas16.0%0.3%471,7832,944,74221.4%11.2%
Alabama15.6%0.2%768,1854,913,93221.5%11.4%
Oklahoma15.3%0.2%593,8203,872,73820.1%10.2%
District of Columbia14.5%0.7%94,140647,87420.4%14.6%
South Carolina14.2%0.3%719,7205,072,21719.7%10.7%
Texas13.8%0.1%4,005,41729,016,92518.9%11.7%
Tennessee13.8%0.2%940,0926,825,29118.7%10.8%
New York13.7%0.1%2,656,67419,391,75018.2%12.7%
Georgia13.5%0.2%1,423,15910,560,62518.7%10.8%
Ohio13.2%0.2%1,519,61011,478,86118.0%9.5%
North Carolina13.2%0.2%1,355,82710,297,19318.1%10.2%
Michigan13.1%0.1%1,284,4709,842,26017.5%9.3%
Arizona12.8%0.2%907,1257,109,15917.0%9.9%
Missouri12.6%0.2%756,5285,994,19916.0%10.0%
Florida12.6%0.1%2,707,69821,459,97816.9%11.4%
Nevada12.6%0.3%390,4143,100,44916.8%10.4%
Indiana12.2%0.2%807,5826,616,83415.7%8.6%
Montana12.0%0.3%129,9981,079,20013.8%9.6%
South Dakota12.0%0.4%104,511869,96415.0%9.3%
California12.0%0.1%4,610,60038,529,45215.1%11.3%
Oregon11.9%0.2%494,7364,159,81813.3%9.4%
Pennsylvania11.8%0.2%1,480,98112,575,24816.0%9.4%
Illinois11.7%0.1%1,454,21712,410,71815.4%9.8%
Kansas11.5%0.2%328,4752,850,37913.7%8.5%
Iowa11.0%0.2%340,3623,096,87812.7%8.2%
Rhode Island10.9%0.5%114,8901,053,49813.3%10.5%
Maine10.8%0.3%144,2631,338,07113.1%9.2%
Wyoming10.7%0.6%60,704565,91812.6%7.9%
Delaware10.7%0.5%105,246981,26415.8%7.0%
Idaho10.6%0.3%196,0601,843,32512.5%8.3%
North Dakota10.6%0.4%79,628752,52310.6%9.2%
Wisconsin10.6%0.2%609,0035,757,33413.0%8.6%
Nebraska10.3%0.3%197,3001,916,40911.6%8.9%
Vermont10.3%0.4%63,902622,39010.8%8.2%
Alaska10.2%0.3%72,978716,70312.5%8.0%
Connecticut10.0%0.2%351,9483,510,19313.1%8.3%
Massachusetts10.0%0.2%676,5166,777,24111.8%10.2%
Hawaii10.0%0.3%140,4611,409,46012.5%8.9%
Virginia9.9%0.2%834,8668,413,30212.7%8.3%
Washington9.9%0.2%753,4557,606,32711.9%8.5%
New Jersey9.8%0.2%889,2879,101,33913.3%9.5%
Colorado9.4%0.2%534,1885,693,06410.9%8.0%
Maryland9.3%0.2%564,9666,042,50211.5%9.0%
Minnesota9.2%0.2%514,3005,591,80610.6%8.4%
Utah8.6%0.2%280,5163,278,2048.9%7.2%
New Hampshire7.2%0.2%96,4571,347,9517.8%7.4%

Image files

Download all

Figure 2

Poverty rate, all published states

Figure 2: Poverty rate, all published states
DownloadPDFImageCSV

Figure 3

Child poverty rate, all published states

Figure 3: Child poverty rate, all published states
DownloadPDFImageCSV

Figure 4

Poverty rate against child poverty

Figure 4: Poverty rate against child poverty
DownloadPDFImageCSV

About this data

  • Poverty status is determined for most people living in housing units. It is not determined for people in institutional group quarters such as prisons and nursing homes, or for people in college dormitories or military barracks.
  • A state poverty rate is that state's own share of people below the poverty line, so these figures cannot be averaged to produce a national figure.
  • The Census published 50 states, the District of Columbia and Puerto Rico. None of the rates were suppressed.
  • Child poverty is the share of people under 18 below poverty. The 65 years and over rate uses the older-age cells in the same table. Both are derived from B17001.
  • Puerto Rico is listed in the ranking and table but is not on the choropleth. Alaska and Hawaii appear on the ranking and as insets on the map.