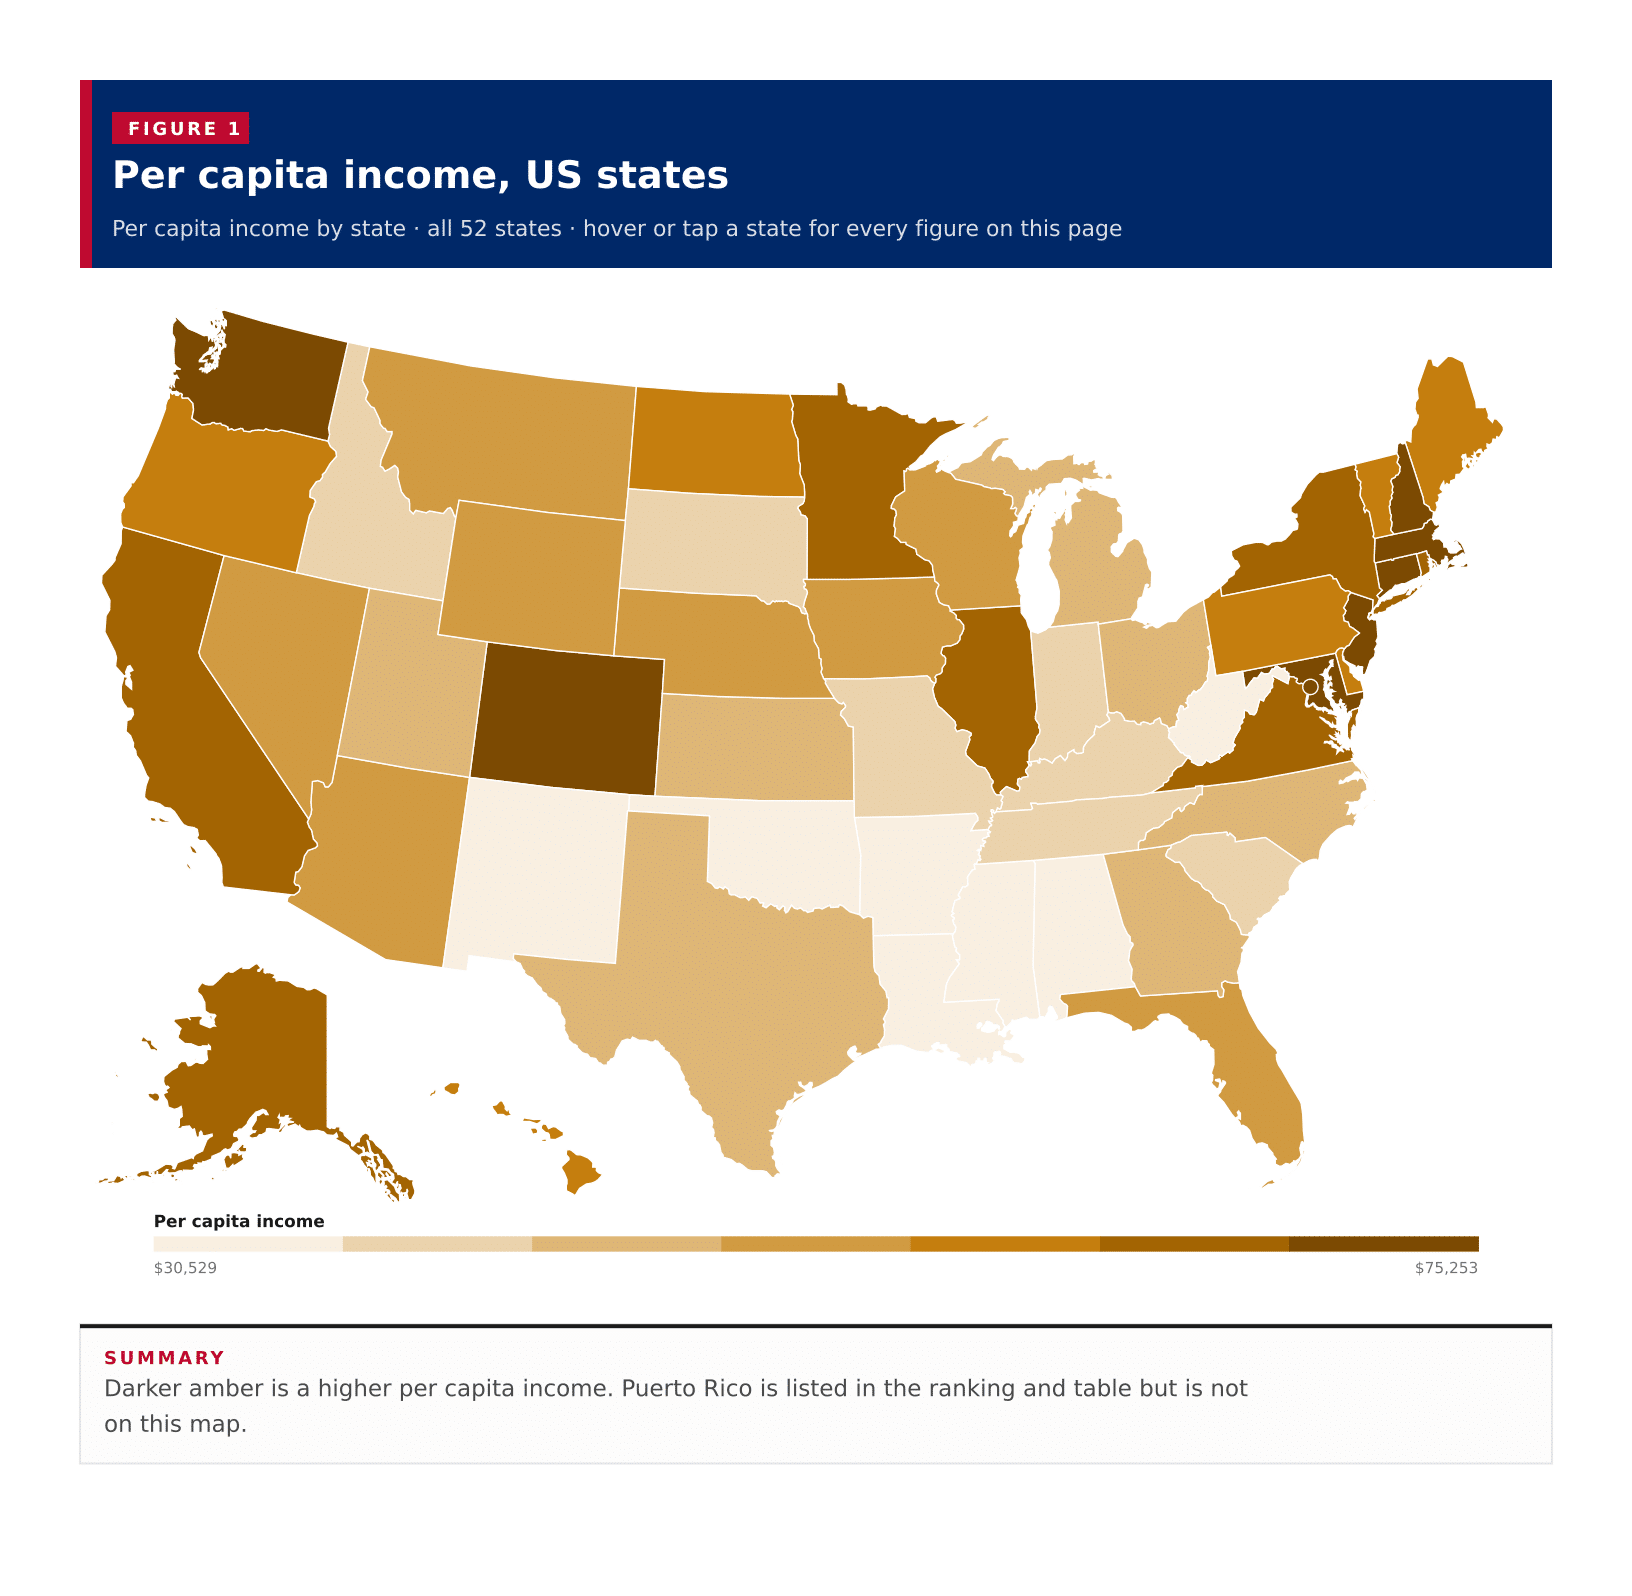
Darker amber is a higher per capita income. Puerto Rico is listed in the ranking and table but is not on this map.
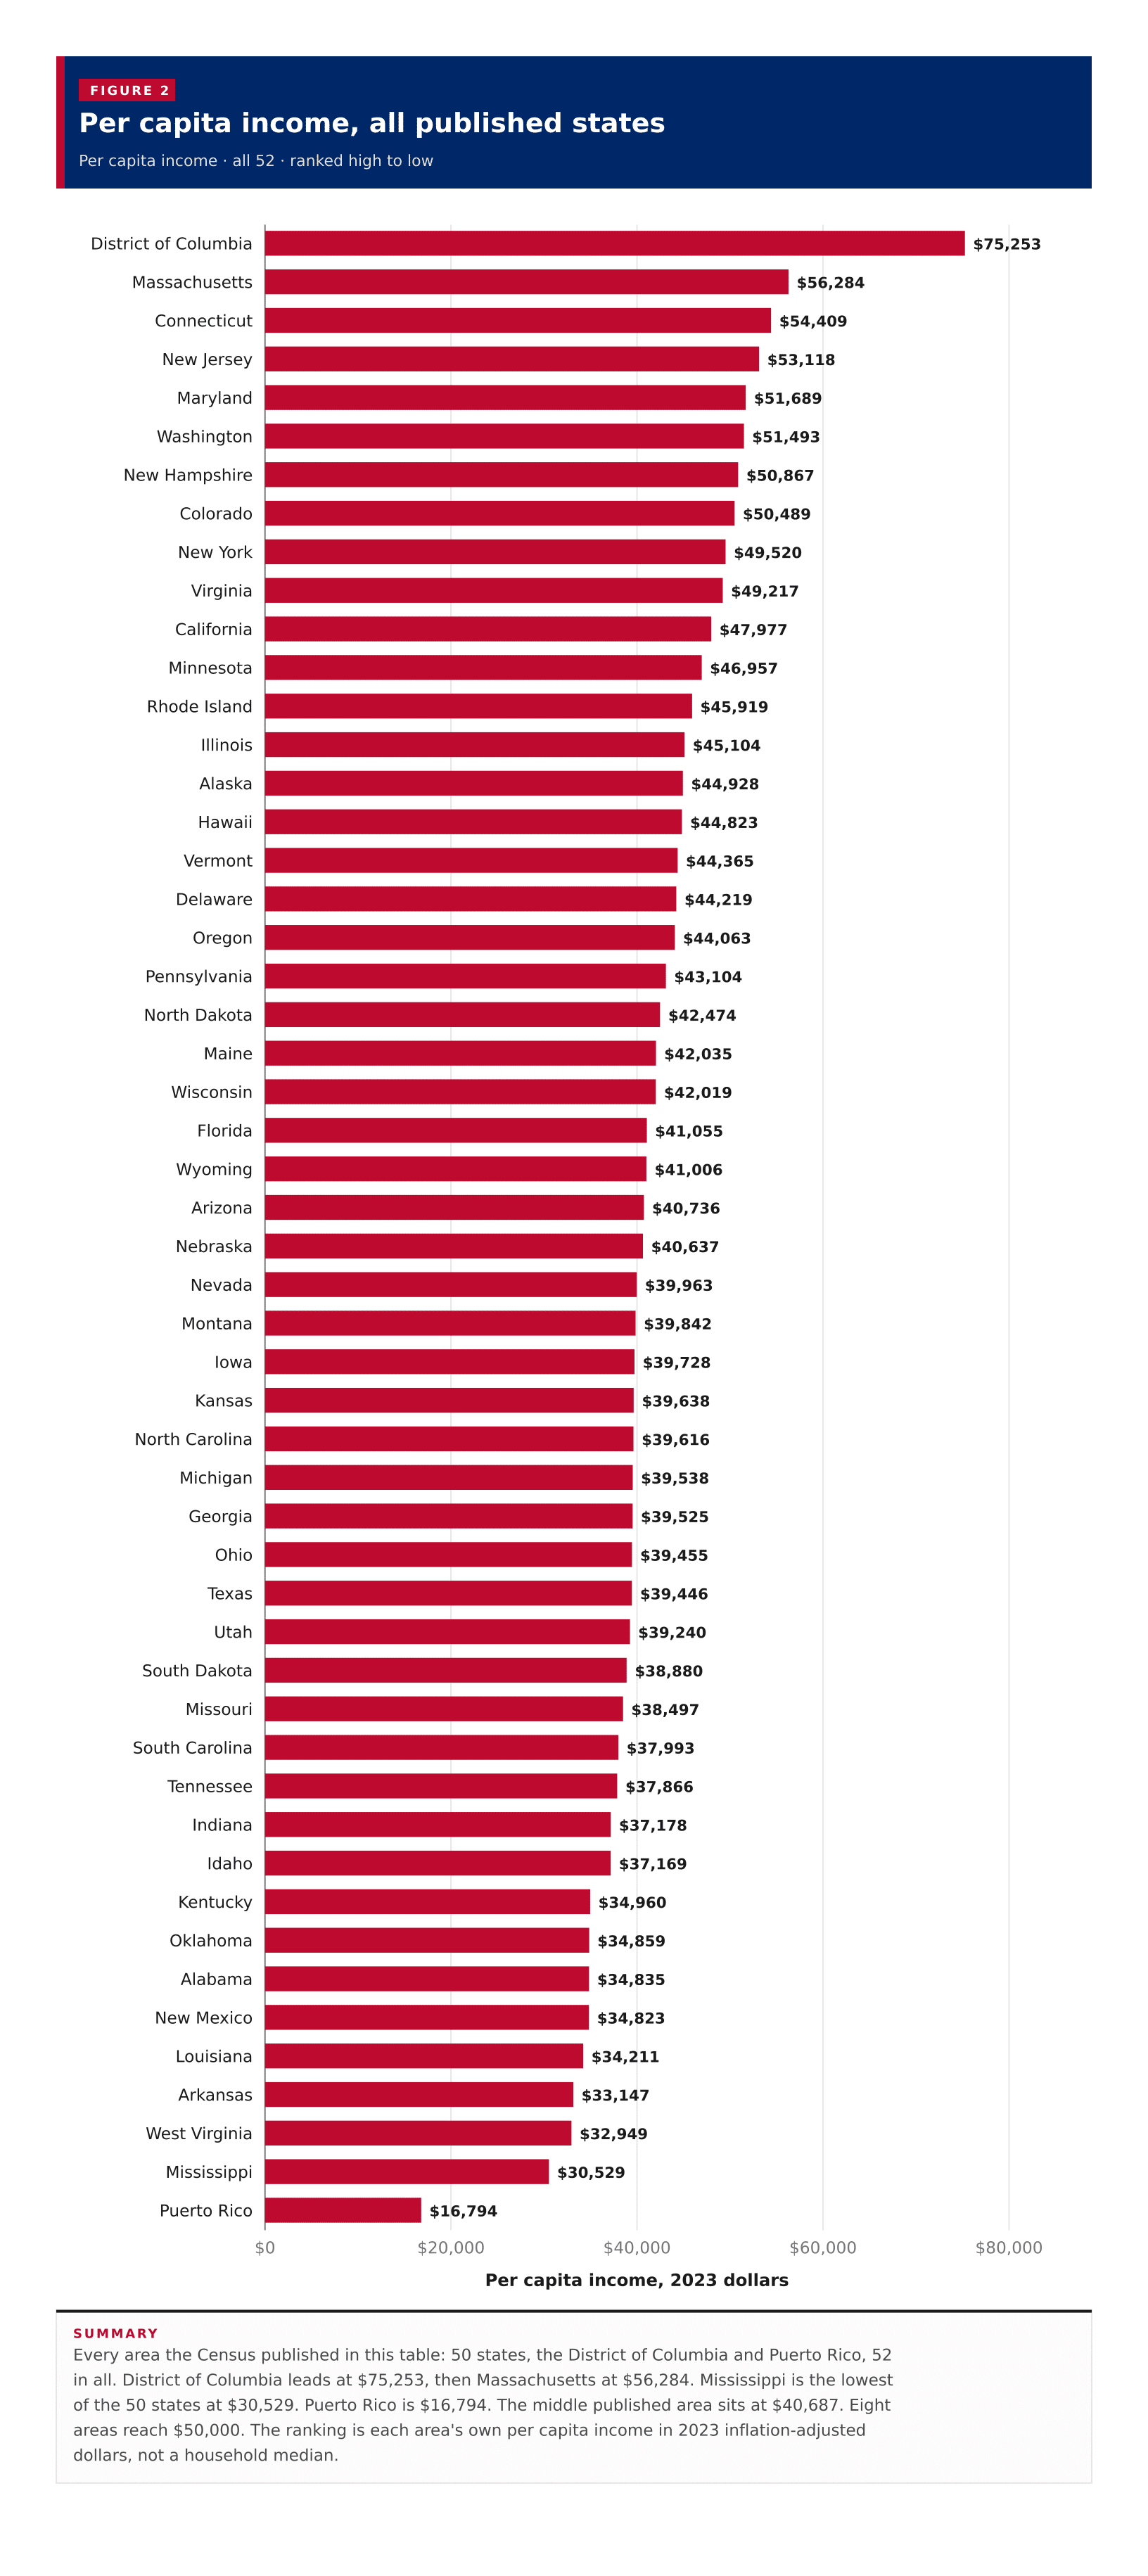
A typical published area has a per capita income of $40,687, the midpoint of the 50 states, the District of Columbia and Puerto Rico on the 2023 ACS five-year estimates. The District of Columbia leads at $75,253, well ahead of Massachusetts at $56,284. Eight areas reach $50,000. Mississippi is the lowest of the 50 states at $30,529. Puerto Rico, which this table also returns, sits far lower at $16,794. The District of Columbia is $44,724 above Mississippi and $58,459 above Puerto Rico. Per capita income is total income divided by total population, including children, so it is not a household median and these state figures cannot be averaged into a United States number.
In short
$40,687typical published areathe middle area, not an average
$75,253District of Columbiahighest per capita income
$30,529Mississippilowest of the 50 states
$16,794Puerto Ricolowest figure the Census published
8areas at or above $50,000District of Columbia, Massachusetts, Connecticut, New Jersey, Maryland, Washington, New Hampshire and Colorado
Every area the Census published in this table: 50 states, the District of Columbia and Puerto Rico, 52 in all. District of Columbia leads at $75,253, then Massachusetts at $56,284. Mississippi is the lowest of the 50 states at $30,529. Puerto Rico is $16,794. The middle published area sits at $40,687. Eight areas reach $50,000. The ranking is each area's own per capita income in 2023 inflation-adjusted dollars, not a household median.
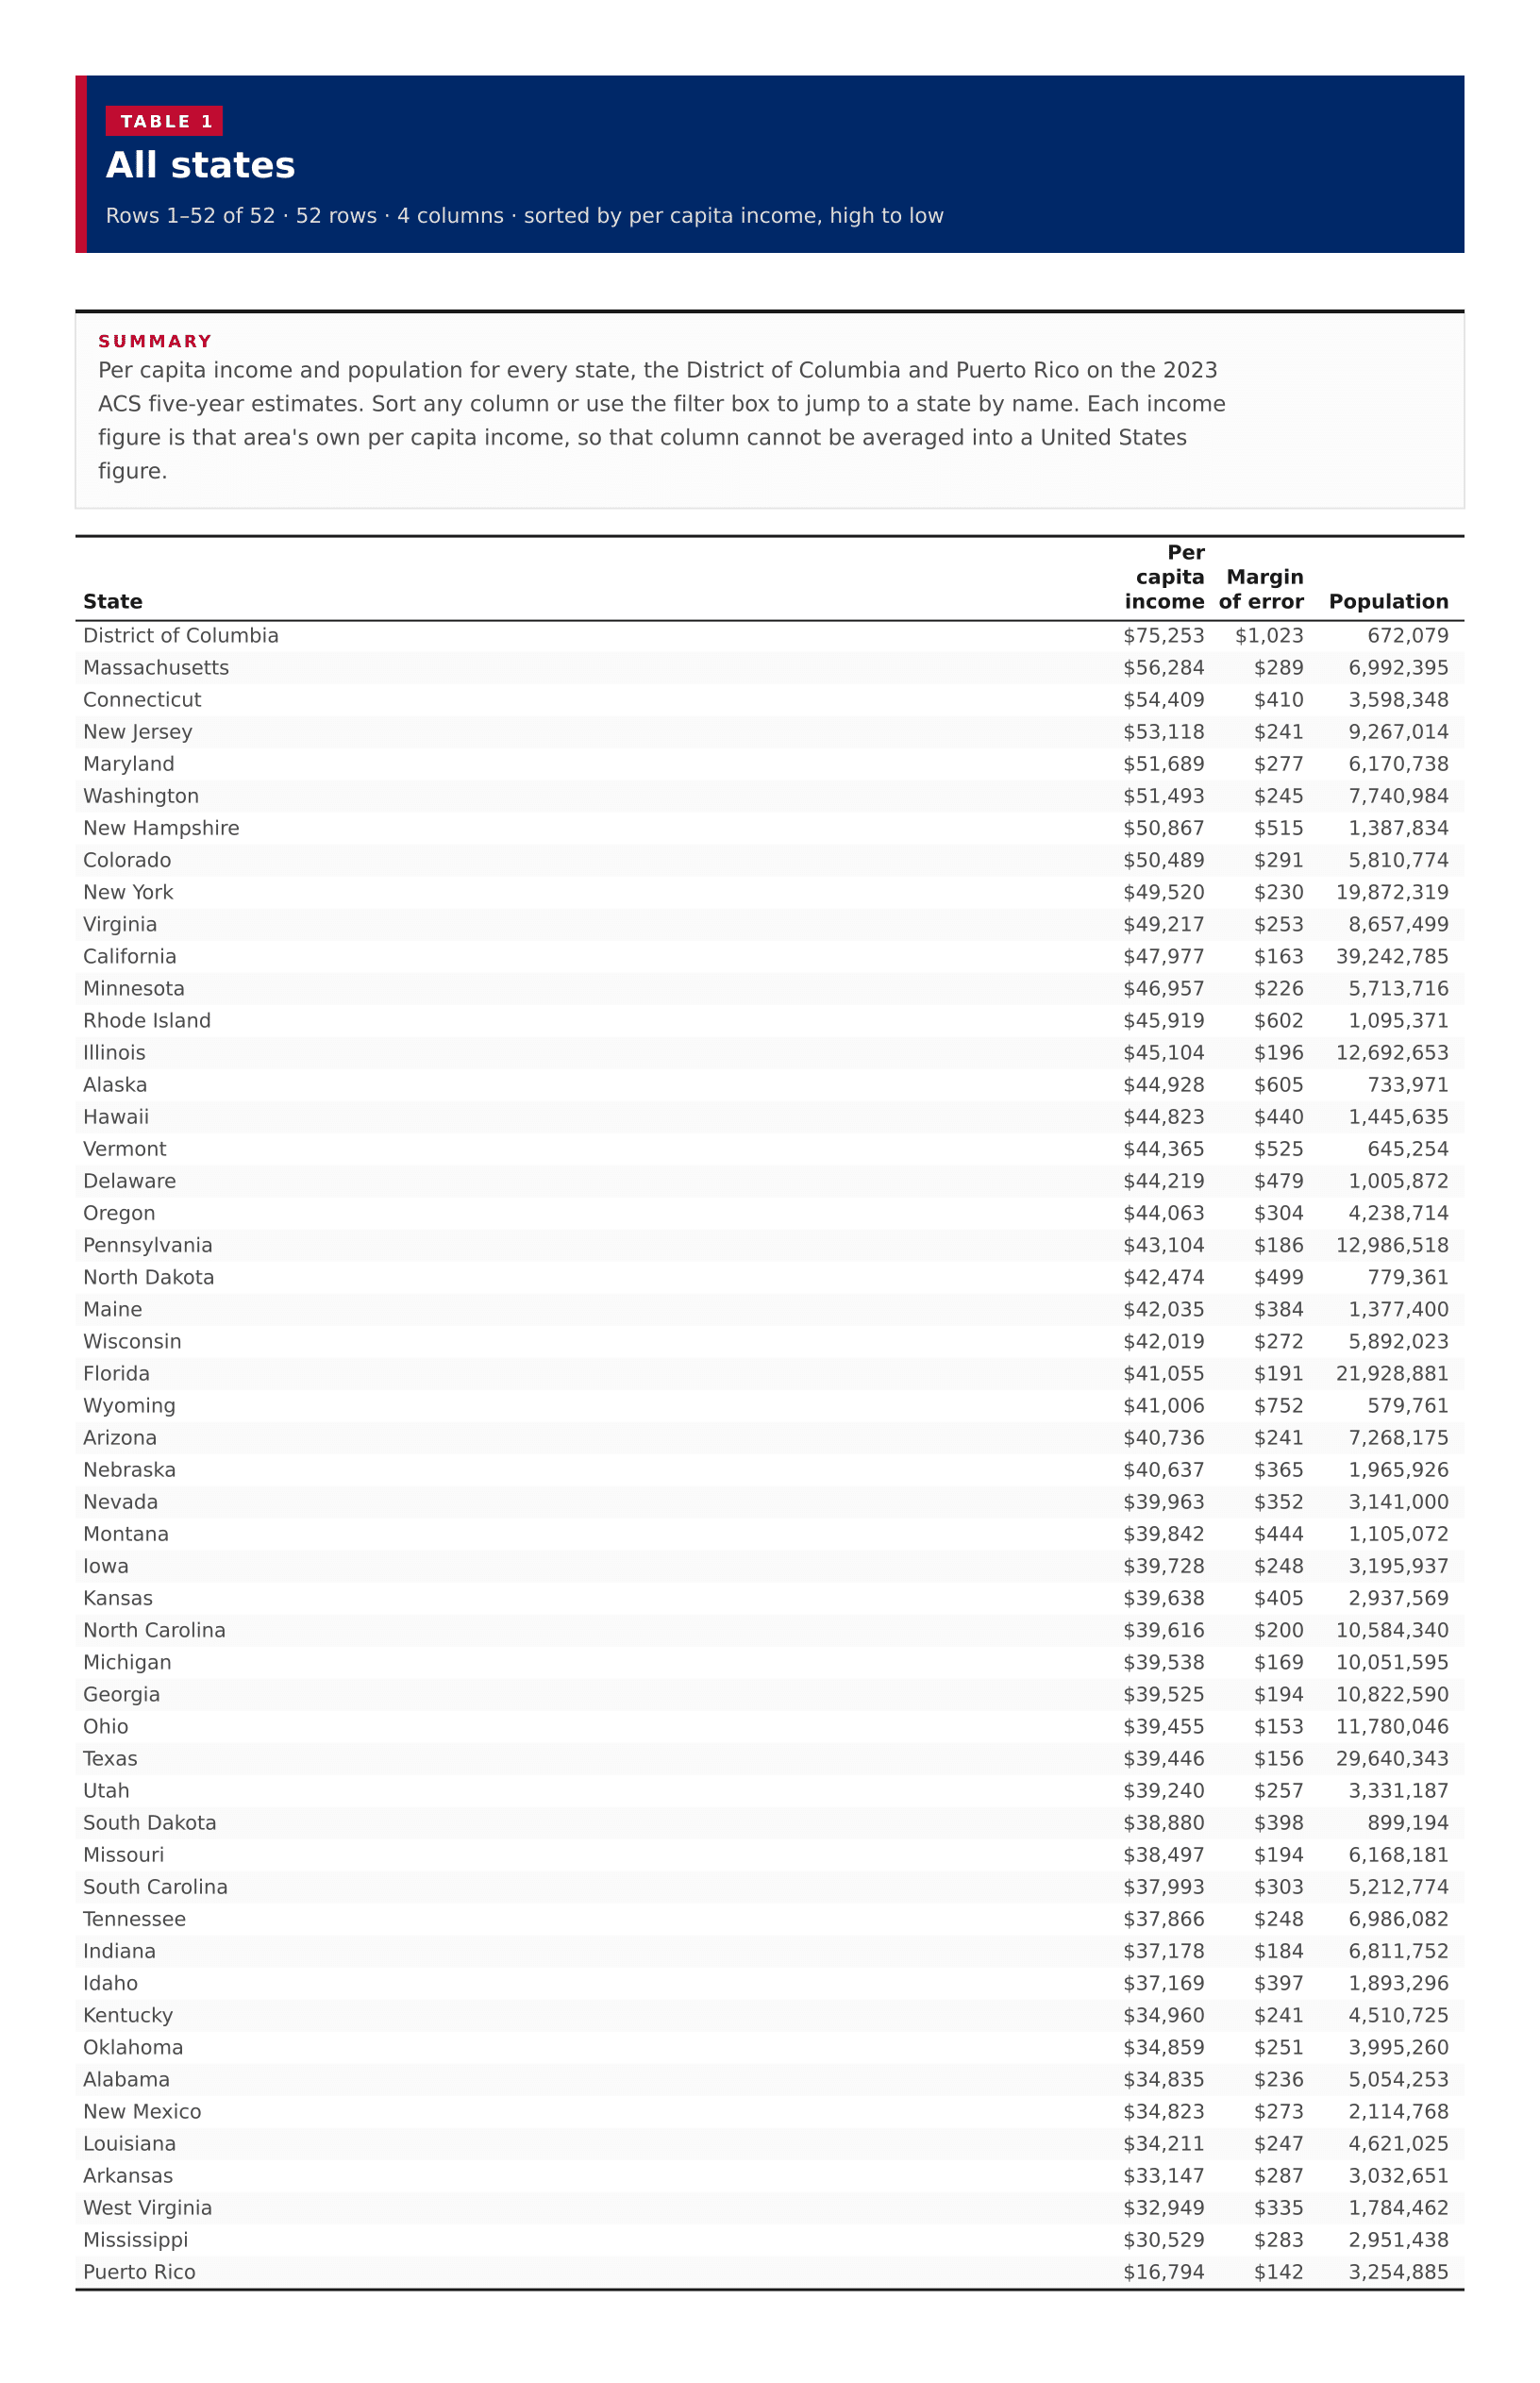
Table 1
All states
52 rows · 4 columns · sorted by per capita income, high to low
Per capita income and population for every state, the District of Columbia and Puerto Rico on the 2023 ACS five-year estimates. Sort any column or use the filter box to jump to a state by name. Each income figure is that area's own per capita income, so that column cannot be averaged into a United States figure.
Per capita income is in 2023 inflation-adjusted dollars for the past 12 months. It is aggregate income divided by total population, including children and people with no income.
A state per capita figure is that state's own mean, so these figures cannot be averaged to produce a national figure.
Per capita income is not median household income. A household median is the midpoint for households in that area; per capita spreads all income across every resident.
The Census published 50 states, the District of Columbia and Puerto Rico. None of the per capita estimates were suppressed.
Alaska and Hawaii appear in the ranking and table. On the map they are drawn as insets. Puerto Rico is listed in the ranking and table but is not on the state map.
ACS population estimates at this geography are controlled counts. Where the Census returns a sentinel margin of error, the plugin shows a dash rather than a fabricated interval.