Figure 1
Labor force participation rate, US states
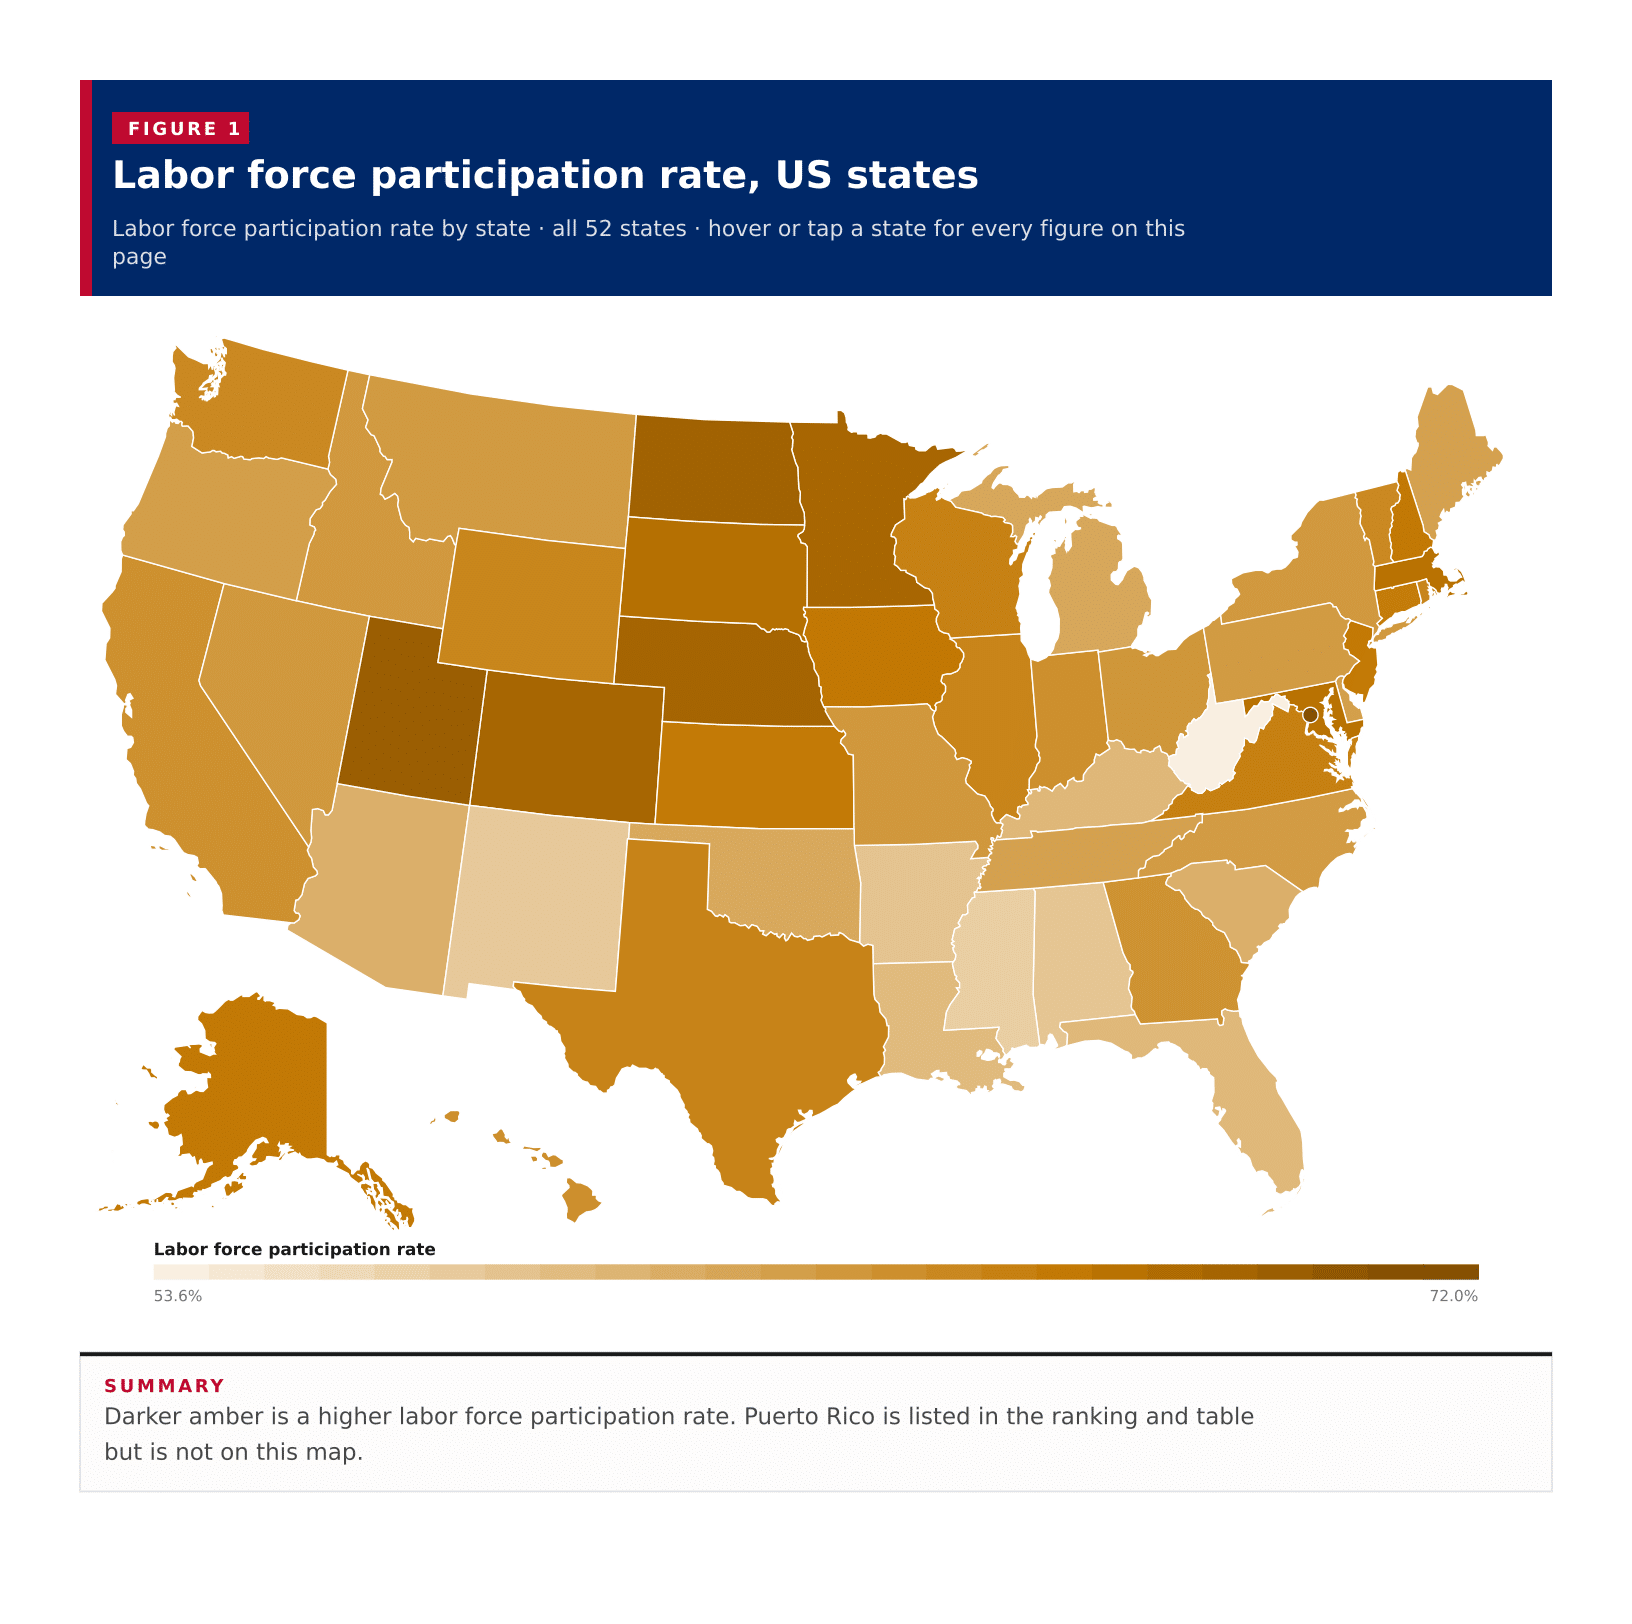
Labor force participation rate by state · all 52 states · hover or tap a state for every figure on this page
A typical published area has a labor force participation rate of 63.8 percent, the midpoint of the 50 states, the District of Columbia and Puerto Rico on the 2023 ACS five-year estimates. The District of Columbia leads at 72.0 percent, and Utah is the highest of the 50 states at 69.6 percent. West Virginia is the lowest of the 50 states at 53.6 percent. Puerto Rico, which this table also returns, sits far lower at 45.5 percent. The District of Columbia is 18.3 percentage points above West Virginia and 26.4 percentage points above Puerto Rico. These are each area's own participation rate (people in the labor force, including the Armed Forces, divided by the population 16 years and over), not a national average of states.
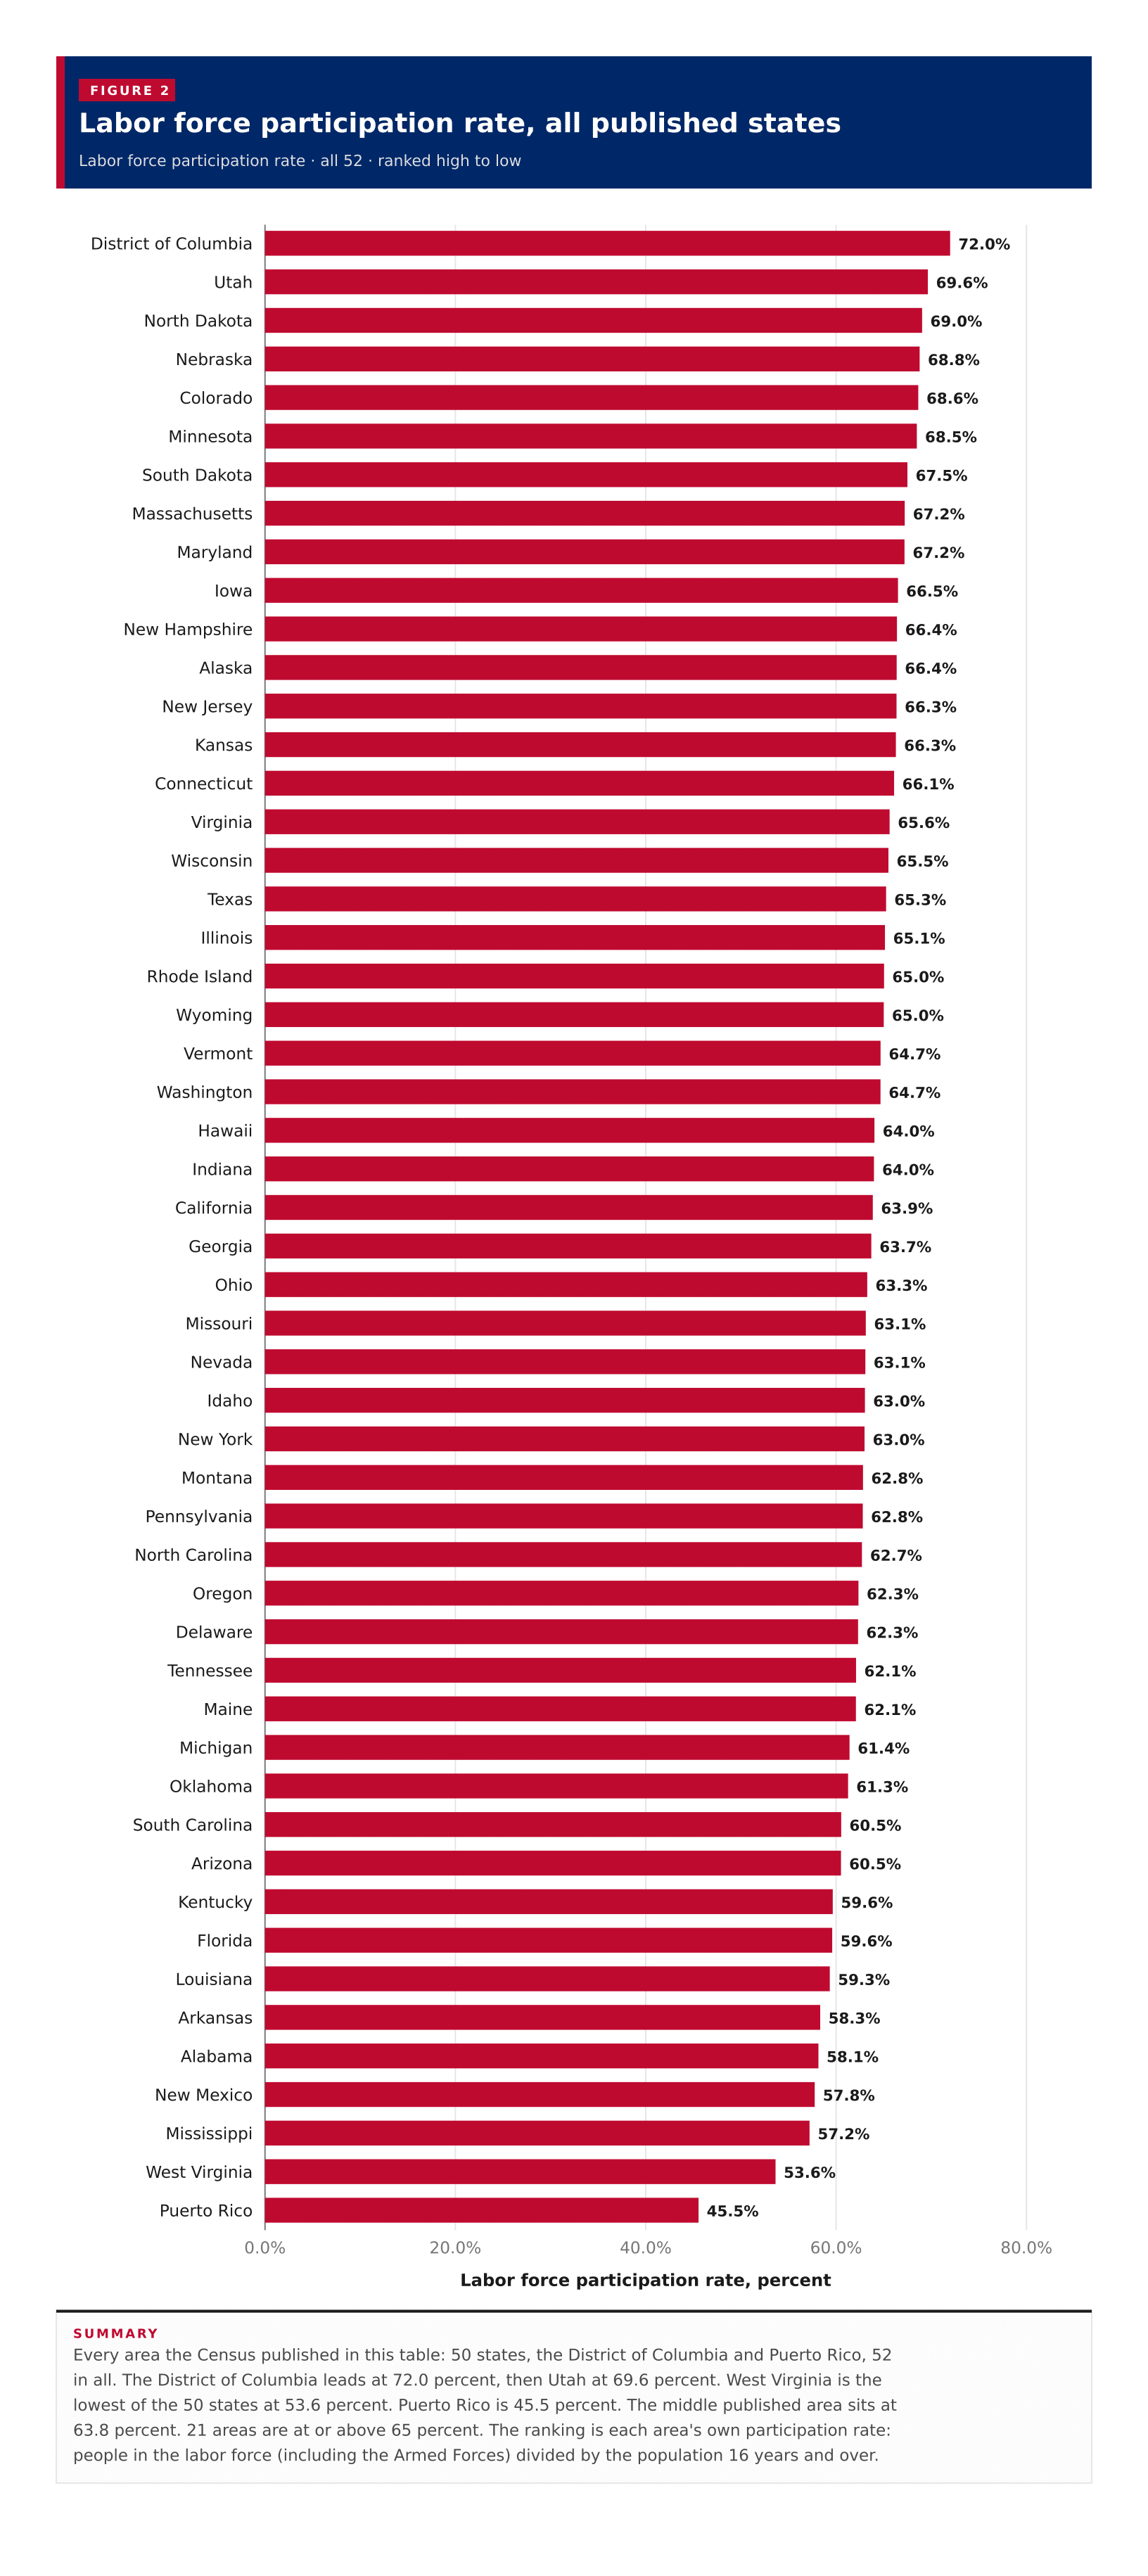
Labor force participation rate · all 52 · ranked high to low
Every area the Census published in this table: 50 states, the District of Columbia and Puerto Rico, 52 in all. The District of Columbia leads at 72.0 percent, then Utah at 69.6 percent. West Virginia is the lowest of the 50 states at 53.6 percent. Puerto Rico is 45.5 percent. The middle published area sits at 63.8 percent. 21 areas are at or above 65 percent. The ranking is each area's own participation rate: people in the labor force (including the Armed Forces) divided by the population 16 years and over.
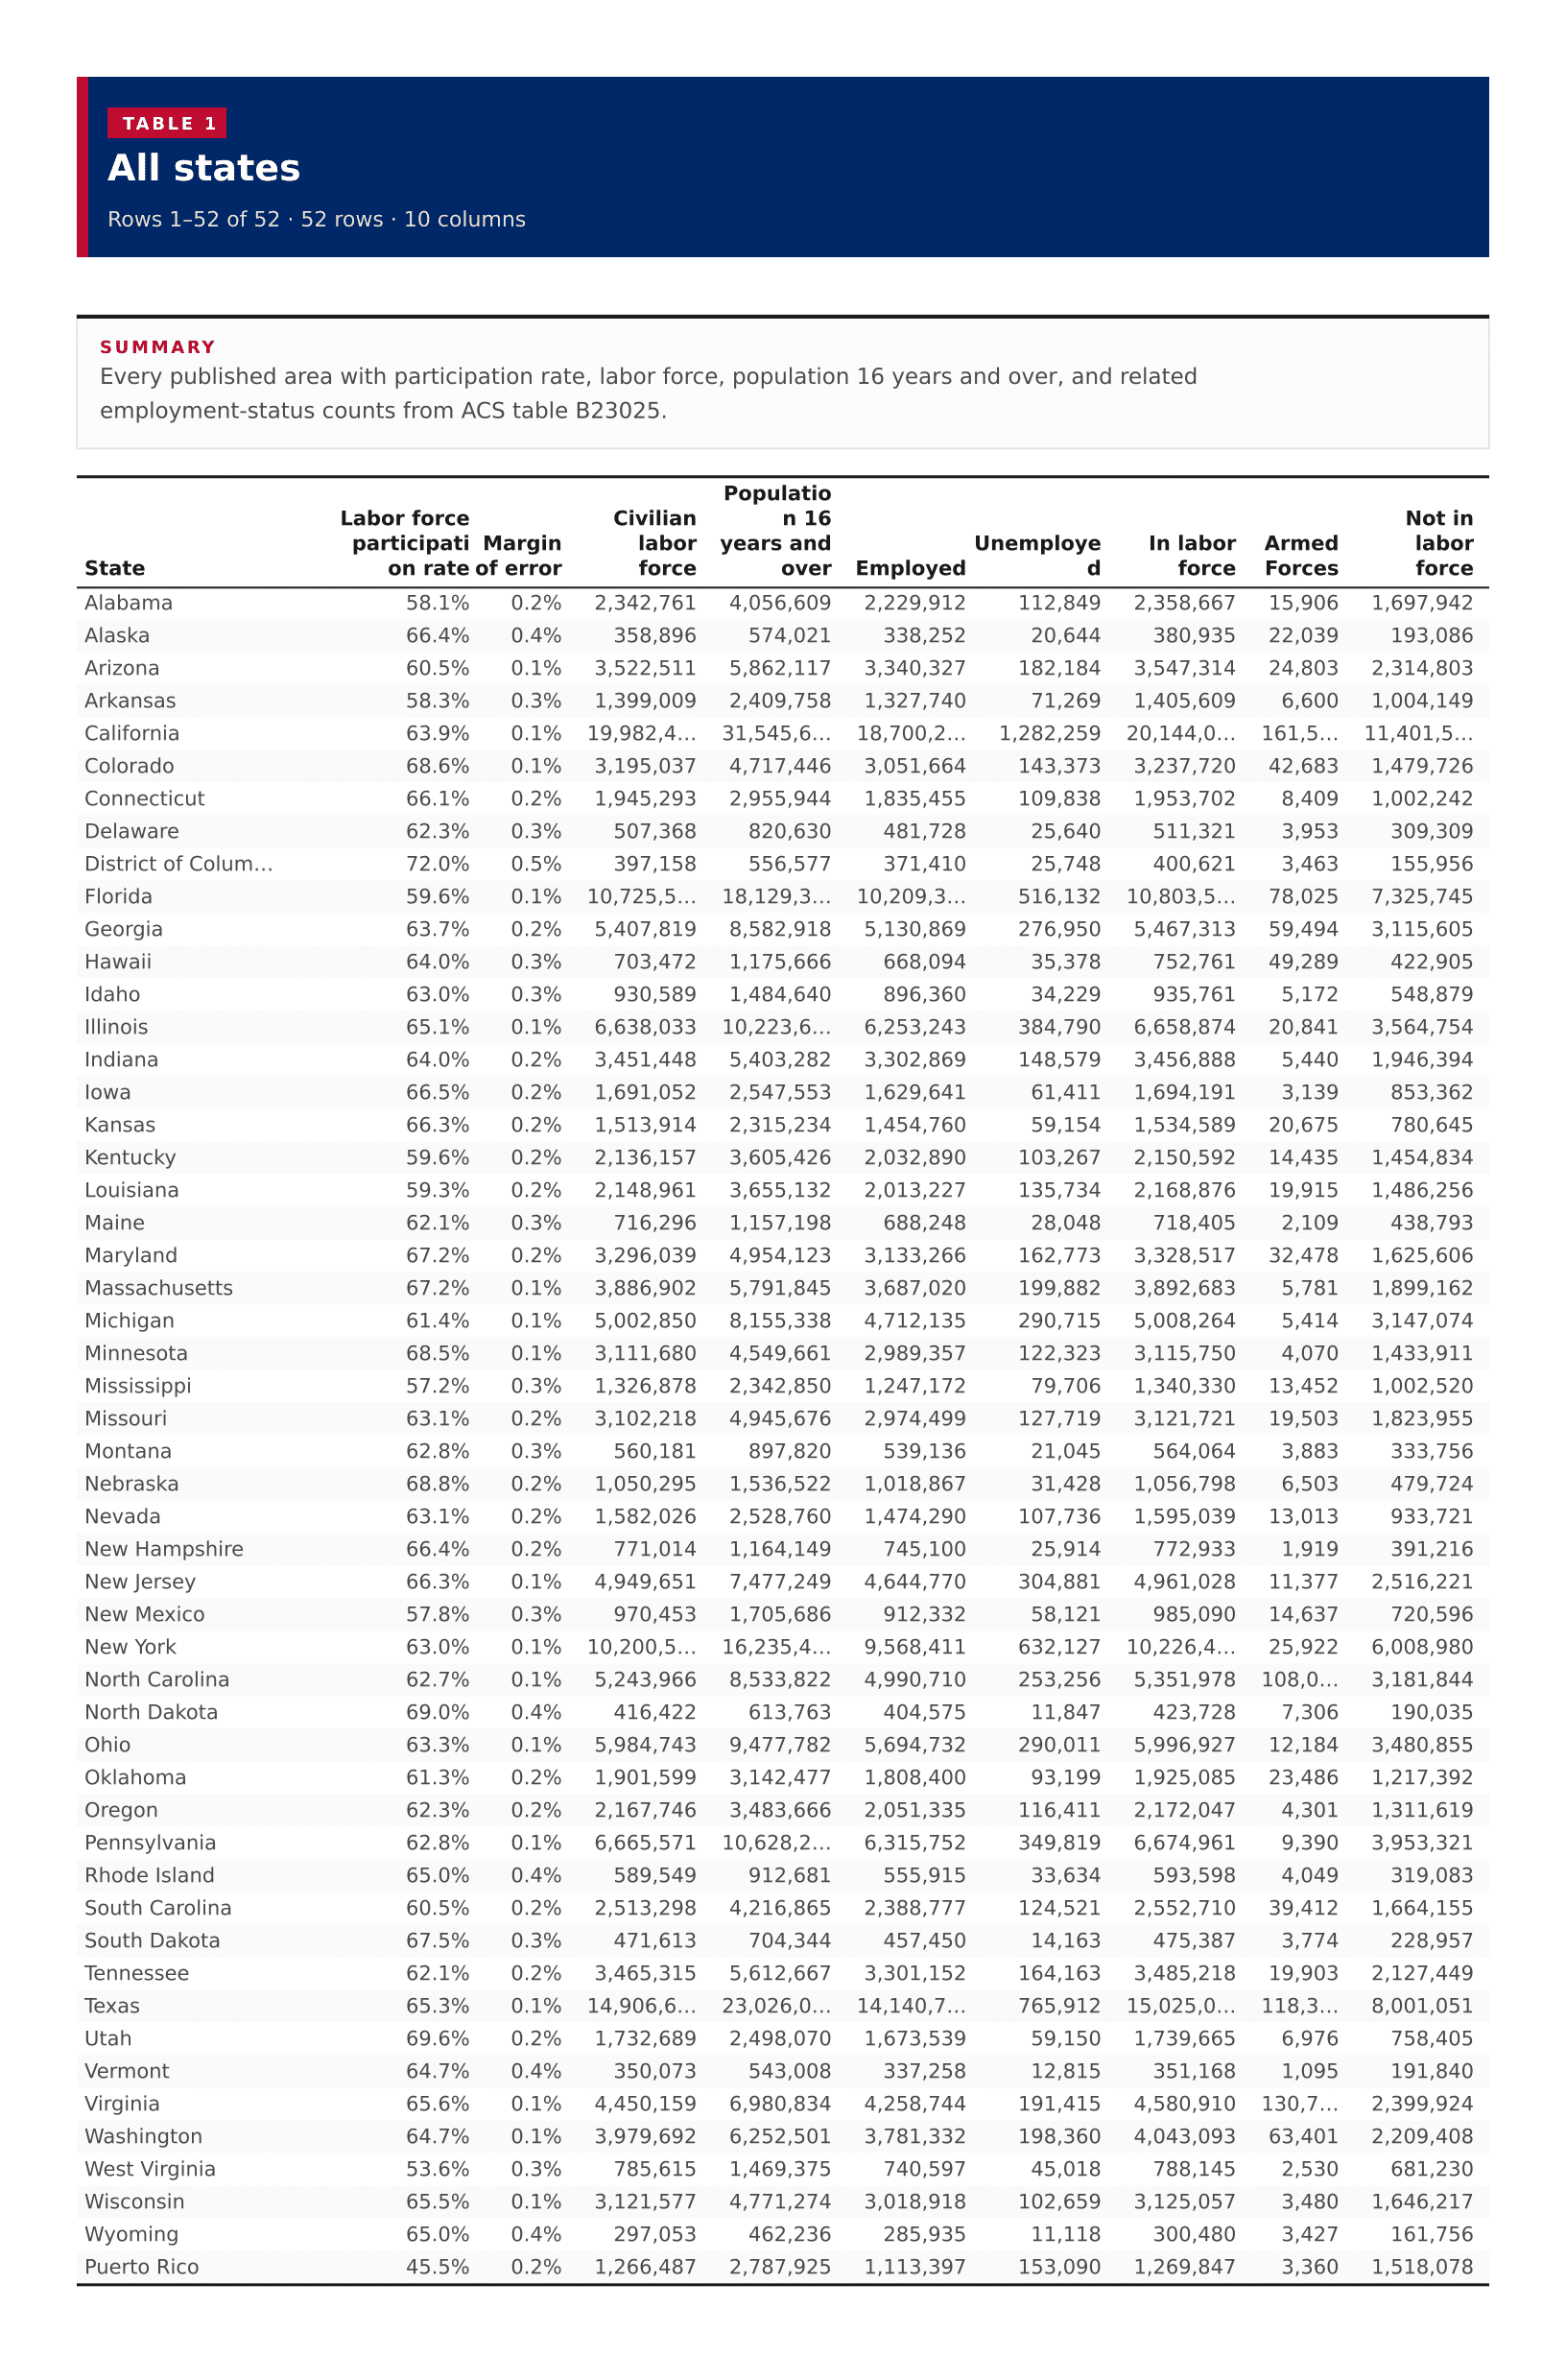
52 rows · 10 columns
Every published area with participation rate, labor force, population 16 years and over, and related employment-status counts from ACS table B23025.
| ? | ? | ||||||||
|---|---|---|---|---|---|---|---|---|---|
| Alabama | 58.1% | 0.2% | 2,342,761 | 4,056,609 | 2,229,912 | 112,849 | 2,358,667 | 15,906 | 1,697,942 |
| Alaska | 66.4% | 0.4% | 358,896 | 574,021 | 338,252 | 20,644 | 380,935 | 22,039 | 193,086 |
| Arizona | 60.5% | 0.1% | 3,522,511 | 5,862,117 | 3,340,327 | 182,184 | 3,547,314 | 24,803 | 2,314,803 |
| Arkansas | 58.3% | 0.3% | 1,399,009 | 2,409,758 | 1,327,740 | 71,269 | 1,405,609 | 6,600 | 1,004,149 |
| California | 63.9% | 0.1% | 19,982,482 | 31,545,603 | 18,700,223 | 1,282,259 | 20,144,078 | 161,596 | 11,401,525 |
| Colorado | 68.6% | 0.1% | 3,195,037 | 4,717,446 | 3,051,664 | 143,373 | 3,237,720 | 42,683 | 1,479,726 |
| Connecticut | 66.1% | 0.2% | 1,945,293 | 2,955,944 | 1,835,455 | 109,838 | 1,953,702 | 8,409 | 1,002,242 |
| Delaware | 62.3% | 0.3% | 507,368 | 820,630 | 481,728 | 25,640 | 511,321 | 3,953 | 309,309 |
| District of Columbia | 72.0% | 0.5% | 397,158 | 556,577 | 371,410 | 25,748 | 400,621 | 3,463 | 155,956 |
| Florida | 59.6% | 0.1% | 10,725,531 | 18,129,301 | 10,209,399 | 516,132 | 10,803,556 | 78,025 | 7,325,745 |
| Georgia | 63.7% | 0.2% | 5,407,819 | 8,582,918 | 5,130,869 | 276,950 | 5,467,313 | 59,494 | 3,115,605 |
| Hawaii | 64.0% | 0.3% | 703,472 | 1,175,666 | 668,094 | 35,378 | 752,761 | 49,289 | 422,905 |
| Idaho | 63.0% | 0.3% | 930,589 | 1,484,640 | 896,360 | 34,229 | 935,761 | 5,172 | 548,879 |
| Illinois | 65.1% | 0.1% | 6,638,033 | 10,223,628 | 6,253,243 | 384,790 | 6,658,874 | 20,841 | 3,564,754 |
| Indiana | 64.0% | 0.2% | 3,451,448 | 5,403,282 | 3,302,869 | 148,579 | 3,456,888 | 5,440 | 1,946,394 |
| Iowa | 66.5% | 0.2% | 1,691,052 | 2,547,553 | 1,629,641 | 61,411 | 1,694,191 | 3,139 | 853,362 |
| Kansas | 66.3% | 0.2% | 1,513,914 | 2,315,234 | 1,454,760 | 59,154 | 1,534,589 | 20,675 | 780,645 |
| Kentucky | 59.6% | 0.2% | 2,136,157 | 3,605,426 | 2,032,890 | 103,267 | 2,150,592 | 14,435 | 1,454,834 |
| Louisiana | 59.3% | 0.2% | 2,148,961 | 3,655,132 | 2,013,227 | 135,734 | 2,168,876 | 19,915 | 1,486,256 |
| Maine | 62.1% | 0.3% | 716,296 | 1,157,198 | 688,248 | 28,048 | 718,405 | 2,109 | 438,793 |
| Maryland | 67.2% | 0.2% | 3,296,039 | 4,954,123 | 3,133,266 | 162,773 | 3,328,517 | 32,478 | 1,625,606 |
| Massachusetts | 67.2% | 0.1% | 3,886,902 | 5,791,845 | 3,687,020 | 199,882 | 3,892,683 | 5,781 | 1,899,162 |
| Michigan | 61.4% | 0.1% | 5,002,850 | 8,155,338 | 4,712,135 | 290,715 | 5,008,264 | 5,414 | 3,147,074 |
| Minnesota | 68.5% | 0.1% | 3,111,680 | 4,549,661 | 2,989,357 | 122,323 | 3,115,750 | 4,070 | 1,433,911 |
| Mississippi | 57.2% | 0.3% | 1,326,878 | 2,342,850 | 1,247,172 | 79,706 | 1,340,330 | 13,452 | 1,002,520 |
| Missouri | 63.1% | 0.2% | 3,102,218 | 4,945,676 | 2,974,499 | 127,719 | 3,121,721 | 19,503 | 1,823,955 |
| Montana | 62.8% | 0.3% | 560,181 | 897,820 | 539,136 | 21,045 | 564,064 | 3,883 | 333,756 |
| Nebraska | 68.8% | 0.2% | 1,050,295 | 1,536,522 | 1,018,867 | 31,428 | 1,056,798 | 6,503 | 479,724 |
| Nevada | 63.1% | 0.2% | 1,582,026 | 2,528,760 | 1,474,290 | 107,736 | 1,595,039 | 13,013 | 933,721 |
| New Hampshire | 66.4% | 0.2% | 771,014 | 1,164,149 | 745,100 | 25,914 | 772,933 | 1,919 | 391,216 |
| New Jersey | 66.3% | 0.1% | 4,949,651 | 7,477,249 | 4,644,770 | 304,881 | 4,961,028 | 11,377 | 2,516,221 |
| New Mexico | 57.8% | 0.3% | 970,453 | 1,705,686 | 912,332 | 58,121 | 985,090 | 14,637 | 720,596 |
| New York | 63.0% | 0.1% | 10,200,538 | 16,235,440 | 9,568,411 | 632,127 | 10,226,460 | 25,922 | 6,008,980 |
| North Carolina | 62.7% | 0.1% | 5,243,966 | 8,533,822 | 4,990,710 | 253,256 | 5,351,978 | 108,012 | 3,181,844 |
| North Dakota | 69.0% | 0.4% | 416,422 | 613,763 | 404,575 | 11,847 | 423,728 | 7,306 | 190,035 |
| Ohio | 63.3% | 0.1% | 5,984,743 | 9,477,782 | 5,694,732 | 290,011 | 5,996,927 | 12,184 | 3,480,855 |
| Oklahoma | 61.3% | 0.2% | 1,901,599 | 3,142,477 | 1,808,400 | 93,199 | 1,925,085 | 23,486 | 1,217,392 |
| Oregon | 62.3% | 0.2% | 2,167,746 | 3,483,666 | 2,051,335 | 116,411 | 2,172,047 | 4,301 | 1,311,619 |
| Pennsylvania | 62.8% | 0.1% | 6,665,571 | 10,628,282 | 6,315,752 | 349,819 | 6,674,961 | 9,390 | 3,953,321 |
| Rhode Island | 65.0% | 0.4% | 589,549 | 912,681 | 555,915 | 33,634 | 593,598 | 4,049 | 319,083 |
| South Carolina | 60.5% | 0.2% | 2,513,298 | 4,216,865 | 2,388,777 | 124,521 | 2,552,710 | 39,412 | 1,664,155 |
| South Dakota | 67.5% | 0.3% | 471,613 | 704,344 | 457,450 | 14,163 | 475,387 | 3,774 | 228,957 |
| Tennessee | 62.1% | 0.2% | 3,465,315 | 5,612,667 | 3,301,152 | 164,163 | 3,485,218 | 19,903 | 2,127,449 |
| Texas | 65.3% | 0.1% | 14,906,660 | 23,026,070 | 14,140,748 | 765,912 | 15,025,019 | 118,359 | 8,001,051 |
| Utah | 69.6% | 0.2% | 1,732,689 | 2,498,070 | 1,673,539 | 59,150 | 1,739,665 | 6,976 | 758,405 |
| Vermont | 64.7% | 0.4% | 350,073 | 543,008 | 337,258 | 12,815 | 351,168 | 1,095 | 191,840 |
| Virginia | 65.6% | 0.1% | 4,450,159 | 6,980,834 | 4,258,744 | 191,415 | 4,580,910 | 130,751 | 2,399,924 |
| Washington | 64.7% | 0.1% | 3,979,692 | 6,252,501 | 3,781,332 | 198,360 | 4,043,093 | 63,401 | 2,209,408 |
| West Virginia | 53.6% | 0.3% | 785,615 | 1,469,375 | 740,597 | 45,018 | 788,145 | 2,530 | 681,230 |
| Wisconsin | 65.5% | 0.1% | 3,121,577 | 4,771,274 | 3,018,918 | 102,659 | 3,125,057 | 3,480 | 1,646,217 |
| Wyoming | 65.0% | 0.4% | 297,053 | 462,236 | 285,935 | 11,118 | 300,480 | 3,427 | 161,756 |
| Puerto Rico | 45.5% | 0.2% | 1,266,487 | 2,787,925 | 1,113,397 | 153,090 | 1,269,847 | 3,360 | 1,518,078 |