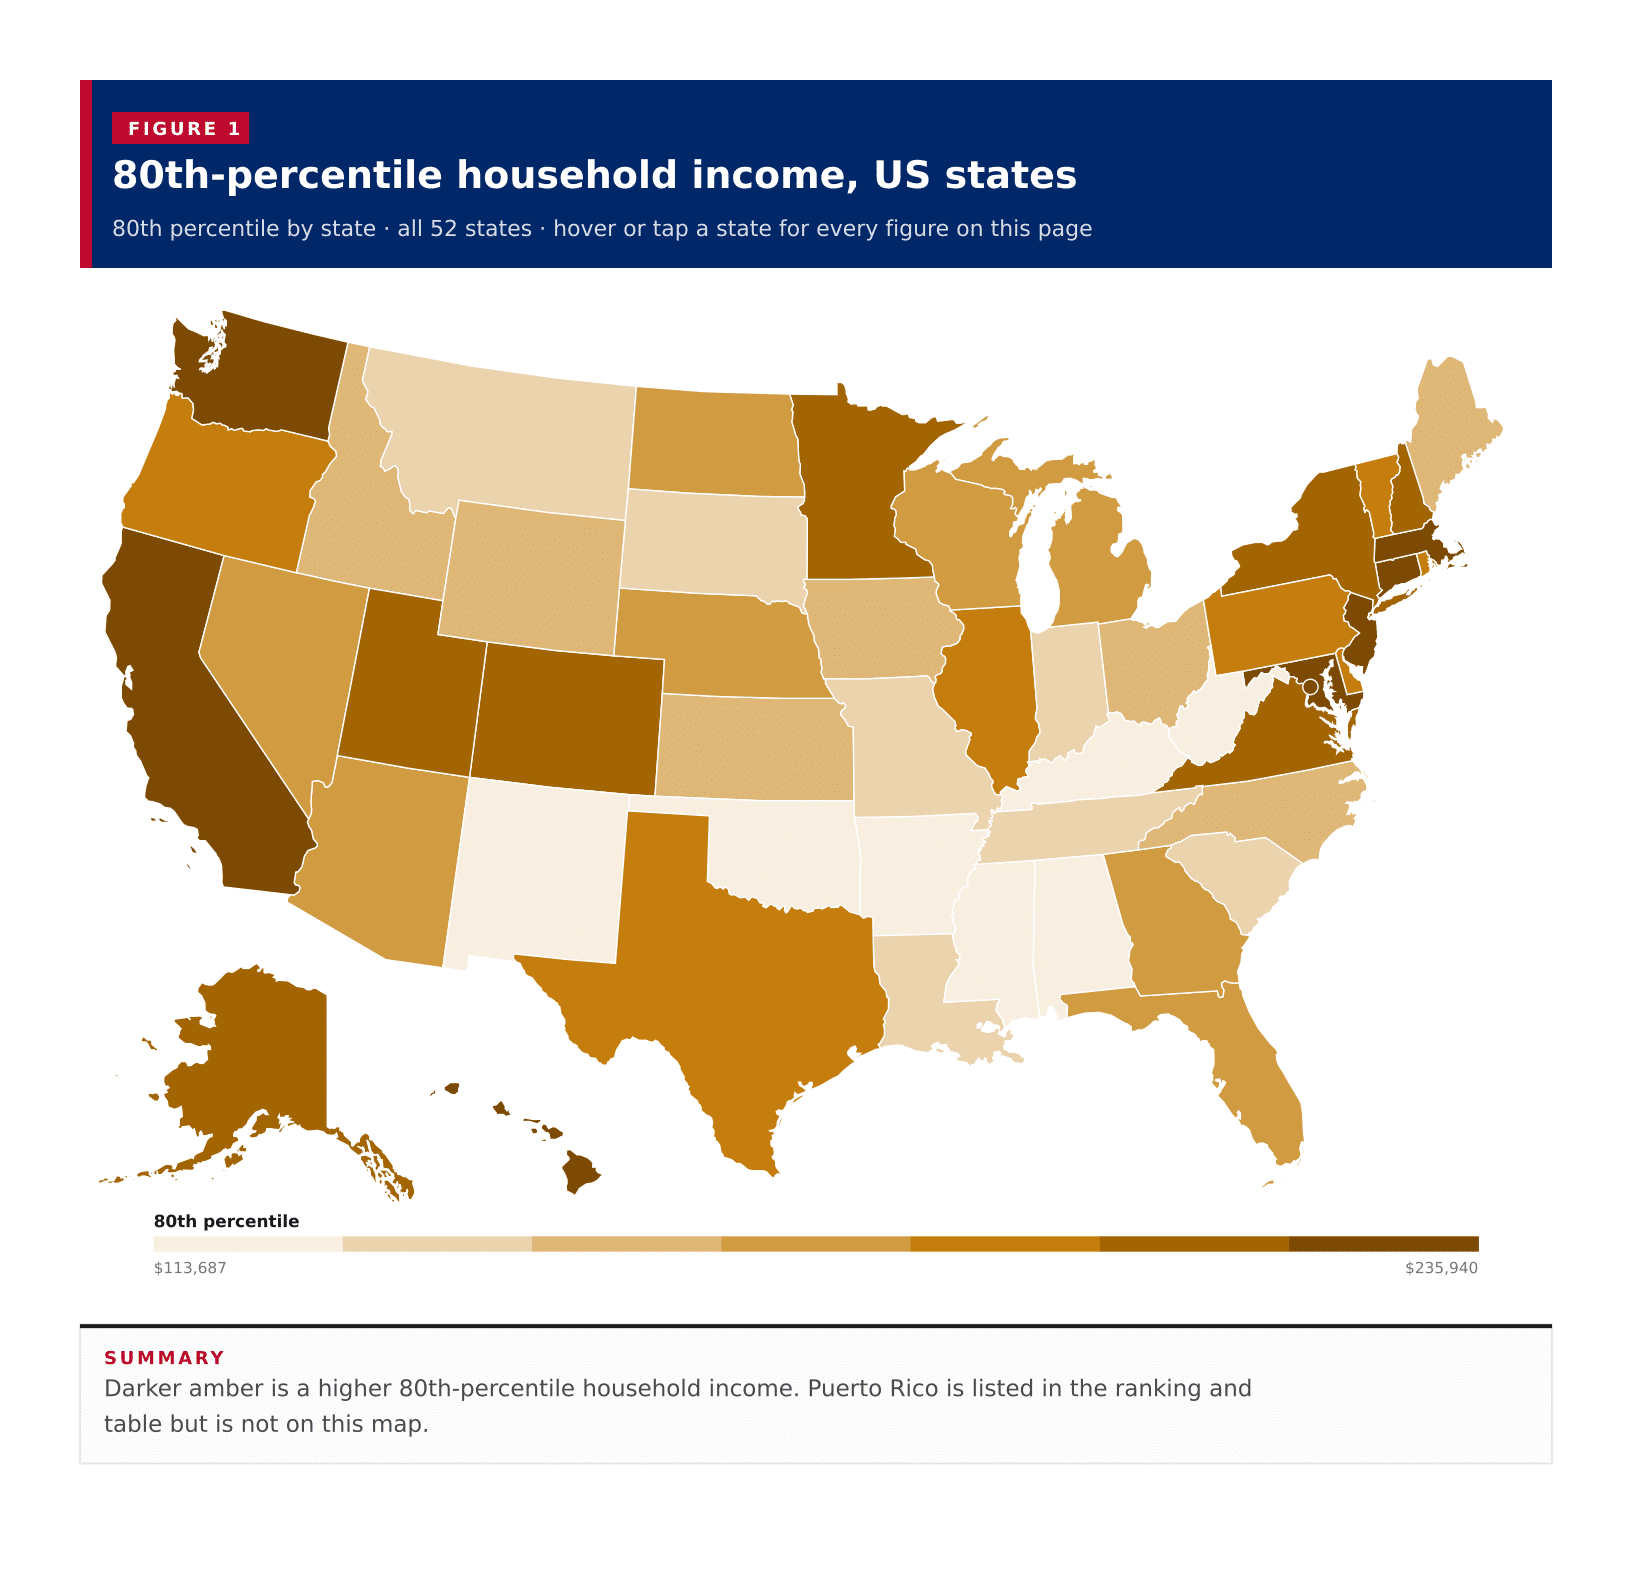
Darker amber is a higher 80th-percentile household income. Puerto Rico is listed in the ranking and table but is not on this map.
A typical published area has an 80th-percentile household income of $142,775, the midpoint of the 50 states, the District of Columbia and Puerto Rico on the 2023 ACS five-year estimates. That cutoff is the upper limit of the fourth quintile: four in five households in that area earned less. The District of Columbia leads at $235,940, and Massachusetts and New Jersey also clear $200,000. Mississippi is the lowest of the 50 states at $113,687. Puerto Rico, which this table also returns, sits far lower at $58,061. The District of Columbia is $122,253 above Mississippi and $177,879 above Puerto Rico. These are published quintile limits for each area in 2023 inflation-adjusted dollars, not a national income percentile for people.
In short
$142,775typical published areathe middle area, not an average
$235,940District of Columbiahighest 80th-percentile household income
$113,687Mississippilowest of the 50 states
$58,061Puerto Ricolowest figure the Census published
3areas at or above $200,000District of Columbia, Massachusetts and New Jersey
Figure 1
80th-percentile household income, all published states
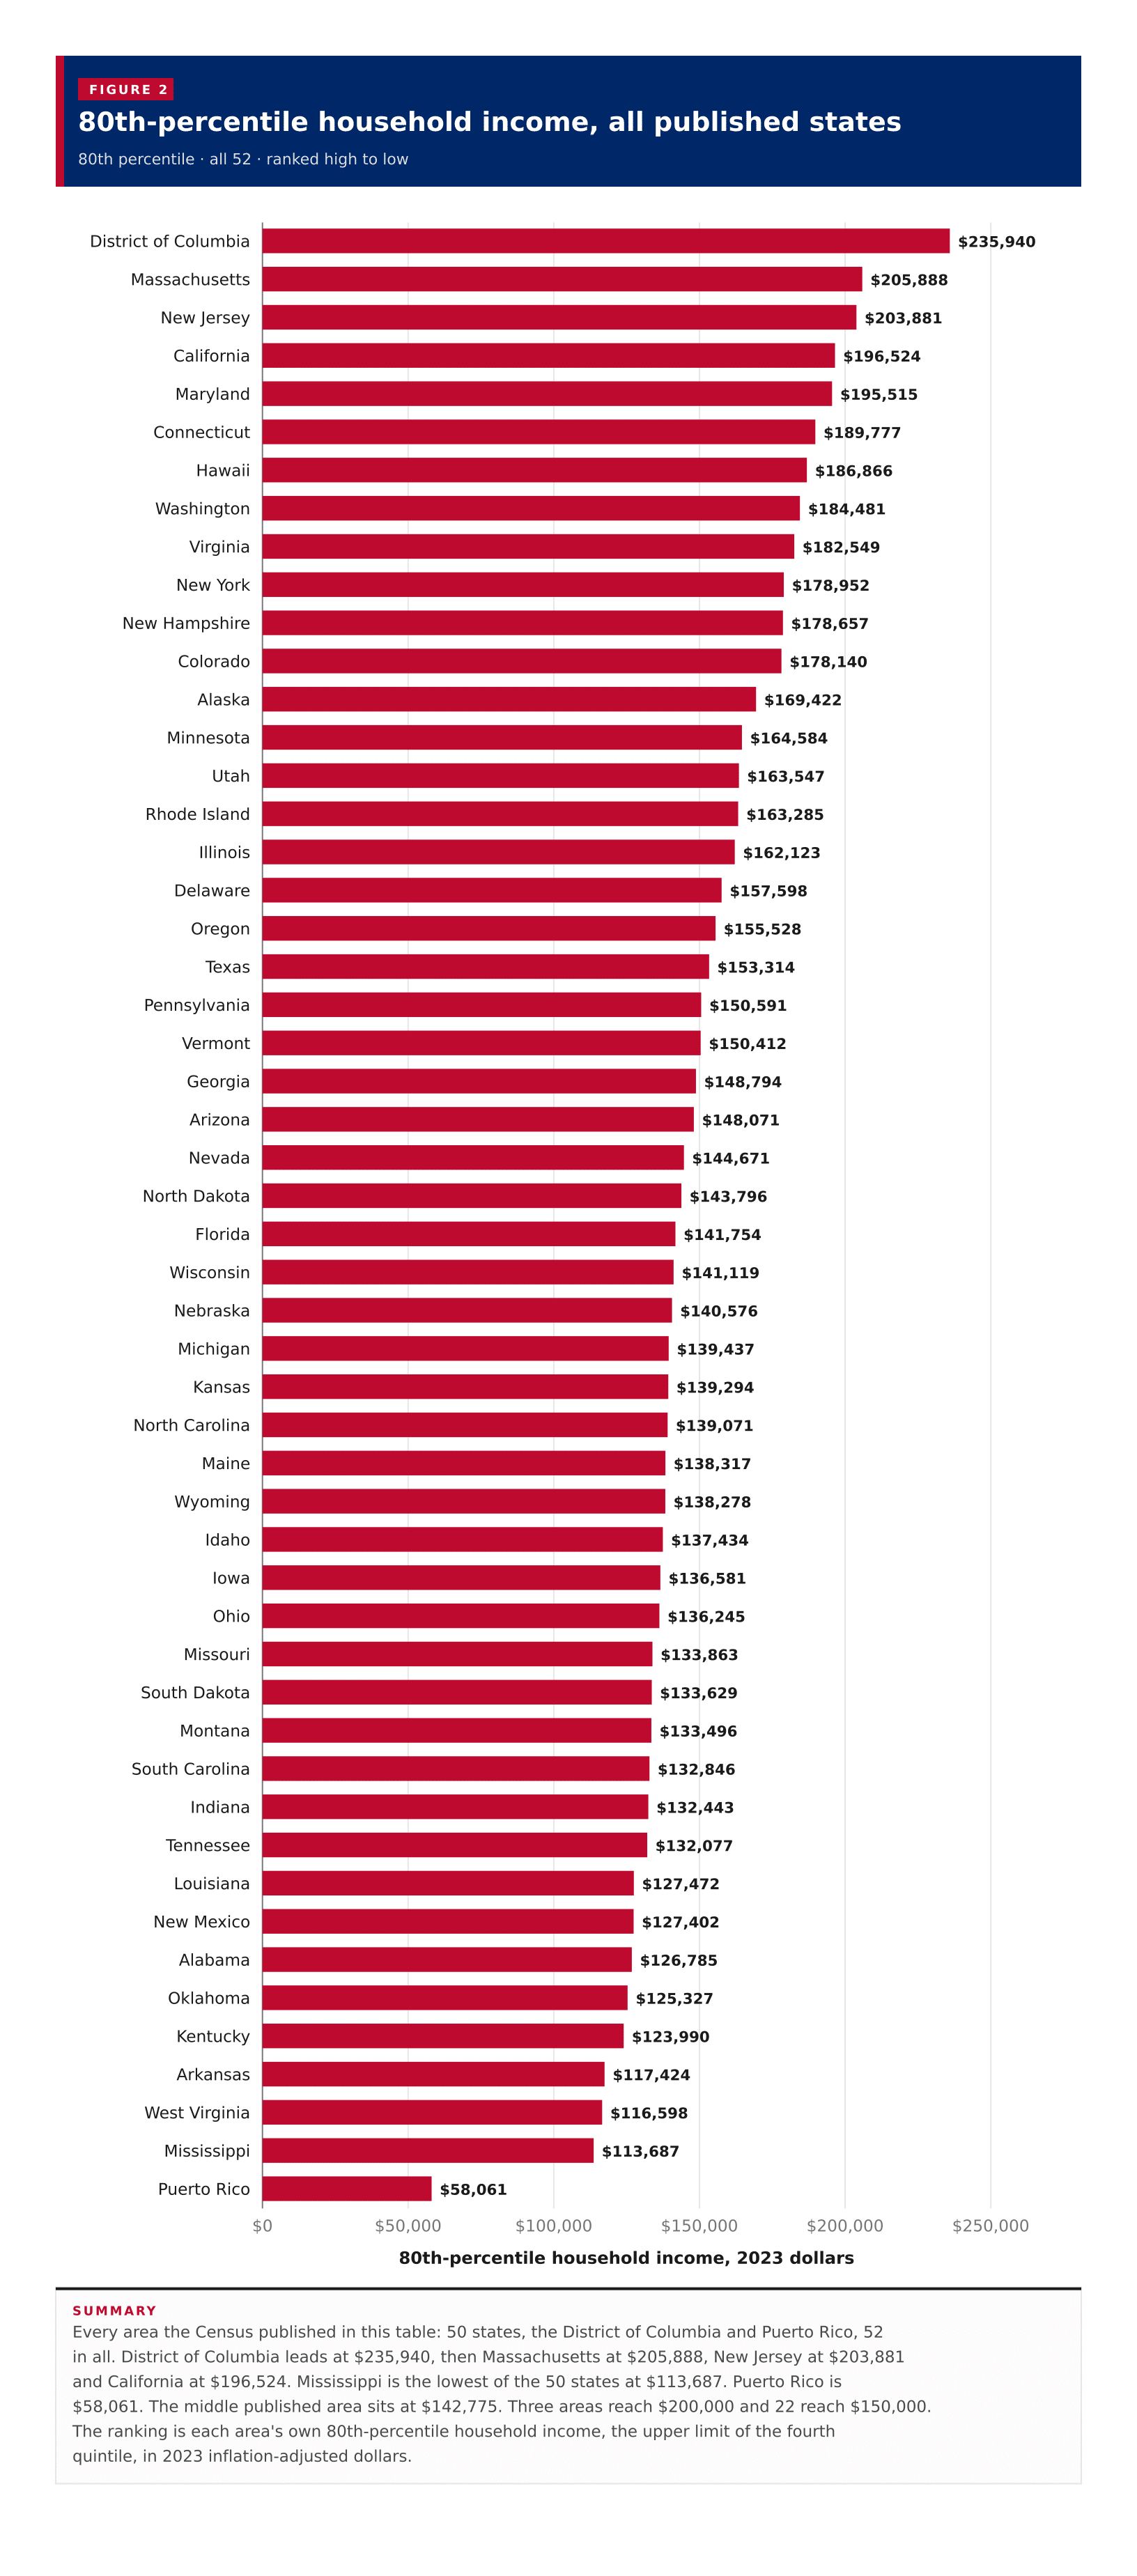
Every area the Census published in this table: 50 states, the District of Columbia and Puerto Rico, 52 in all. District of Columbia leads at $235,940, then Massachusetts at $205,888, New Jersey at $203,881 and California at $196,524. Mississippi is the lowest of the 50 states at $113,687. Puerto Rico is $58,061. The middle published area sits at $142,775. Three areas reach $200,000 and 22 reach $150,000. The ranking is each area's own 80th-percentile household income, the upper limit of the fourth quintile, in 2023 inflation-adjusted dollars.
Figure 2
20th-percentile household income, all published states
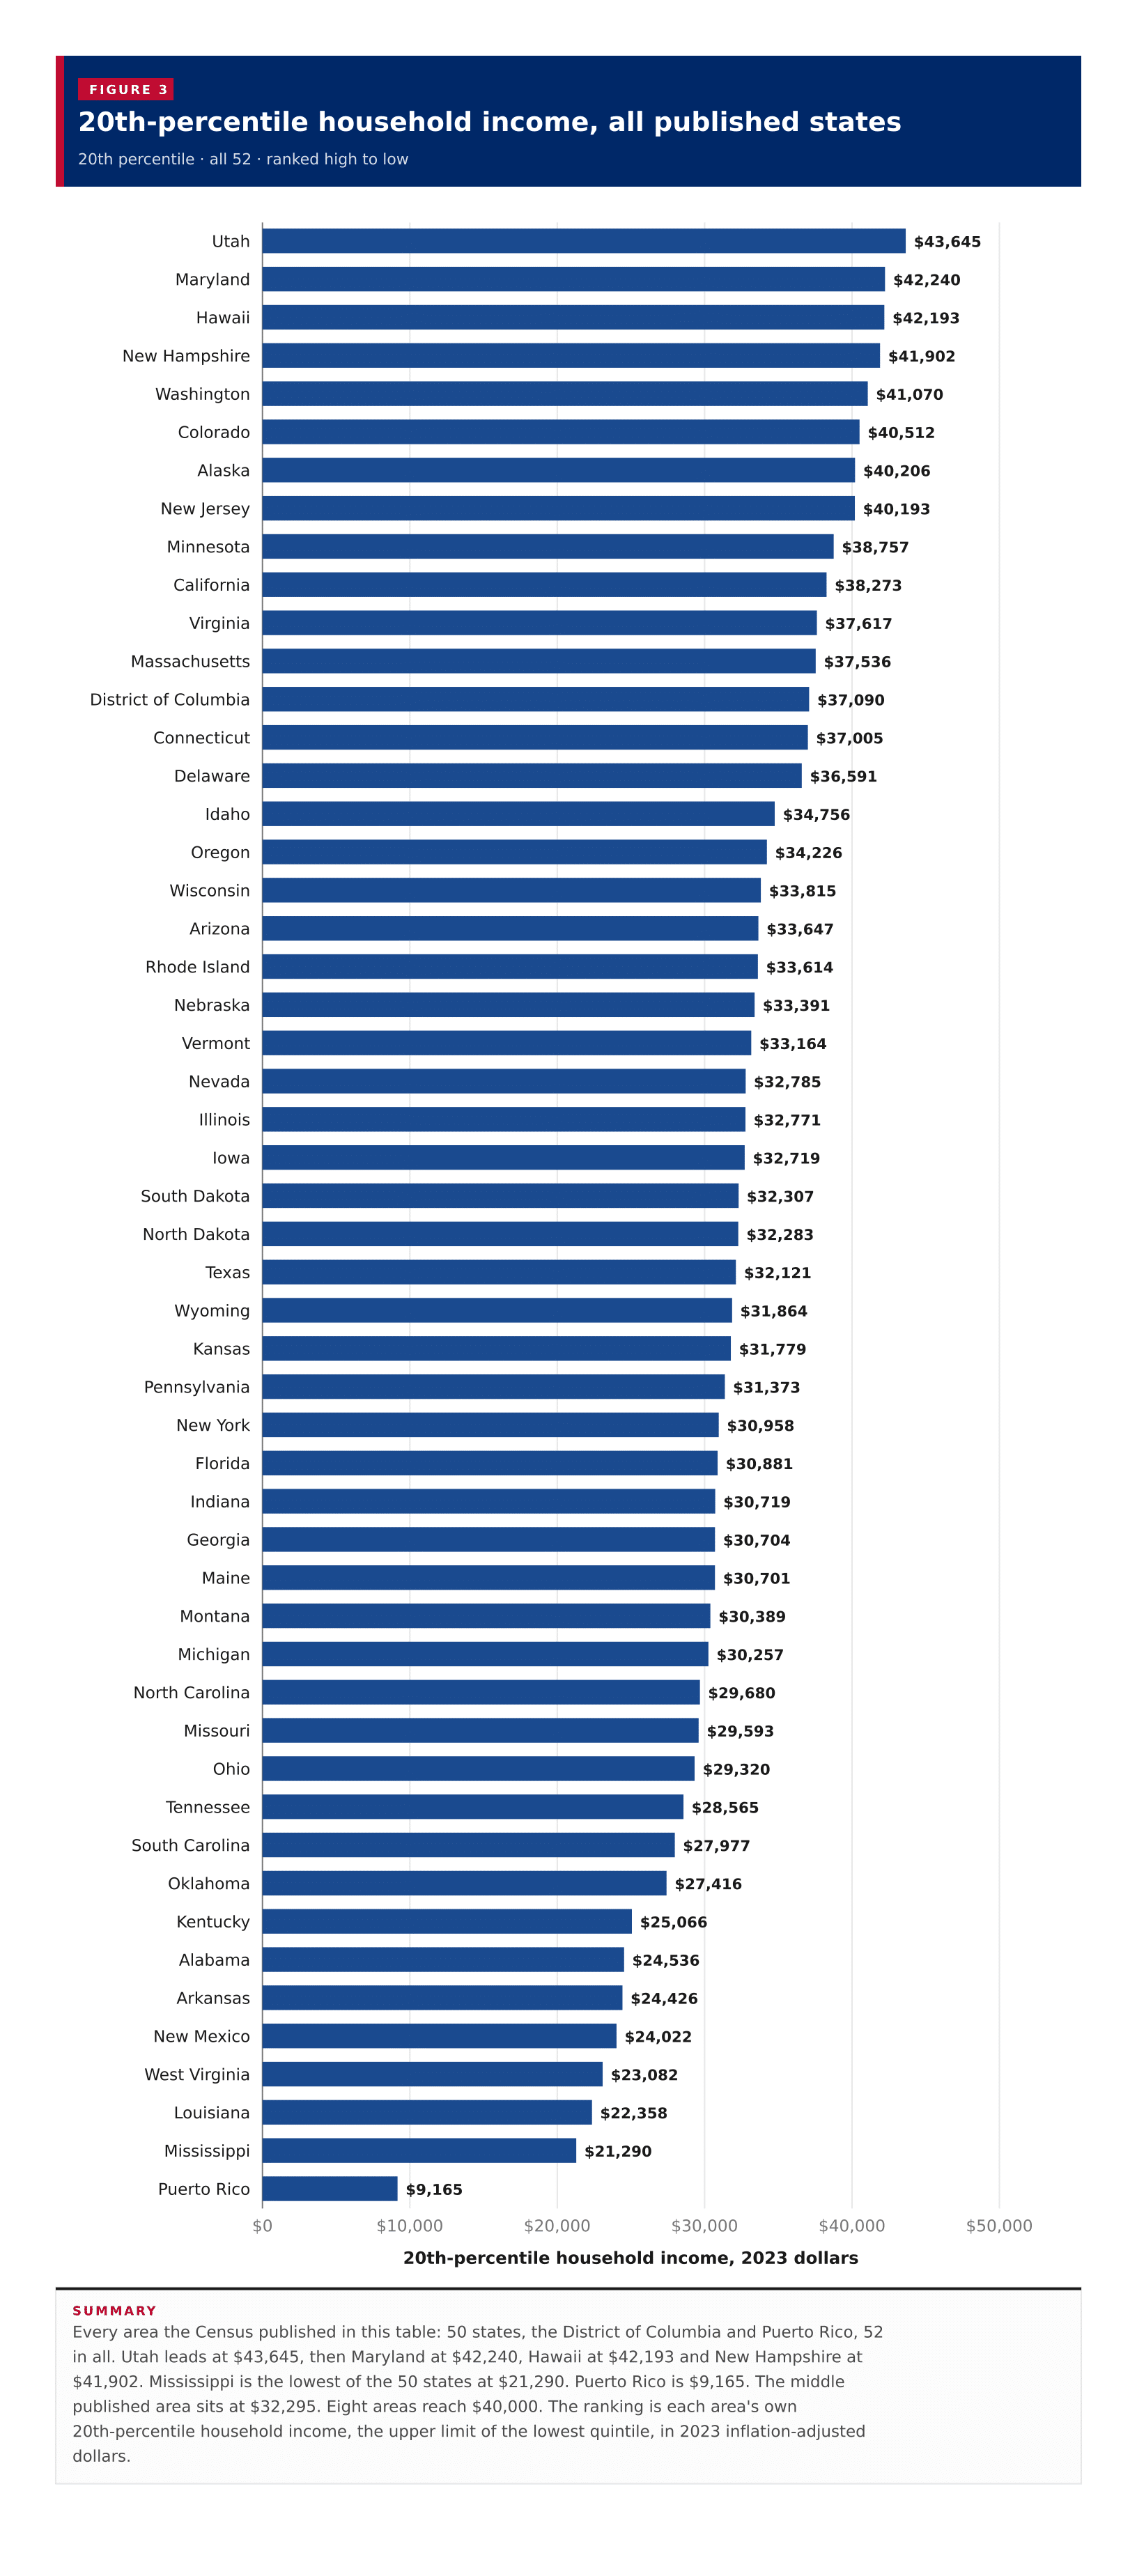
Every area the Census published in this table: 50 states, the District of Columbia and Puerto Rico, 52 in all. Utah leads at $43,645, then Maryland at $42,240, Hawaii at $42,193 and New Hampshire at $41,902. Mississippi is the lowest of the 50 states at $21,290. Puerto Rico is $9,165. The middle published area sits at $32,295. Eight areas reach $40,000. The ranking is each area's own 20th-percentile household income, the upper limit of the lowest quintile, in 2023 inflation-adjusted dollars.
Figure 3
20th percentile against 80th percentile
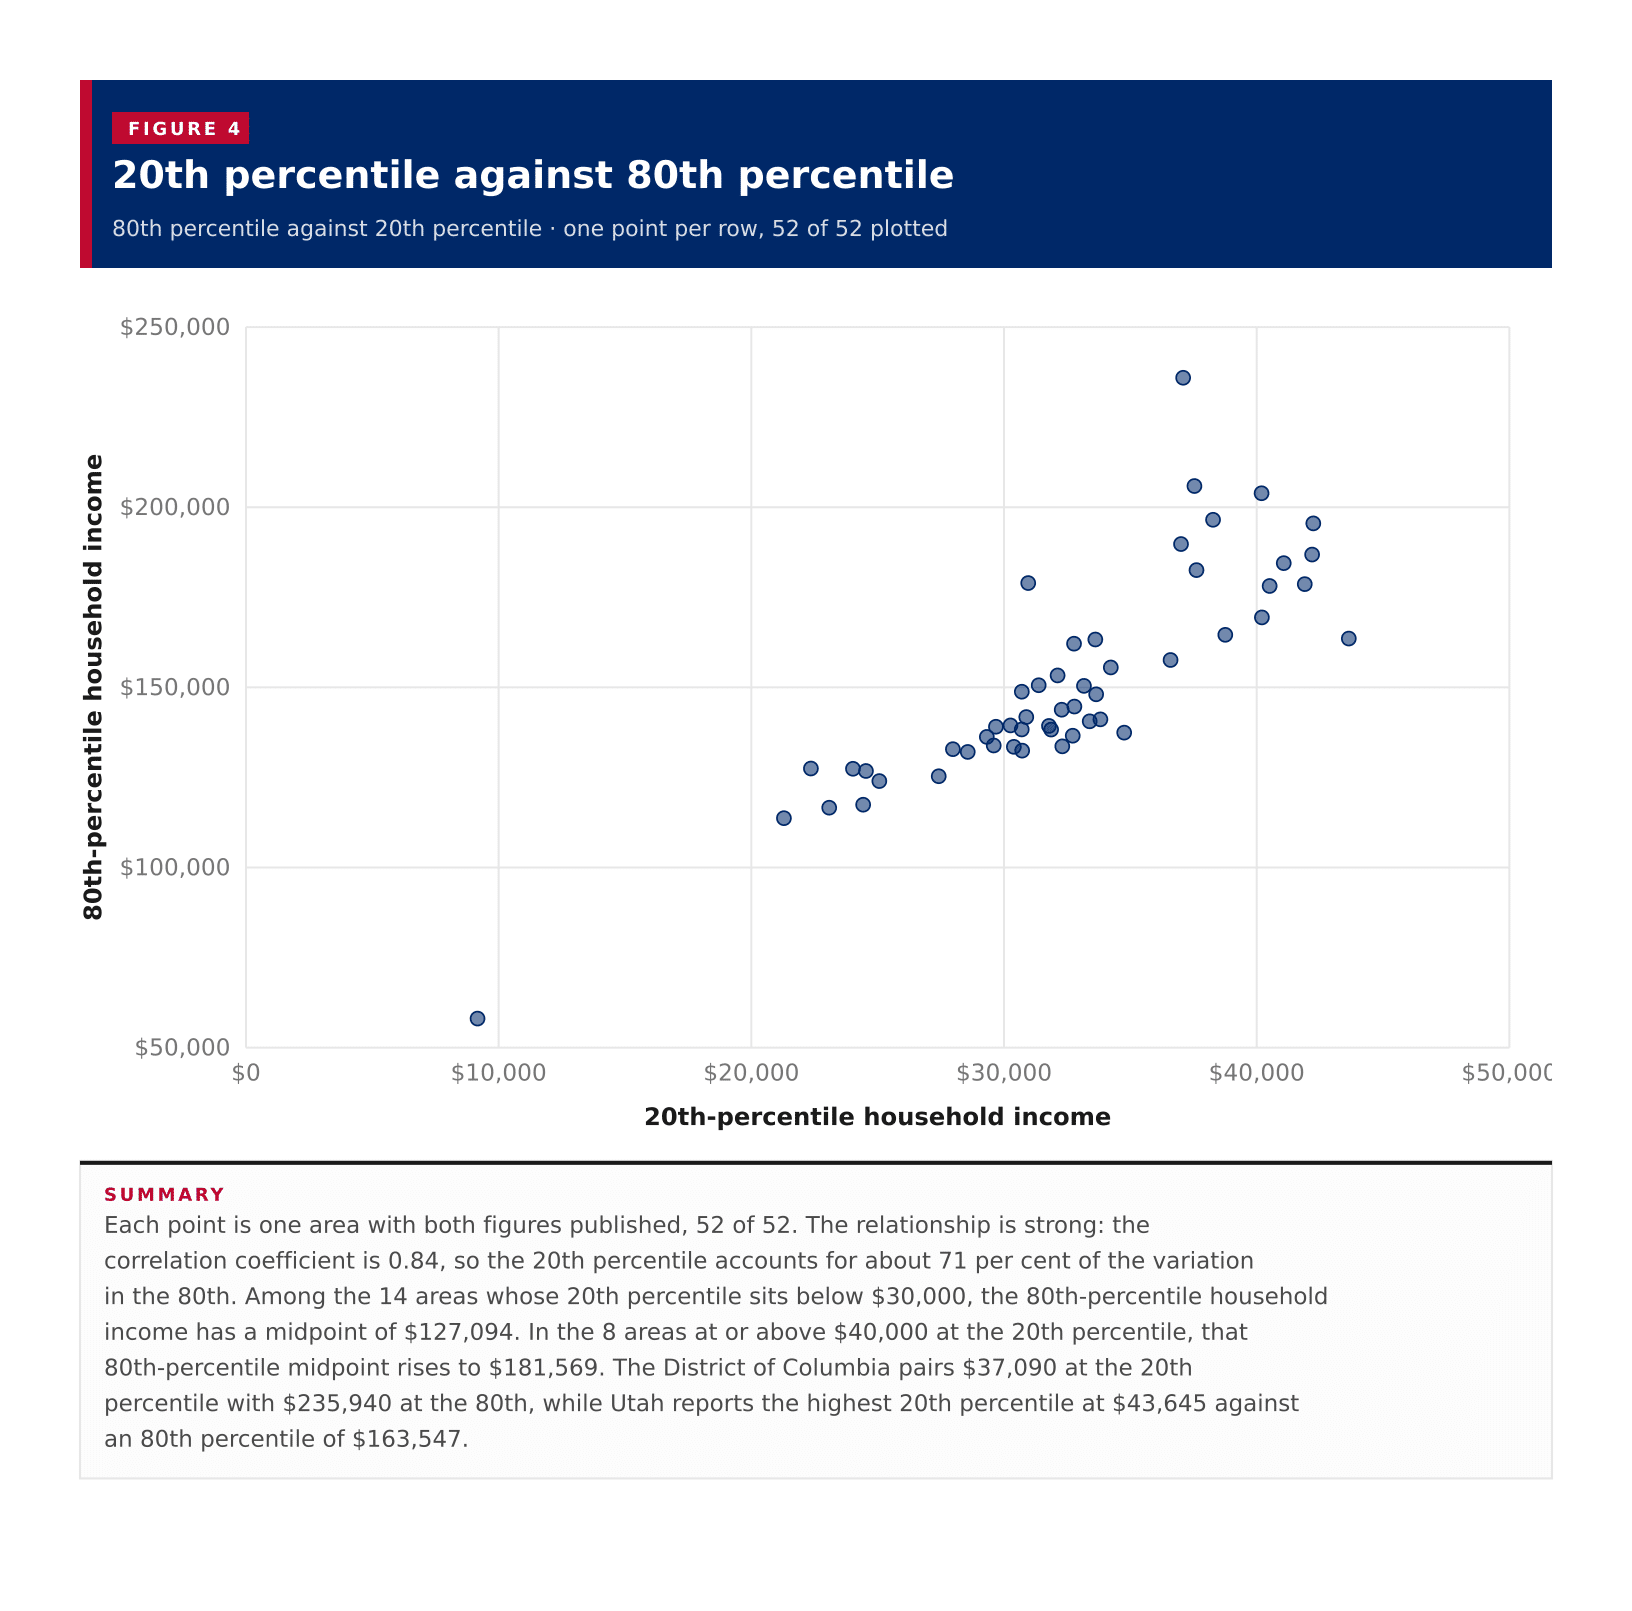
80th percentile against 20th percentile · one point per row, 52 of 52 plotted
Each point is one area with both figures published, 52 of 52. The relationship is strong: the correlation coefficient is 0.84, so the 20th percentile accounts for about 71 per cent of the variation in the 80th. Among the 14 areas whose 20th percentile sits below $30,000, the 80th-percentile household income has a midpoint of $127,094. In the 8 areas at or above $40,000 at the 20th percentile, that 80th-percentile midpoint rises to $181,569. The District of Columbia pairs $37,090 at the 20th percentile with $235,940 at the 80th, while Utah reports the highest 20th percentile at $43,645 against an 80th percentile of $163,547.
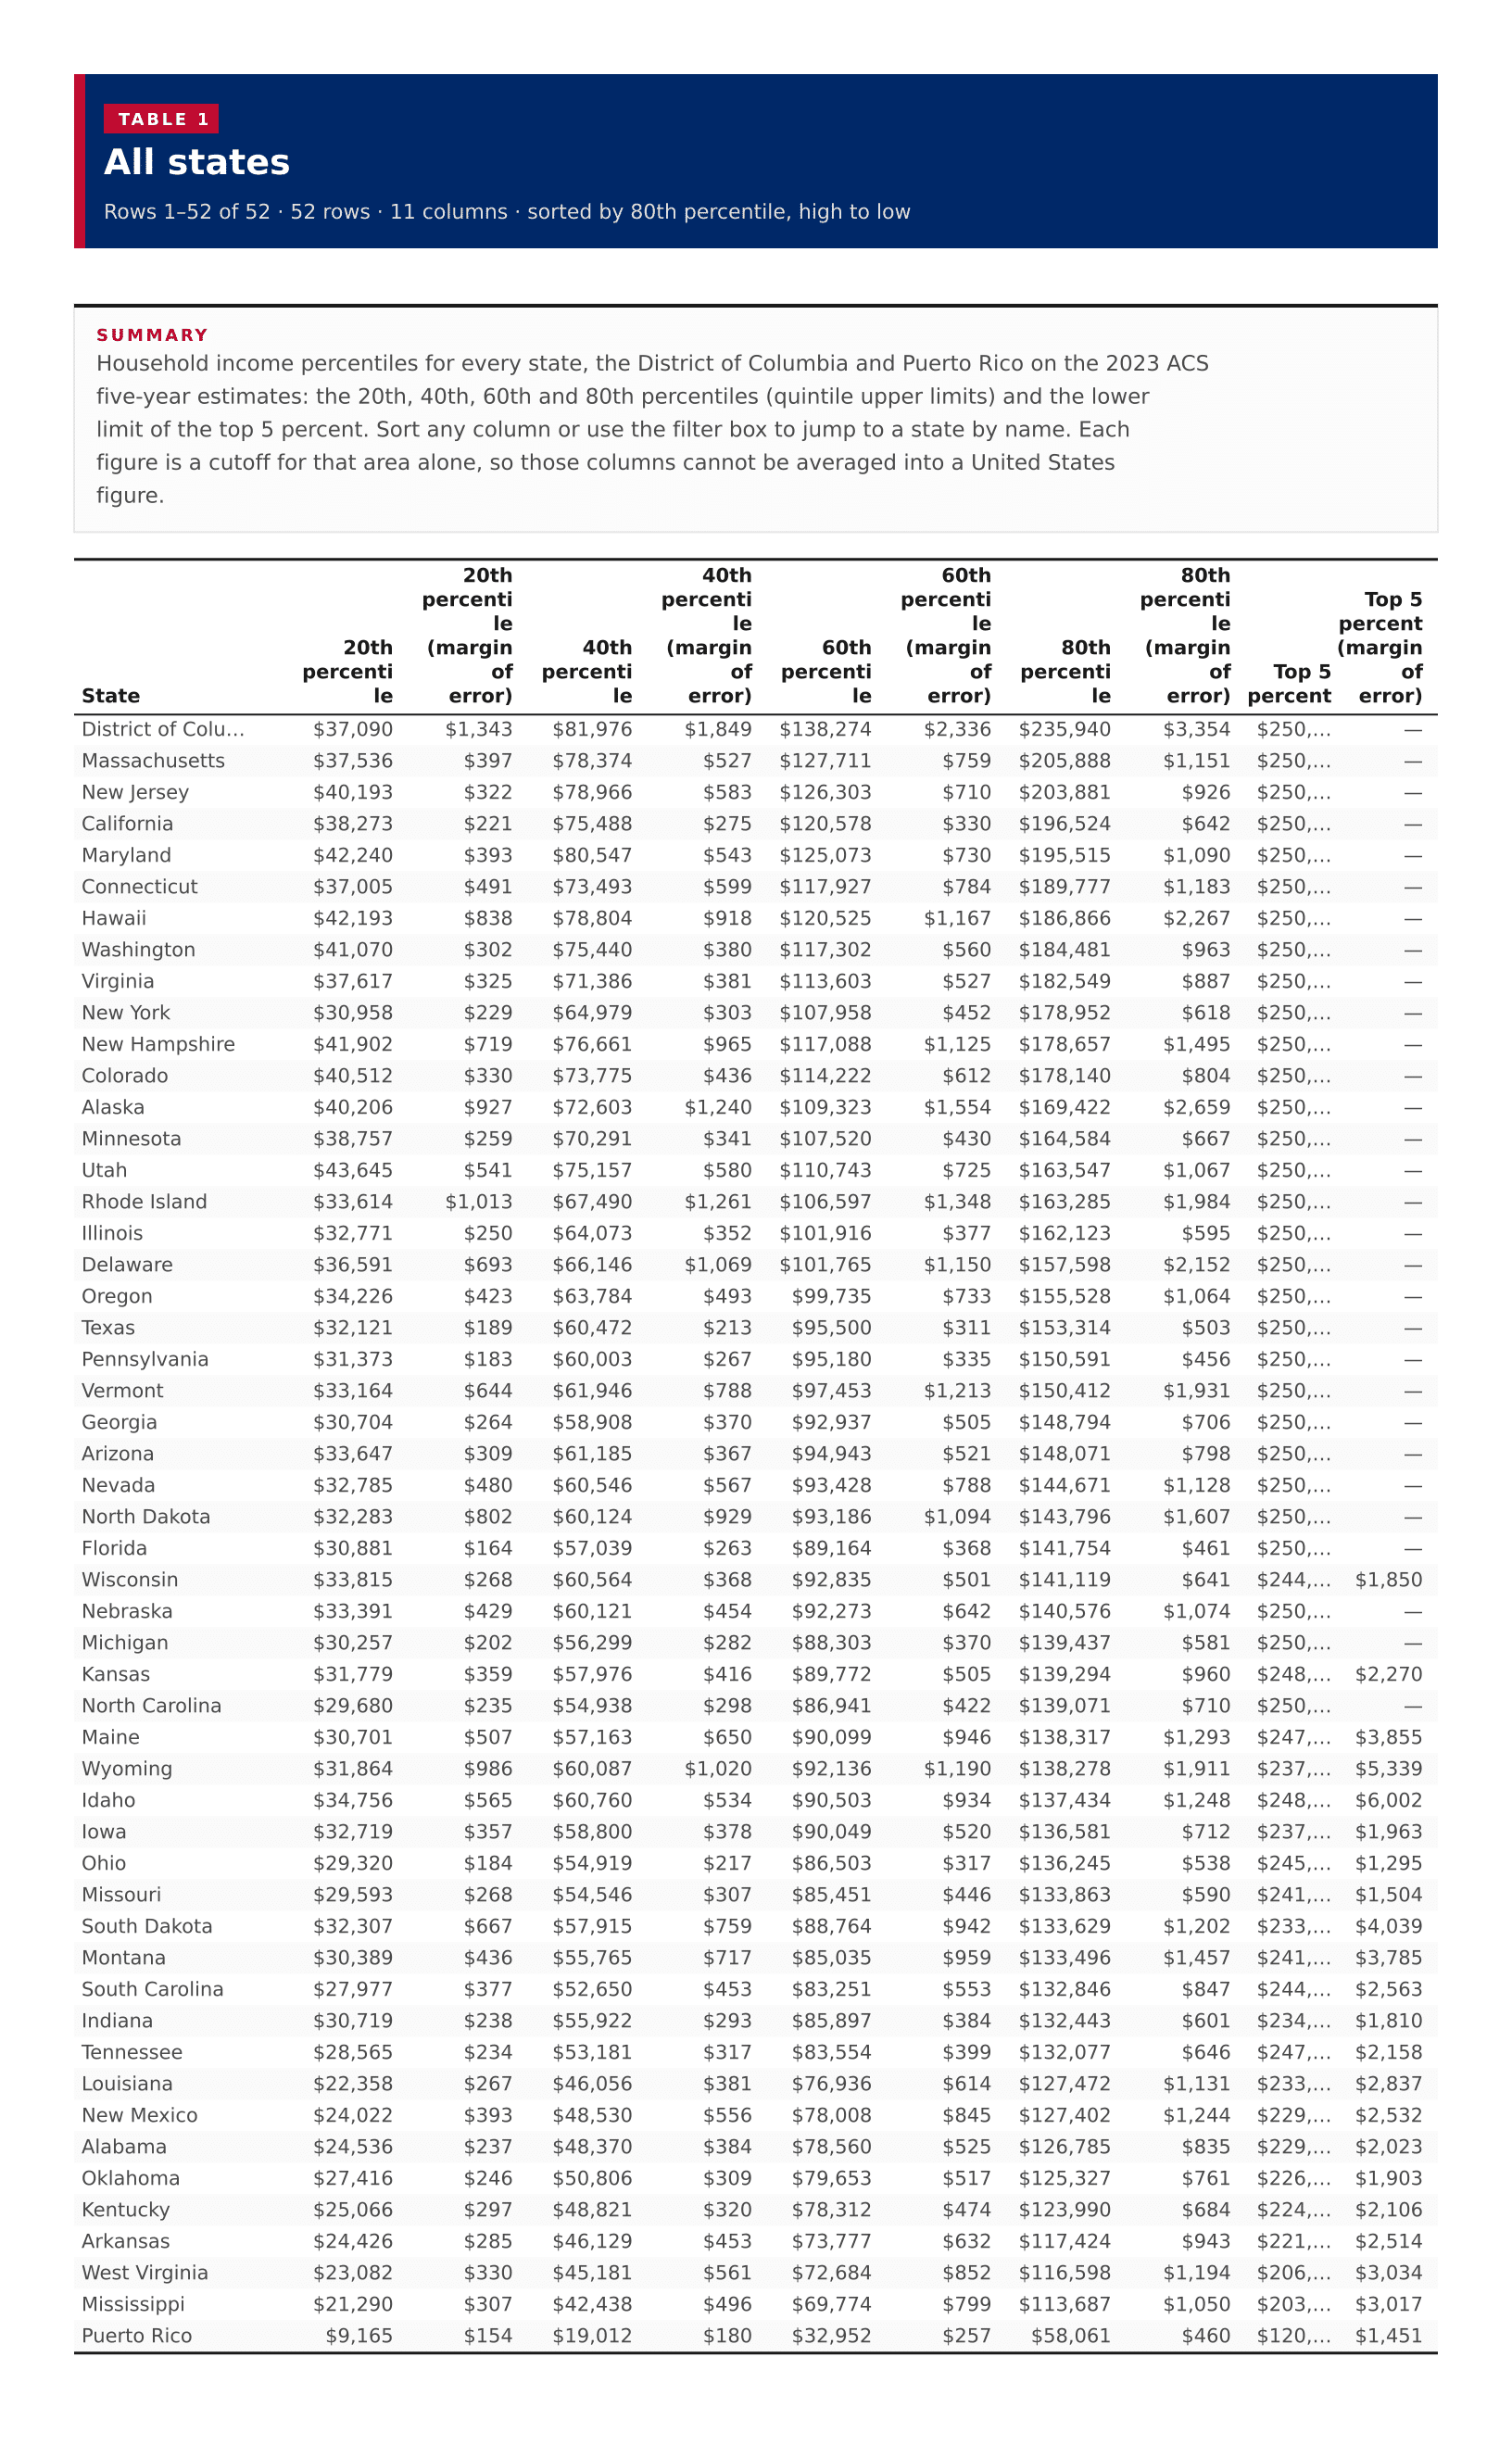
Table 1
All states
52 rows · 11 columns · sorted by 80th percentile, high to low
Household income percentiles for every state, the District of Columbia and Puerto Rico on the 2023 ACS five-year estimates: the 20th, 40th, 60th and 80th percentiles (quintile upper limits) and the lower limit of the top 5 percent. Sort any column or use the filter box to jump to a state by name. Each figure is a cutoff for that area alone, so those columns cannot be averaged into a United States figure.
Figures are household income quintile upper limits in 2023 inflation-adjusted dollars for the past 12 months. The 20th, 40th, 60th and 80th percentiles are the upper limits of the lowest through fourth quintiles. The 95th percentile is the lower limit of the top 5 percent.
A state percentile is the cutoff for households in that state, so these figures cannot be averaged to produce a national income percentile.
The Census published 50 states, the District of Columbia and Puerto Rico. None of the 20th, 40th, 60th or 80th percentile limits were suppressed.
The Census top-codes the lower limit of the top 5 percent at $250,000. Thirty areas show $250,001 with a 250,000+ annotation, so the true 95th percentile there is at least $250,000 and is not published as an exact dollar figure. Those rows have no margin of error.
Alaska and Hawaii appear in the ranking and table. On the map they are drawn as insets. Puerto Rico is listed in the ranking and table but is not on the state map.