Figure 1
Women's earnings as a share of men's, US states
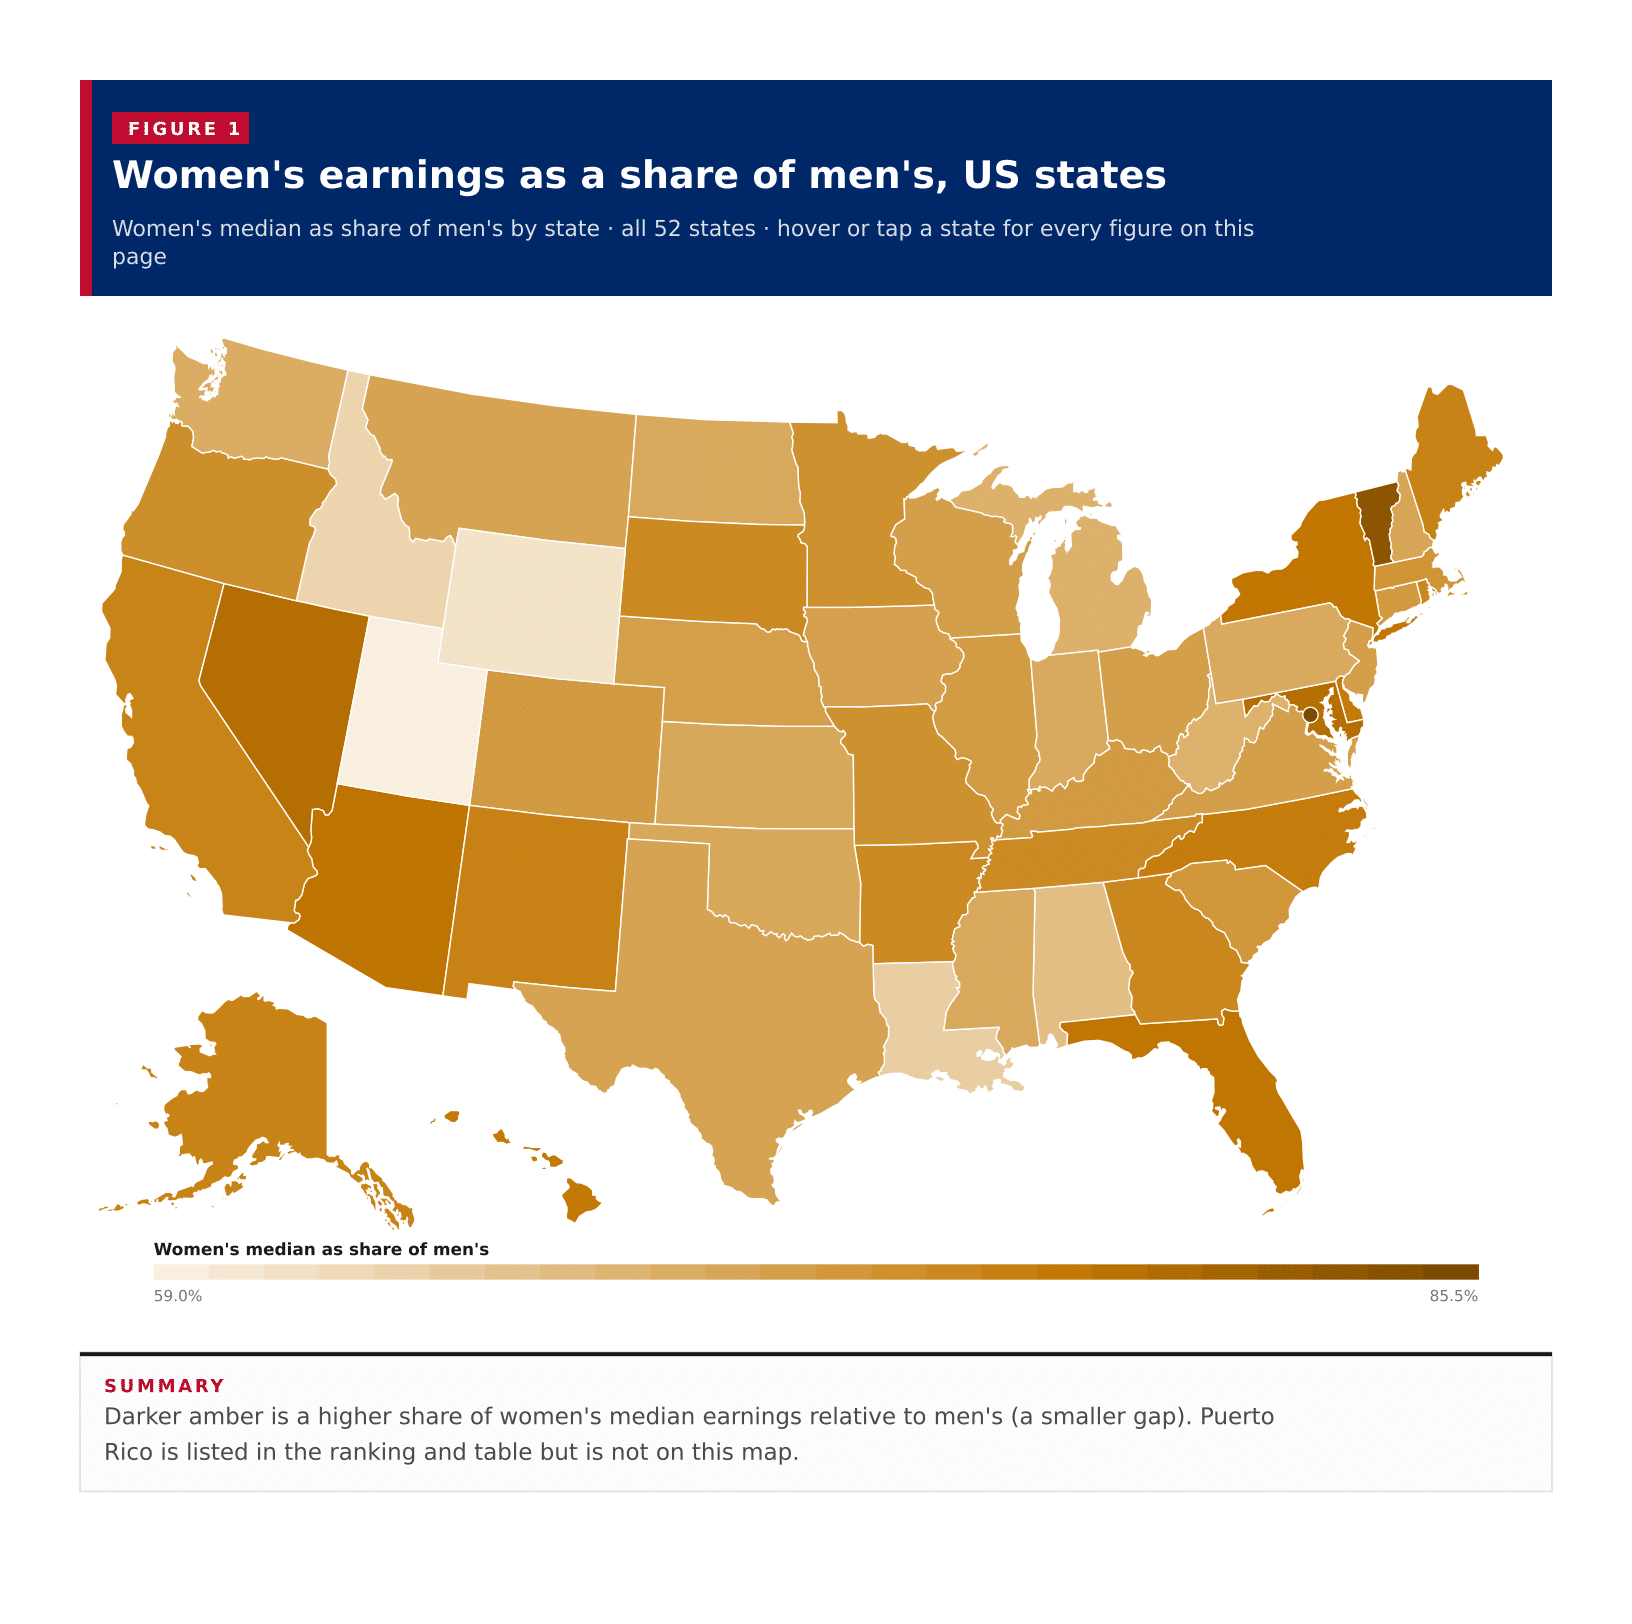
Women's median as share of men's by state · all 52 states · hover or tap a state for every figure on this page
A typical published area has women's median earnings at 72.4 per cent of men's, the midpoint of the 50 states, the District of Columbia and Puerto Rico on the 2023 ACS five-year estimates. Puerto Rico leads at 98.6%, with women's and men's medians nearly equal though both are low in dollars. The District of Columbia is next at 85.5%. Utah has the widest gap among the 50 states at 59.0%. These ratios are each area's own female median divided by its male median for workers with earnings, not a United States earnings gap.
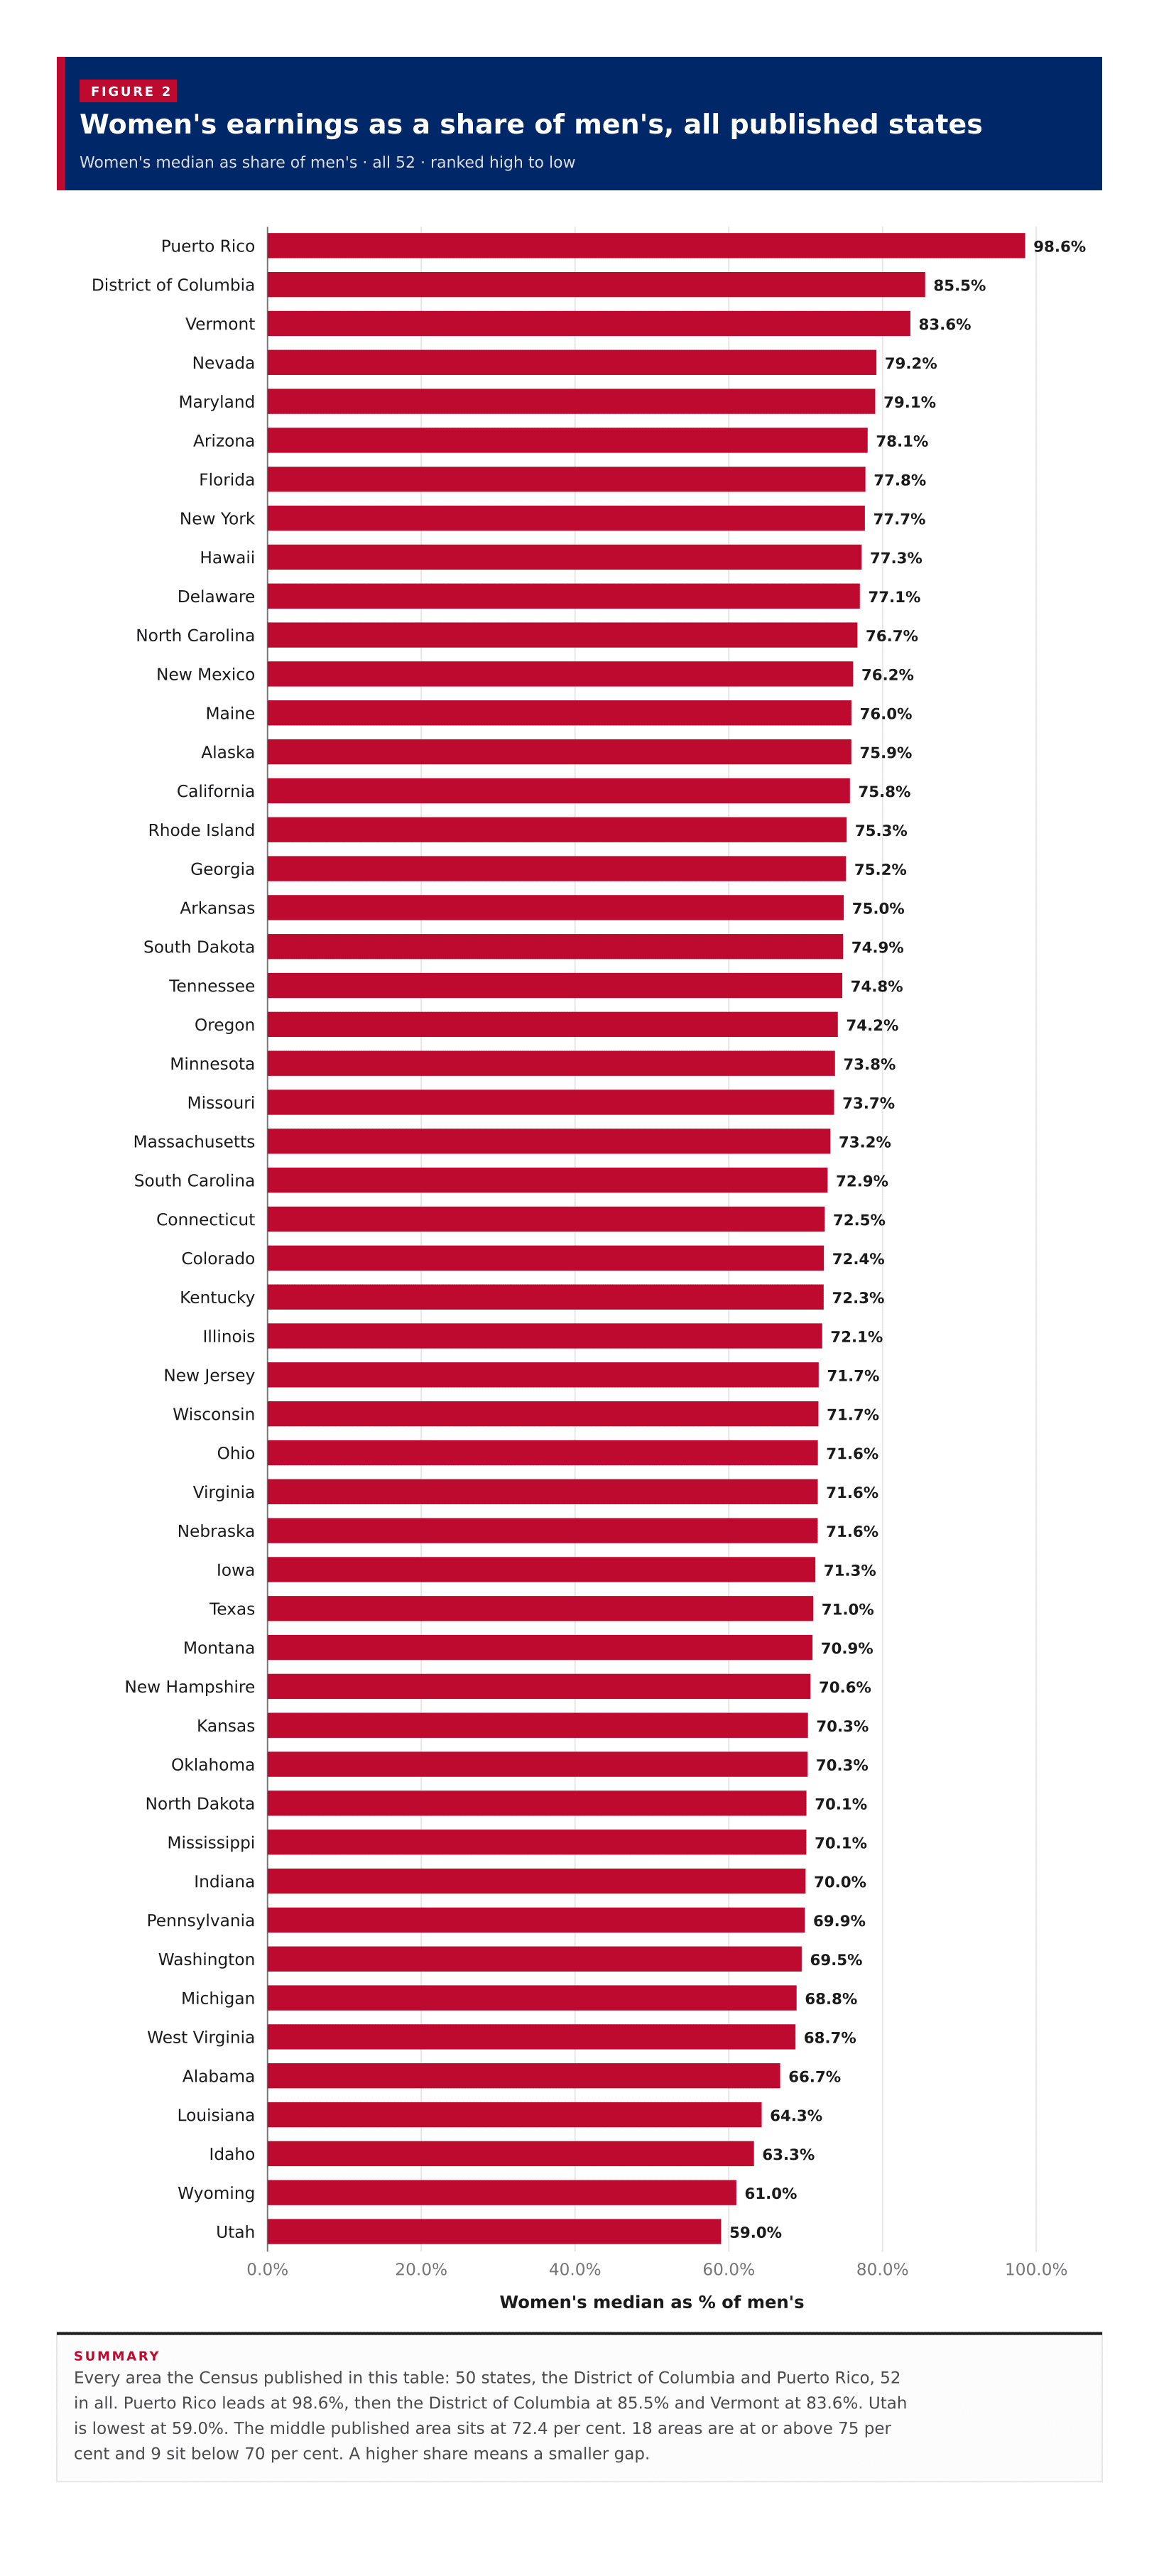
Women's median as share of men's · all 52 · ranked high to low
Every area the Census published in this table: 50 states, the District of Columbia and Puerto Rico, 52 in all. Puerto Rico leads at 98.6%, then the District of Columbia at 85.5% and Vermont at 83.6%. Utah is lowest at 59.0%. The middle published area sits at 72.4 per cent. 18 areas are at or above 75 per cent and 9 sit below 70 per cent. A higher share means a smaller gap.
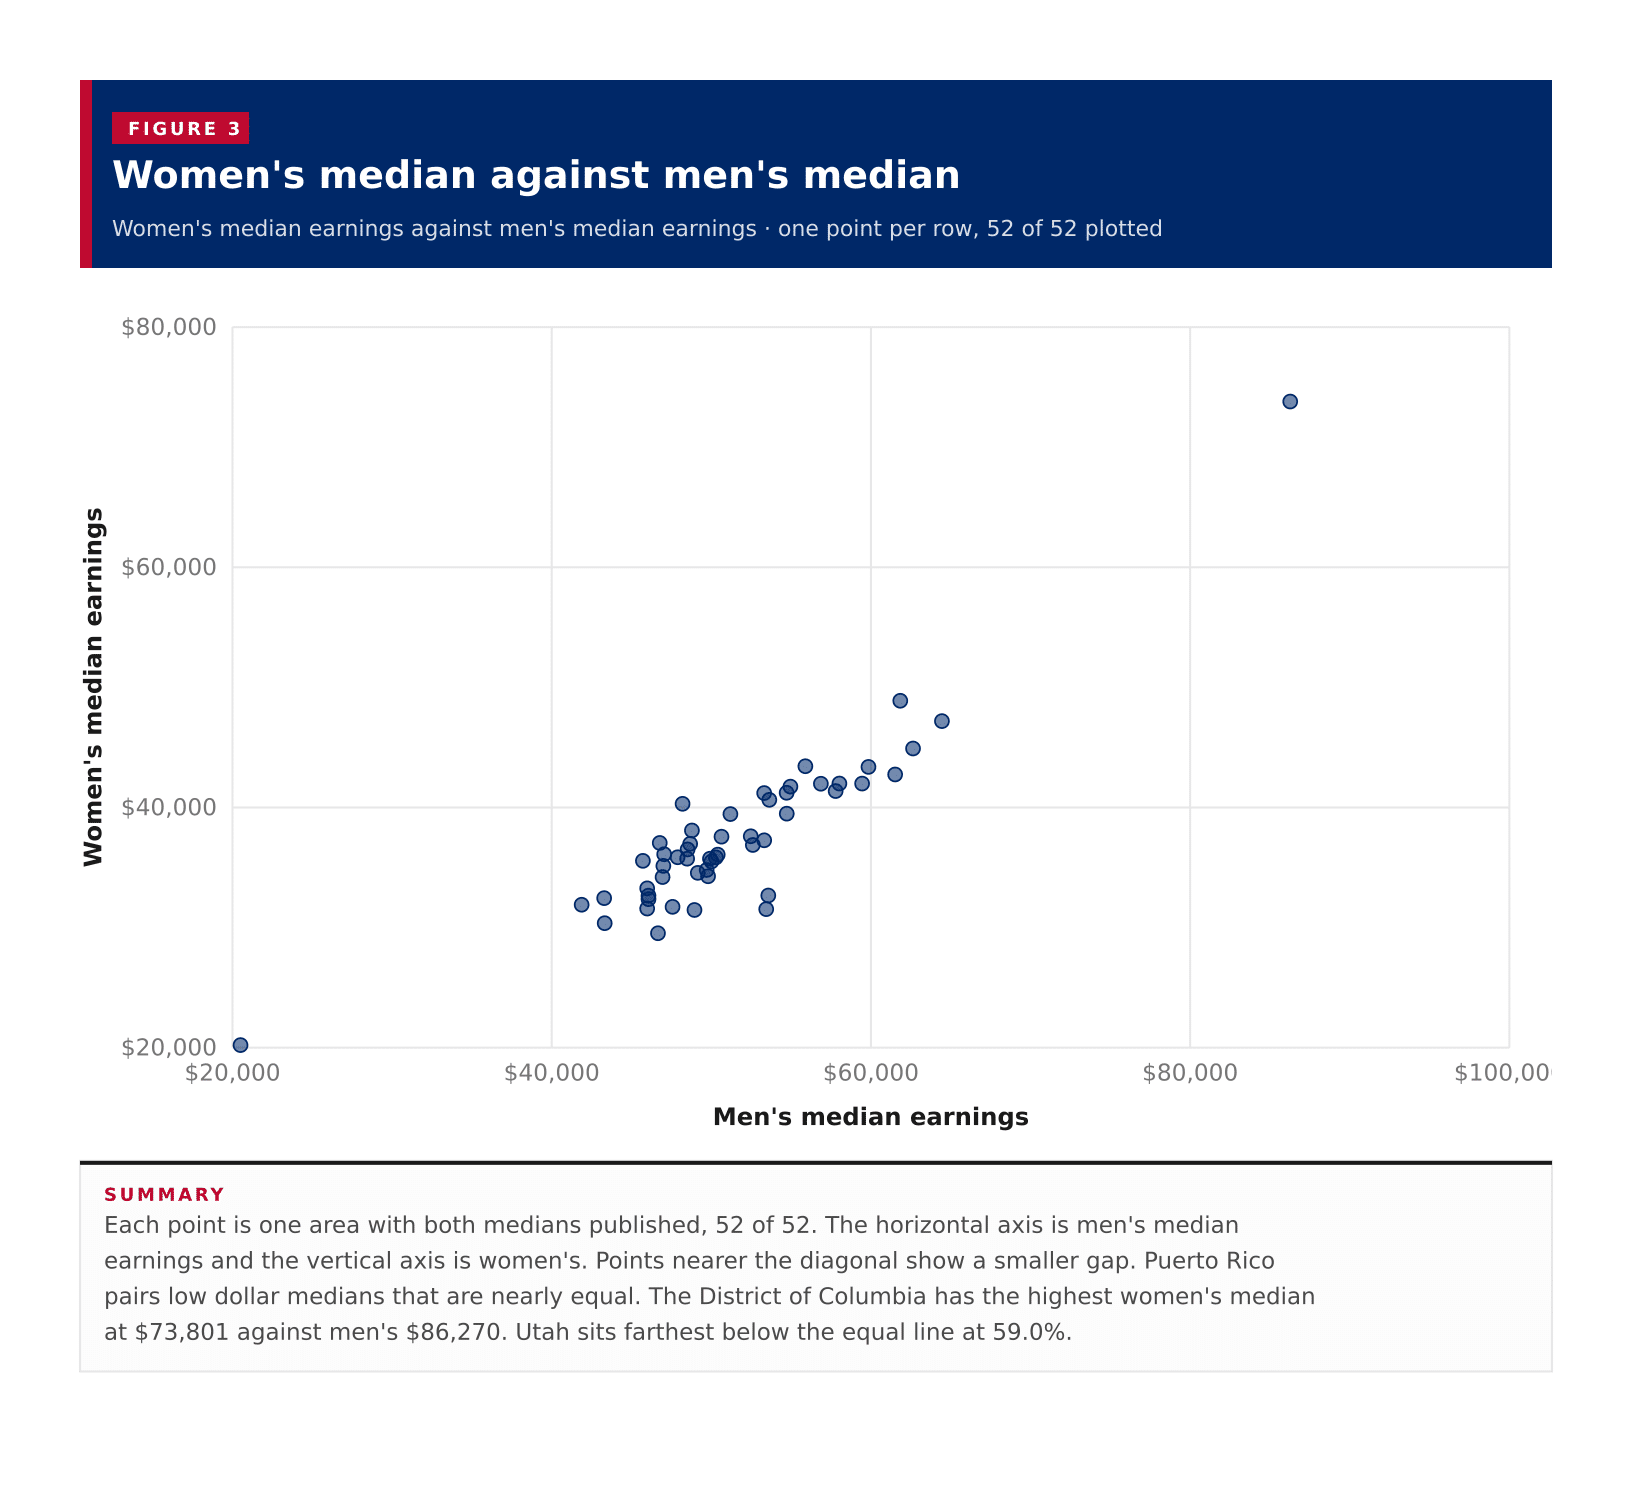
Women's median earnings against men's median earnings · one point per row, 52 of 52 plotted
Each point is one area with both medians published, 52 of 52. The horizontal axis is men's median earnings and the vertical axis is women's. Points nearer the diagonal show a smaller gap. Puerto Rico pairs low dollar medians that are nearly equal. The District of Columbia has the highest women's median at $73,801 against men's $86,270. Utah sits farthest below the equal line at 59.0%.
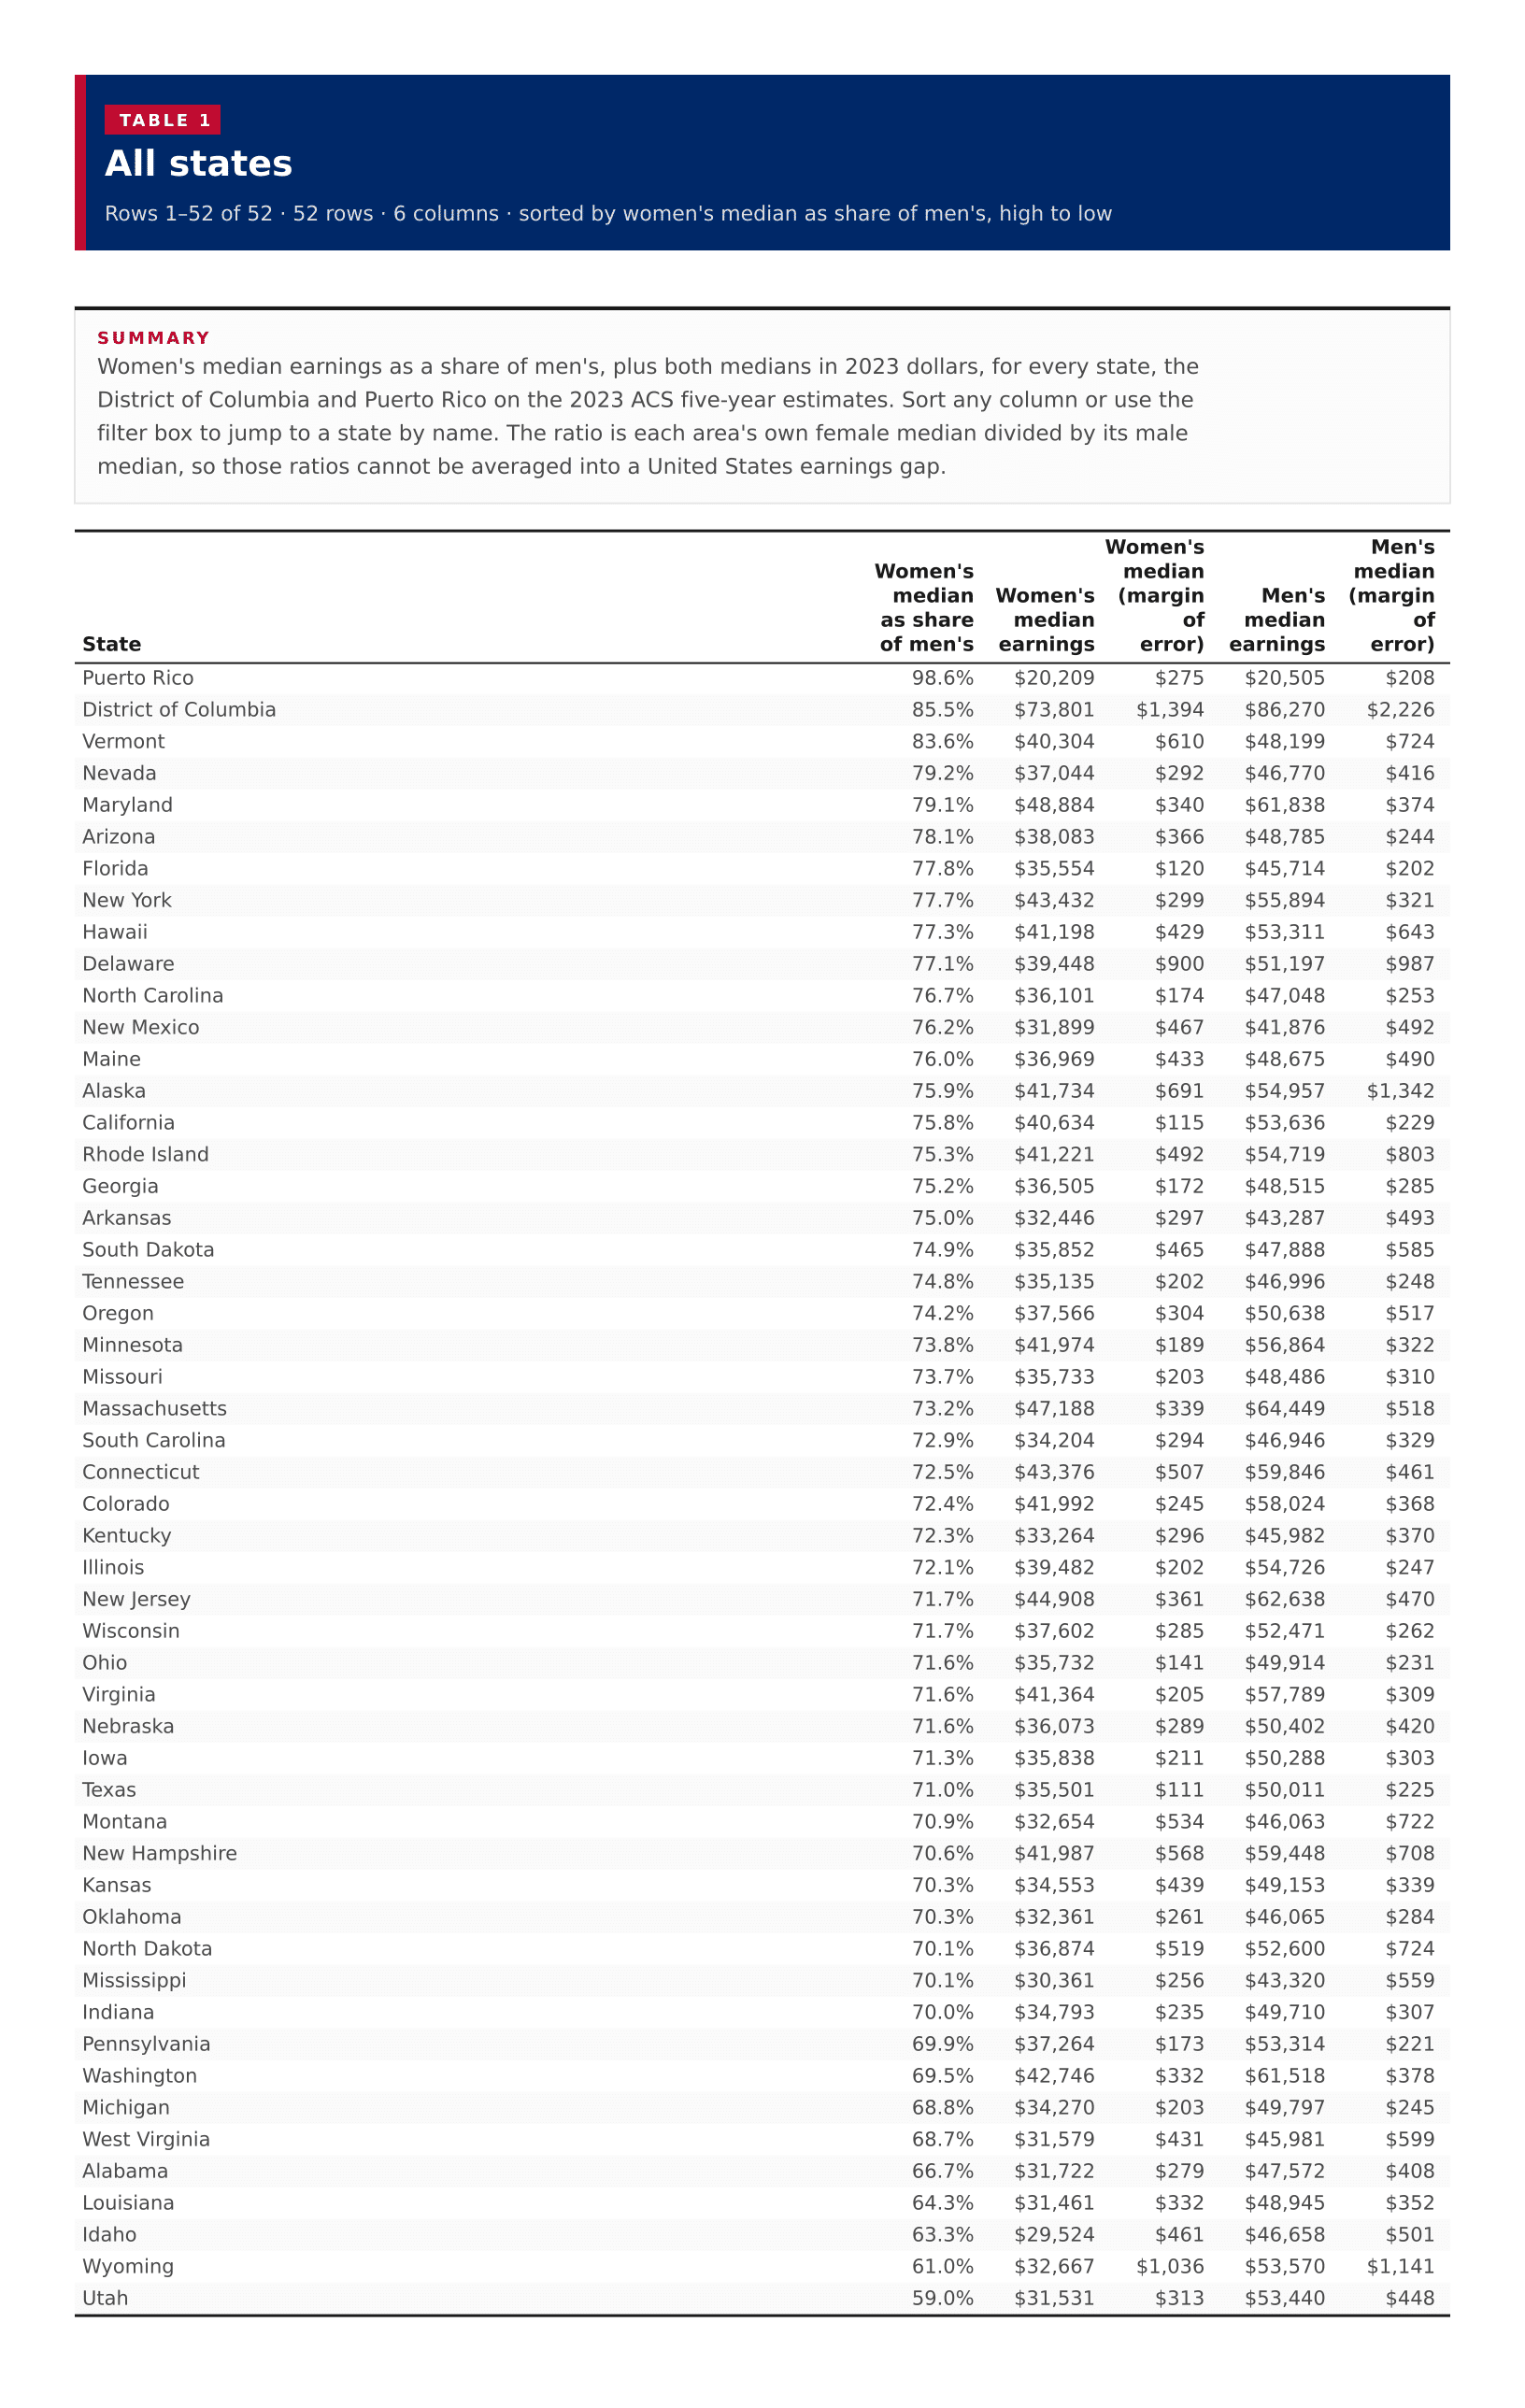
52 rows · 6 columns · sorted by women's median as share of men's, high to low
Women's median earnings as a share of men's, plus both medians in 2023 dollars, for every state, the District of Columbia and Puerto Rico on the 2023 ACS five-year estimates. Sort any column or use the filter box to jump to a state by name. The ratio is each area's own female median divided by its male median, so those ratios cannot be averaged into a United States earnings gap.
| ? | |||||
|---|---|---|---|---|---|
| Puerto Rico | 98.6% | $20,209 | $275 | $20,505 | $208 |
| District of Columbia | 85.5% | $73,801 | $1,394 | $86,270 | $2,226 |
| Vermont | 83.6% | $40,304 | $610 | $48,199 | $724 |
| Nevada | 79.2% | $37,044 | $292 | $46,770 | $416 |
| Maryland | 79.1% | $48,884 | $340 | $61,838 | $374 |
| Arizona | 78.1% | $38,083 | $366 | $48,785 | $244 |
| Florida | 77.8% | $35,554 | $120 | $45,714 | $202 |
| New York | 77.7% | $43,432 | $299 | $55,894 | $321 |
| Hawaii | 77.3% | $41,198 | $429 | $53,311 | $643 |
| Delaware | 77.1% | $39,448 | $900 | $51,197 | $987 |
| North Carolina | 76.7% | $36,101 | $174 | $47,048 | $253 |
| New Mexico | 76.2% | $31,899 | $467 | $41,876 | $492 |
| Maine | 76.0% | $36,969 | $433 | $48,675 | $490 |
| Alaska | 75.9% | $41,734 | $691 | $54,957 | $1,342 |
| California | 75.8% | $40,634 | $115 | $53,636 | $229 |
| Rhode Island | 75.3% | $41,221 | $492 | $54,719 | $803 |
| Georgia | 75.2% | $36,505 | $172 | $48,515 | $285 |
| Arkansas | 75.0% | $32,446 | $297 | $43,287 | $493 |
| South Dakota | 74.9% | $35,852 | $465 | $47,888 | $585 |
| Tennessee | 74.8% | $35,135 | $202 | $46,996 | $248 |
| Oregon | 74.2% | $37,566 | $304 | $50,638 | $517 |
| Minnesota | 73.8% | $41,974 | $189 | $56,864 | $322 |
| Missouri | 73.7% | $35,733 | $203 | $48,486 | $310 |
| Massachusetts | 73.2% | $47,188 | $339 | $64,449 | $518 |
| South Carolina | 72.9% | $34,204 | $294 | $46,946 | $329 |
| Connecticut | 72.5% | $43,376 | $507 | $59,846 | $461 |
| Colorado | 72.4% | $41,992 | $245 | $58,024 | $368 |
| Kentucky | 72.3% | $33,264 | $296 | $45,982 | $370 |
| Illinois | 72.1% | $39,482 | $202 | $54,726 | $247 |
| New Jersey | 71.7% | $44,908 | $361 | $62,638 | $470 |
| Wisconsin | 71.7% | $37,602 | $285 | $52,471 | $262 |
| Ohio | 71.6% | $35,732 | $141 | $49,914 | $231 |
| Virginia | 71.6% | $41,364 | $205 | $57,789 | $309 |
| Nebraska | 71.6% | $36,073 | $289 | $50,402 | $420 |
| Iowa | 71.3% | $35,838 | $211 | $50,288 | $303 |
| Texas | 71.0% | $35,501 | $111 | $50,011 | $225 |
| Montana | 70.9% | $32,654 | $534 | $46,063 | $722 |
| New Hampshire | 70.6% | $41,987 | $568 | $59,448 | $708 |
| Kansas | 70.3% | $34,553 | $439 | $49,153 | $339 |
| Oklahoma | 70.3% | $32,361 | $261 | $46,065 | $284 |
| North Dakota | 70.1% | $36,874 | $519 | $52,600 | $724 |
| Mississippi | 70.1% | $30,361 | $256 | $43,320 | $559 |
| Indiana | 70.0% | $34,793 | $235 | $49,710 | $307 |
| Pennsylvania | 69.9% | $37,264 | $173 | $53,314 | $221 |
| Washington | 69.5% | $42,746 | $332 | $61,518 | $378 |
| Michigan | 68.8% | $34,270 | $203 | $49,797 | $245 |
| West Virginia | 68.7% | $31,579 | $431 | $45,981 | $599 |
| Alabama | 66.7% | $31,722 | $279 | $47,572 | $408 |
| Louisiana | 64.3% | $31,461 | $332 | $48,945 | $352 |
| Idaho | 63.3% | $29,524 | $461 | $46,658 | $501 |
| Wyoming | 61.0% | $32,667 | $1,036 | $53,570 | $1,141 |
| Utah | 59.0% | $31,531 | $313 | $53,440 | $448 |