Commute time by US state

Summary

Mean travel time to work, US states

Mean travel time (minutes) by state · all 52 states · hover or tap a state for every figure on this page

52 items
View100%
DownloadPDFImageCSV
StatesNew York
Mean travel time to work, US statesDarker amber is a longer mean one-way commute. Puerto Rico is listed in the ranking and table but is not on this map.Alabama · Mean travel time (minutes): 25.4 · Share commuting 60+ minutes: 7.0% · Commuting workers: 2,031,076 · Commuting workers (margin of error): 9,749 · Aggregate travel time (minutes): 51,637,530 · Aggregate travel time (margin of error): 384,233Alaska · Mean travel time (minutes): 19.5 · Share commuting 60+ minutes: 5.0% · Commuting workers: 320,367 · Commuting workers (margin of error): 3,002 · Aggregate travel time (minutes): 6,246,845 · Aggregate travel time (margin of error): 110,673Arizona · Mean travel time (minutes): 25.5 · Share commuting 60+ minutes: 6.7% · Commuting workers: 2,760,020 · Commuting workers (margin of error): 10,223 · Aggregate travel time (minutes): 70,317,520 · Aggregate travel time (margin of error): 410,503Arkansas · Mean travel time (minutes): 22.3 · Share commuting 60+ minutes: 5.5% · Commuting workers: 1,210,945 · Commuting workers (margin of error): 7,069 · Aggregate travel time (minutes): 27,063,575 · Aggregate travel time (margin of error): 261,459California · Mean travel time (minutes): 29.0 · Share commuting 60+ minutes: 11.5% · Commuting workers: 15,498,136 · Commuting workers (margin of error): 22,015 · Aggregate travel time (minutes): 449,199,085 · Aggregate travel time (margin of error): 1,016,968Colorado · Mean travel time (minutes): 25.5 · Share commuting 60+ minutes: 7.0% · Commuting workers: 2,468,442 · Commuting workers (margin of error): 9,374 · Aggregate travel time (minutes): 62,864,505 · Aggregate travel time (margin of error): 390,290Connecticut · Mean travel time (minutes): 26.6 · Share commuting 60+ minutes: 8.9% · Commuting workers: 1,542,438 · Commuting workers (margin of error): 8,326 · Aggregate travel time (minutes): 40,993,550 · Aggregate travel time (margin of error): 319,633Delaware · Mean travel time (minutes): 26.1 · Share commuting 60+ minutes: 8.0% · Commuting workers: 412,959 · Commuting workers (margin of error): 3,162 · Aggregate travel time (minutes): 10,778,325 · Aggregate travel time (margin of error): 154,224Florida · Mean travel time (minutes): 28.0 · Share commuting 60+ minutes: 8.6% · Commuting workers: 8,678,646 · Commuting workers (margin of error): 21,611 · Aggregate travel time (minutes): 242,796,490 · Aggregate travel time (margin of error): 1,059,149Georgia · Mean travel time (minutes): 28.3 · Share commuting 60+ minutes: 10.1% · Commuting workers: 4,349,650 · Commuting workers (margin of error): 15,814 · Aggregate travel time (minutes): 123,275,350 · Aggregate travel time (margin of error): 629,504Hawaii · Mean travel time (minutes): 26.4 · Share commuting 60+ minutes: 8.3% · Commuting workers: 636,184 · Commuting workers (margin of error): 4,604 · Aggregate travel time (minutes): 16,792,765 · Aggregate travel time (margin of error): 157,533Idaho · Mean travel time (minutes): 21.6 · Share commuting 60+ minutes: 5.0% · Commuting workers: 776,942 · Commuting workers (margin of error): 4,983 · Aggregate travel time (minutes): 16,746,260 · Aggregate travel time (margin of error): 183,291Illinois · Mean travel time (minutes): 28.1 · Share commuting 60+ minutes: 10.1% · Commuting workers: 5,284,500 · Commuting workers (margin of error): 15,538 · Aggregate travel time (minutes): 148,440,905 · Aggregate travel time (margin of error): 701,124Indiana · Mean travel time (minutes): 24.0 · Share commuting 60+ minutes: 6.1% · Commuting workers: 2,930,384 · Commuting workers (margin of error): 10,620 · Aggregate travel time (minutes): 70,444,500 · Aggregate travel time (margin of error): 412,801Iowa · Mean travel time (minutes): 19.8 · Share commuting 60+ minutes: 4.1% · Commuting workers: 1,434,389 · Commuting workers (margin of error): 6,323 · Aggregate travel time (minutes): 28,378,175 · Aggregate travel time (margin of error): 224,391Kansas · Mean travel time (minutes): 19.8 · Share commuting 60+ minutes: 3.6% · Commuting workers: 1,294,017 · Commuting workers (margin of error): 5,505 · Aggregate travel time (minutes): 25,567,515 · Aggregate travel time (margin of error): 214,272Kentucky · Mean travel time (minutes): 24.0 · Share commuting 60+ minutes: 6.2% · Commuting workers: 1,820,603 · Commuting workers (margin of error): 8,844 · Aggregate travel time (minutes): 43,734,135 · Aggregate travel time (margin of error): 320,197Louisiana · Mean travel time (minutes): 25.8 · Share commuting 60+ minutes: 8.1% · Commuting workers: 1,845,715 · Commuting workers (margin of error): 9,964 · Aggregate travel time (minutes): 47,566,970 · Aggregate travel time (margin of error): 402,285Maine · Mean travel time (minutes): 24.4 · Share commuting 60+ minutes: 6.9% · Commuting workers: 579,319 · Commuting workers (margin of error): 4,025 · Aggregate travel time (minutes): 14,128,375 · Aggregate travel time (margin of error): 156,613Maryland · Mean travel time (minutes): 31.5 · Share commuting 60+ minutes: 13.2% · Commuting workers: 2,571,863 · Commuting workers (margin of error): 10,030 · Aggregate travel time (minutes): 80,922,360 · Aggregate travel time (margin of error): 443,668Massachusetts · Mean travel time (minutes): 29.3 · Share commuting 60+ minutes: 11.8% · Commuting workers: 3,005,102 · Commuting workers (margin of error): 8,189 · Aggregate travel time (minutes): 87,917,380 · Aggregate travel time (margin of error): 449,257Michigan · Mean travel time (minutes): 24.4 · Share commuting 60+ minutes: 6.2% · Commuting workers: 4,064,208 · Commuting workers (margin of error): 10,725 · Aggregate travel time (minutes): 99,186,210 · Aggregate travel time (margin of error): 470,248Minnesota · Mean travel time (minutes): 23.1 · Share commuting 60+ minutes: 5.1% · Commuting workers: 2,470,078 · Commuting workers (margin of error): 8,441 · Aggregate travel time (minutes): 57,023,715 · Aggregate travel time (margin of error): 261,630Mississippi · Mean travel time (minutes): 25.6 · Share commuting 60+ minutes: 7.7% · Commuting workers: 1,170,679 · Commuting workers (margin of error): 6,732 · Aggregate travel time (minutes): 29,916,530 · Aggregate travel time (margin of error): 312,711Missouri · Mean travel time (minutes): 23.7 · Share commuting 60+ minutes: 5.4% · Commuting workers: 2,597,478 · Commuting workers (margin of error): 9,528 · Aggregate travel time (minutes): 61,430,775 · Aggregate travel time (margin of error): 342,703Montana · Mean travel time (minutes): 19.2 · Share commuting 60+ minutes: 4.8% · Commuting workers: 470,954 · Commuting workers (margin of error): 3,856 · Aggregate travel time (minutes): 9,019,285 · Aggregate travel time (margin of error): 114,265Nebraska · Mean travel time (minutes): 19.1 · Share commuting 60+ minutes: 3.5% · Commuting workers: 907,487 · Commuting workers (margin of error): 3,967 · Aggregate travel time (minutes): 17,371,745 · Aggregate travel time (margin of error): 156,988Nevada · Mean travel time (minutes): 24.8 · Share commuting 60+ minutes: 5.4% · Commuting workers: 1,300,777 · Commuting workers (margin of error): 6,387 · Aggregate travel time (minutes): 32,277,550 · Aggregate travel time (margin of error): 263,105New Hampshire · Mean travel time (minutes): 26.8 · Share commuting 60+ minutes: 9.1% · Commuting workers: 620,733 · Commuting workers (margin of error): 4,169 · Aggregate travel time (minutes): 16,615,880 · Aggregate travel time (margin of error): 208,159New Jersey · Mean travel time (minutes): 30.9 · Share commuting 60+ minutes: 14.2% · Commuting workers: 3,858,660 · Commuting workers (margin of error): 11,545 · Aggregate travel time (minutes): 119,274,795 · Aggregate travel time (margin of error): 657,334New Mexico · Mean travel time (minutes): 23.2 · Share commuting 60+ minutes: 6.6% · Commuting workers: 810,583 · Commuting workers (margin of error): 5,126 · Aggregate travel time (minutes): 18,772,495 · Aggregate travel time (margin of error): 227,208New York · Mean travel time (minutes): 32.8 · Share commuting 60+ minutes: 17.1% · Commuting workers: 8,103,744 · Commuting workers (margin of error): 19,269 · Aggregate travel time (minutes): 266,142,805 · Aggregate travel time (margin of error): 921,890North Carolina · Mean travel time (minutes): 25.1 · Share commuting 60+ minutes: 6.6% · Commuting workers: 4,269,317 · Commuting workers (margin of error): 12,982 · Aggregate travel time (minutes): 107,209,845 · Aggregate travel time (margin of error): 477,738North Dakota · Mean travel time (minutes): 18.0 · Share commuting 60+ minutes: 4.7% · Commuting workers: 375,050 · Commuting workers (margin of error): 2,662 · Aggregate travel time (minutes): 6,753,895 · Aggregate travel time (margin of error): 116,740Ohio · Mean travel time (minutes): 23.6 · Share commuting 60+ minutes: 5.2% · Commuting workers: 4,951,268 · Commuting workers (margin of error): 13,429 · Aggregate travel time (minutes): 116,848,395 · Aggregate travel time (margin of error): 534,046Oklahoma · Mean travel time (minutes): 22.4 · Share commuting 60+ minutes: 5.0% · Commuting workers: 1,648,345 · Commuting workers (margin of error): 4,962 · Aggregate travel time (minutes): 36,910,330 · Aggregate travel time (margin of error): 227,614Oregon · Mean travel time (minutes): 23.2 · Share commuting 60+ minutes: 5.9% · Commuting workers: 1,669,002 · Commuting workers (margin of error): 6,838 · Aggregate travel time (minutes): 38,743,040 · Aggregate travel time (margin of error): 274,387Pennsylvania · Mean travel time (minutes): 26.6 · Share commuting 60+ minutes: 8.4% · Commuting workers: 5,341,881 · Commuting workers (margin of error): 15,035 · Aggregate travel time (minutes): 141,916,520 · Aggregate travel time (margin of error): 598,943Rhode Island · Mean travel time (minutes): 25.5 · Share commuting 60+ minutes: 7.4% · Commuting workers: 481,508 · Commuting workers (margin of error): 4,830 · Aggregate travel time (minutes): 12,262,240 · Aggregate travel time (margin of error): 179,773South Carolina · Mean travel time (minutes): 25.6 · Share commuting 60+ minutes: 6.6% · Commuting workers: 2,143,817 · Commuting workers (margin of error): 10,370 · Aggregate travel time (minutes): 54,950,330 · Aggregate travel time (margin of error): 402,424South Dakota · Mean travel time (minutes): 17.6 · Share commuting 60+ minutes: 3.3% · Commuting workers: 411,185 · Commuting workers (margin of error): 2,803 · Aggregate travel time (minutes): 7,240,810 · Aggregate travel time (margin of error): 98,307Tennessee · Mean travel time (minutes): 25.7 · Share commuting 60+ minutes: 7.0% · Commuting workers: 2,885,193 · Commuting workers (margin of error): 9,455 · Aggregate travel time (minutes): 74,022,195 · Aggregate travel time (margin of error): 393,147Texas · Mean travel time (minutes): 26.7 · Share commuting 60+ minutes: 8.2% · Commuting workers: 12,196,153 · Commuting workers (margin of error): 26,866 · Aggregate travel time (minutes): 325,128,075 · Aggregate travel time (margin of error): 1,129,828Utah · Mean travel time (minutes): 22.0 · Share commuting 60+ minutes: 4.7% · Commuting workers: 1,386,877 · Commuting workers (margin of error): 6,531 · Aggregate travel time (minutes): 30,496,035 · Aggregate travel time (margin of error): 255,319Vermont · Mean travel time (minutes): 23.4 · Share commuting 60+ minutes: 5.8% · Commuting workers: 280,894 · Commuting workers (margin of error): 2,703 · Aggregate travel time (minutes): 6,579,490 · Aggregate travel time (margin of error): 81,792Virginia · Mean travel time (minutes): 27.6 · Share commuting 60+ minutes: 9.2% · Commuting workers: 3,608,428 · Commuting workers (margin of error): 11,473 · Aggregate travel time (minutes): 99,473,725 · Aggregate travel time (margin of error): 440,621Washington · Mean travel time (minutes): 27.0 · Share commuting 60+ minutes: 9.1% · Commuting workers: 3,086,602 · Commuting workers (margin of error): 11,164 · Aggregate travel time (minutes): 83,194,470 · Aggregate travel time (margin of error): 402,464West Virginia · Mean travel time (minutes): 26.6 · Share commuting 60+ minutes: 9.7% · Commuting workers: 670,435 · Commuting workers (margin of error): 4,598 · Aggregate travel time (minutes): 17,836,120 · Aggregate travel time (margin of error): 212,366Wisconsin · Mean travel time (minutes): 22.2 · Share commuting 60+ minutes: 4.8% · Commuting workers: 2,625,866 · Commuting workers (margin of error): 8,190 · Aggregate travel time (minutes): 58,354,165 · Aggregate travel time (margin of error): 264,478Wyoming · Mean travel time (minutes): 18.5 · Share commuting 60+ minutes: 5.9% · Commuting workers: 258,616 · Commuting workers (margin of error): 2,524 · Aggregate travel time (minutes): 4,790,360 · Aggregate travel time (margin of error): 118,275District of Columbia · Mean travel time (minutes): 30.3 · Share commuting 60+ minutes: 8.2% · Commuting workers: 260,295 · Commuting workers (margin of error): 3,361 · Aggregate travel time (minutes): 7,881,480 · Aggregate travel time (margin of error): 144,002District of Columbia · Mean travel time (minutes): 30.3 · Share commuting 60+ minutes: 8.2% · Commuting workers: 260,295 · Commuting workers (margin of error): 3,361 · Aggregate travel time (minutes): 7,881,480 · Aggregate travel time (margin of error): 144,002Mean travel time (minutes)17.632.8
Summary

Darker amber is a longer mean one-way commute. Puerto Rico is listed in the ranking and table but is not on this map.

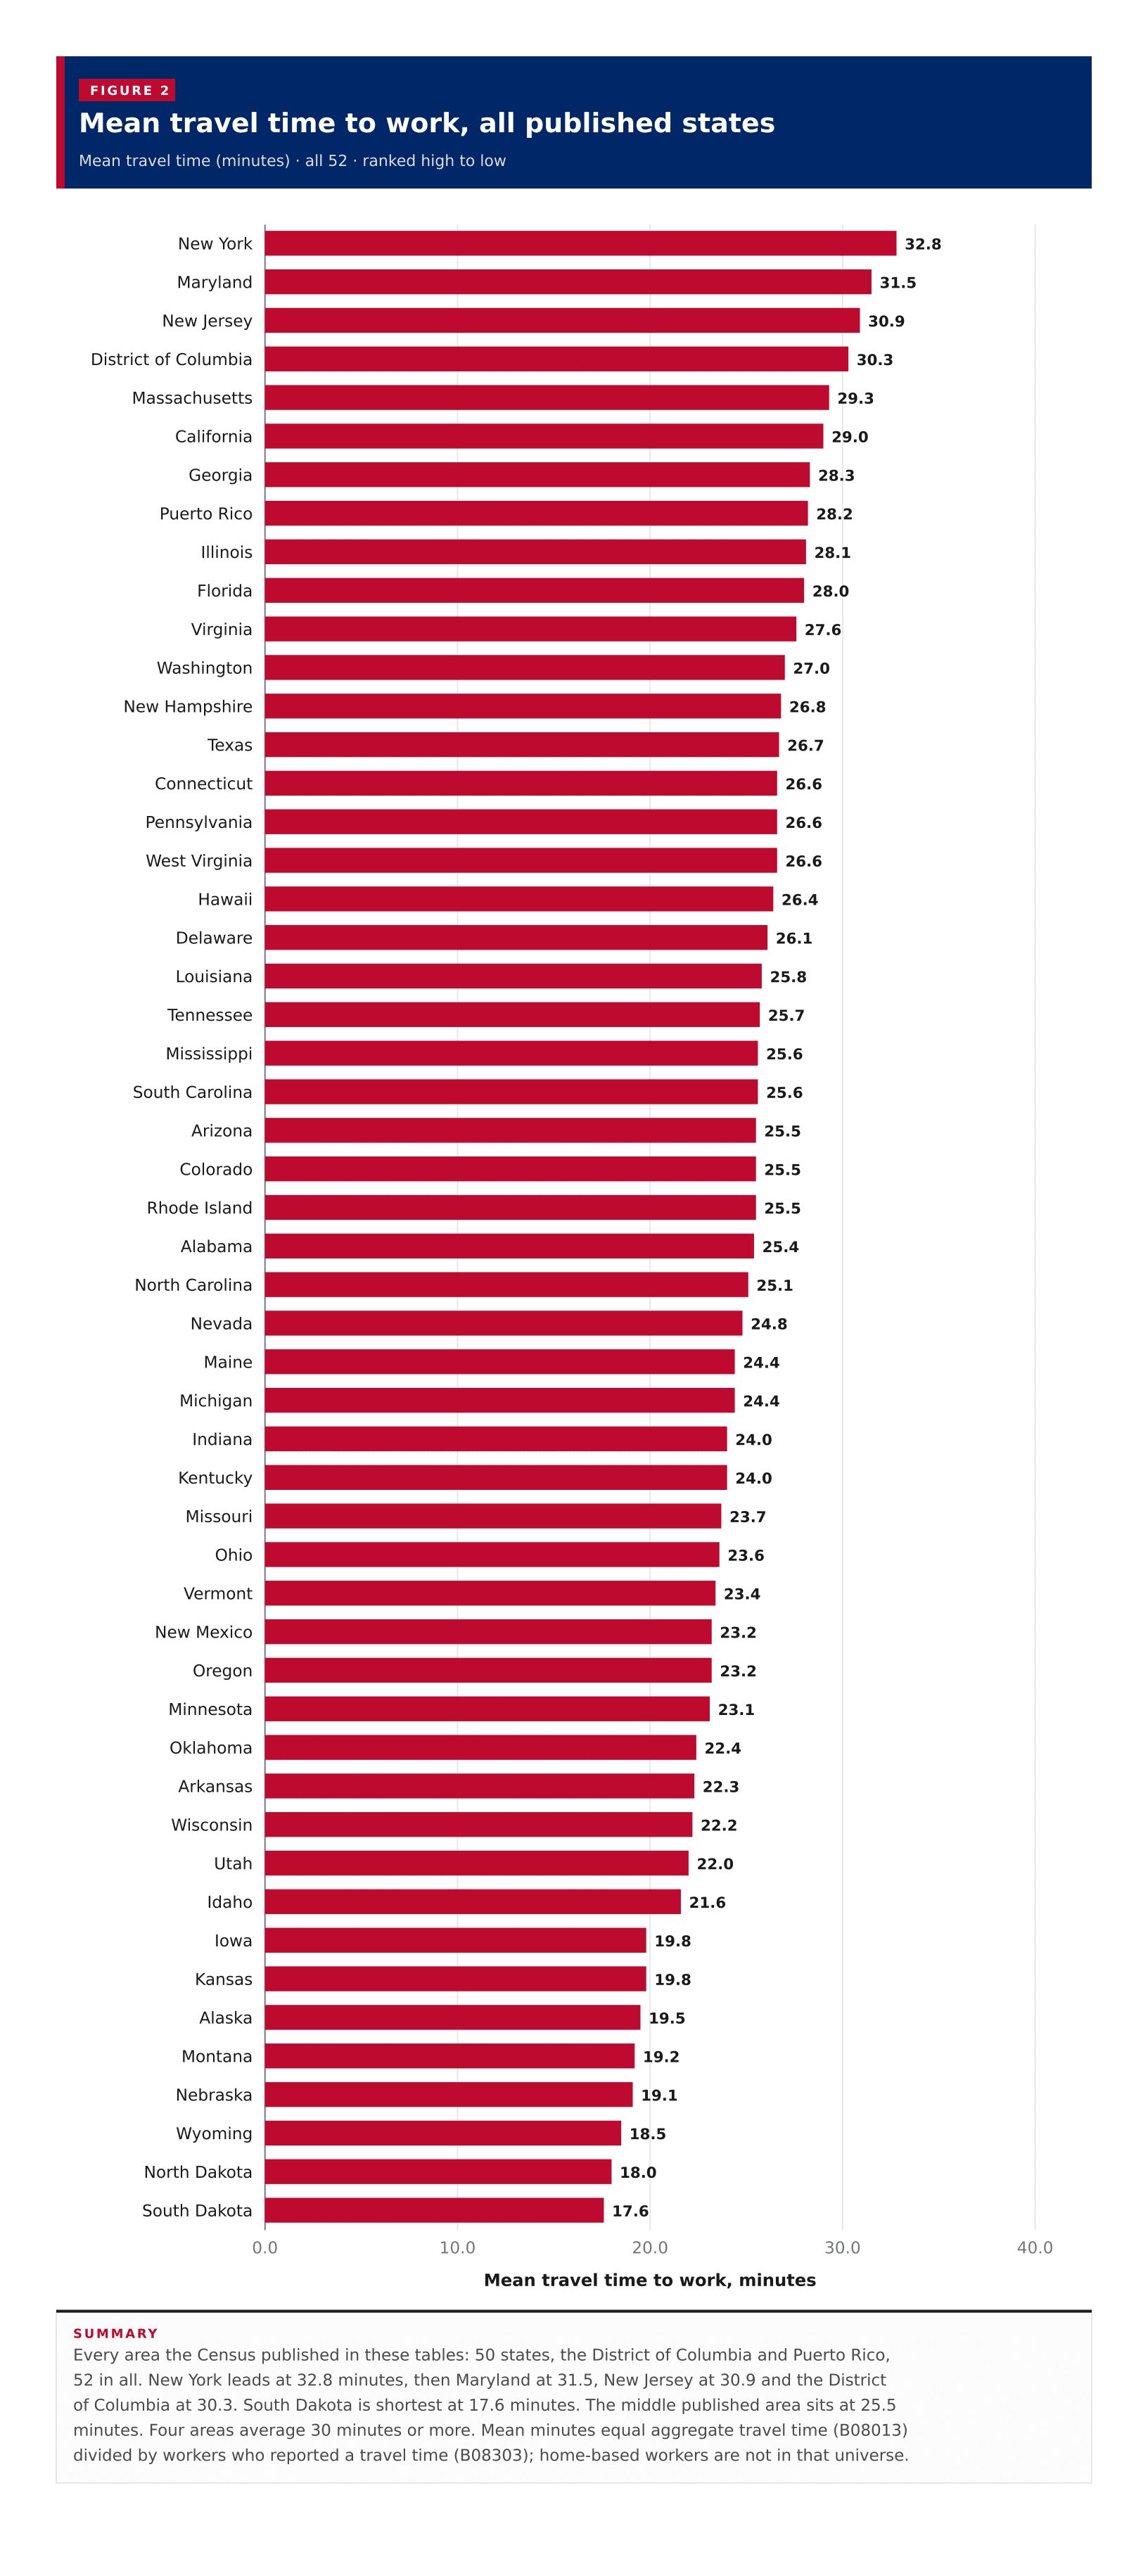
A typical published area has a mean travel time to work of 25.5 minutes, the midpoint of the 50 states, the District of Columbia and Puerto Rico on the 2023 ACS five-year estimates. New York has the longest mean commute at 32.8 minutes, followed by Maryland at 31.5 and New Jersey at 30.9. South Dakota is shortest at 17.6 minutes. Four areas average 30 minutes or more. A midpoint of state means is not a United States commute time; it treats each published area equally and is not weighted by how many workers live there.

In short

25.5 mintypical published areamidpoint of state means, not a US figure
32.8 minNew Yorklongest mean travel time to work
17.6 minSouth Dakotashortest of the published areas
4areas averaging 30+ minutesNew York, Maryland, New Jersey and District of Columbia
17.1%New York at 60+ minuteshighest share with a one-way trip of an hour or more
Figure 1

Mean travel time to work, all published states

Mean travel time (minutes) · all 52 · ranked high to low

52 items
View100%
DownloadPDFImageCSV
Mean travel time to work, all published statesEvery area the Census published in these tables: 50 states, the District of Columbia and Puerto Rico, 52 in all. New York leads at 32.8 minutes, then Maryland at 31.5, New Jersey at 30.9 and the District of Columbia at 30.3. South Dakota is shortest at 17.6 minutes. The middle published area sits at 25.5 minutes. Four areas average 30 minutes or more. Mean minutes equal aggregate travel time (B08013) divided by workers who reported a travel time (B08303); home-based workers are not in that universe.0.010.020.030.040.0Mean travel time to work, minutes32.8New York31.5Maryland30.9New Jersey30.3District of Columbia29.3Massachusetts29.0California28.3Georgia28.2Puerto Rico28.1Illinois28.0Florida27.6Virginia27.0Washington26.8New Hampshire26.7Texas26.6Connecticut26.6Pennsylvania26.6West Virginia26.4Hawaii26.1Delaware25.8Louisiana25.7Tennessee25.6Mississippi25.6South Carolina25.5Arizona25.5Colorado25.5Rhode Island25.4Alabama25.1North Carolina24.8Nevada24.4Maine24.4Michigan24.0Indiana24.0Kentucky23.7Missouri23.6Ohio23.4Vermont23.2New Mexico23.2Oregon23.1Minnesota22.4Oklahoma22.3Arkansas22.2Wisconsin22.0Utah21.6Idaho19.8Iowa19.8Kansas19.5Alaska19.2Montana19.1Nebraska18.5Wyoming18.0North Dakota17.6South Dakota
Summary

Every area the Census published in these tables: 50 states, the District of Columbia and Puerto Rico, 52 in all. New York leads at 32.8 minutes, then Maryland at 31.5, New Jersey at 30.9 and the District of Columbia at 30.3. South Dakota is shortest at 17.6 minutes. The middle published area sits at 25.5 minutes. Four areas average 30 minutes or more. Mean minutes equal aggregate travel time (B08013) divided by workers who reported a travel time (B08303); home-based workers are not in that universe.

Figure 2

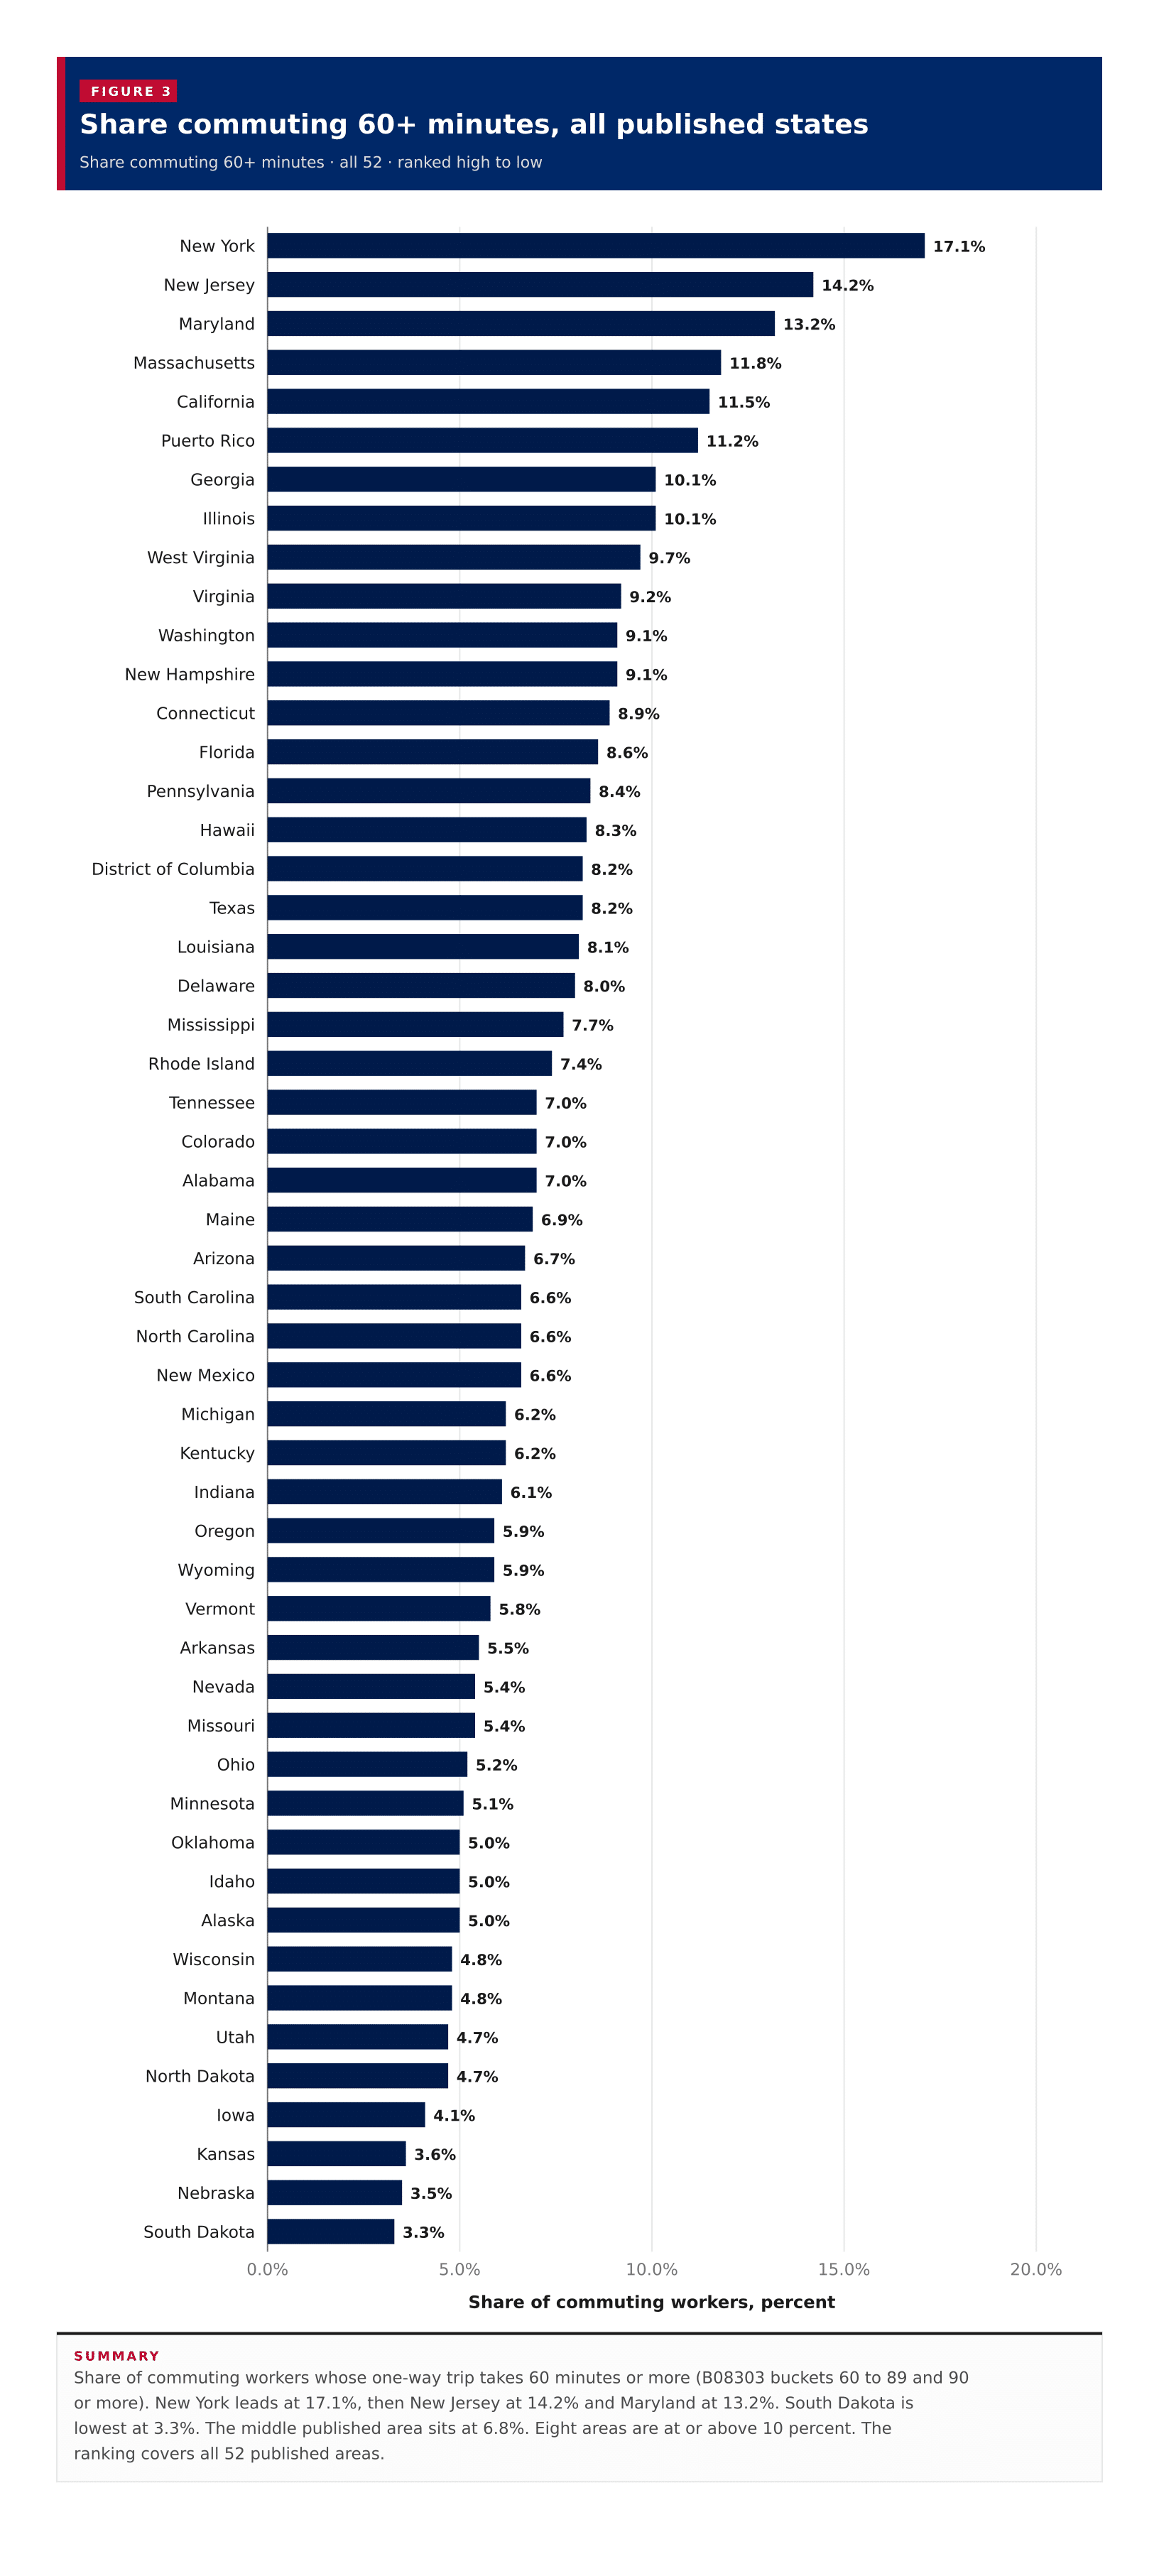
Share commuting 60+ minutes, all published states

Share commuting 60+ minutes · all 52 · ranked high to low

52 items
View100%
DownloadPDFImageCSV
Share commuting 60+ minutes, all published statesShare of commuting workers whose one-way trip takes 60 minutes or more (B08303 buckets 60 to 89 and 90 or more). New York leads at 17.1%, then New Jersey at 14.2% and Maryland at 13.2%. South Dakota is lowest at 3.3%. The middle published area sits at 6.8%. Eight areas are at or above 10 percent. The ranking covers all 52 published areas.0.0%5.0%10.0%15.0%20.0%Share of commuting workers, percent17.1%New York14.2%New Jersey13.2%Maryland11.8%Massachusetts11.5%California11.2%Puerto Rico10.1%Georgia10.1%Illinois9.7%West Virginia9.2%Virginia9.1%Washington9.1%New Hampshire8.9%Connecticut8.6%Florida8.4%Pennsylvania8.3%Hawaii8.2%District of Columbia8.2%Texas8.1%Louisiana8.0%Delaware7.7%Mississippi7.4%Rhode Island7.0%Tennessee7.0%Colorado7.0%Alabama6.9%Maine6.7%Arizona6.6%South Carolina6.6%North Carolina6.6%New Mexico6.2%Michigan6.2%Kentucky6.1%Indiana5.9%Oregon5.9%Wyoming5.8%Vermont5.5%Arkansas5.4%Nevada5.4%Missouri5.2%Ohio5.1%Minnesota5.0%Oklahoma5.0%Idaho5.0%Alaska4.8%Wisconsin4.8%Montana4.7%Utah4.7%North Dakota4.1%Iowa3.6%Kansas3.5%Nebraska3.3%South Dakota
Summary

Share of commuting workers whose one-way trip takes 60 minutes or more (B08303 buckets 60 to 89 and 90 or more). New York leads at 17.1%, then New Jersey at 14.2% and Maryland at 13.2%. South Dakota is lowest at 3.3%. The middle published area sits at 6.8%. Eight areas are at or above 10 percent. The ranking covers all 52 published areas.

Figure 3

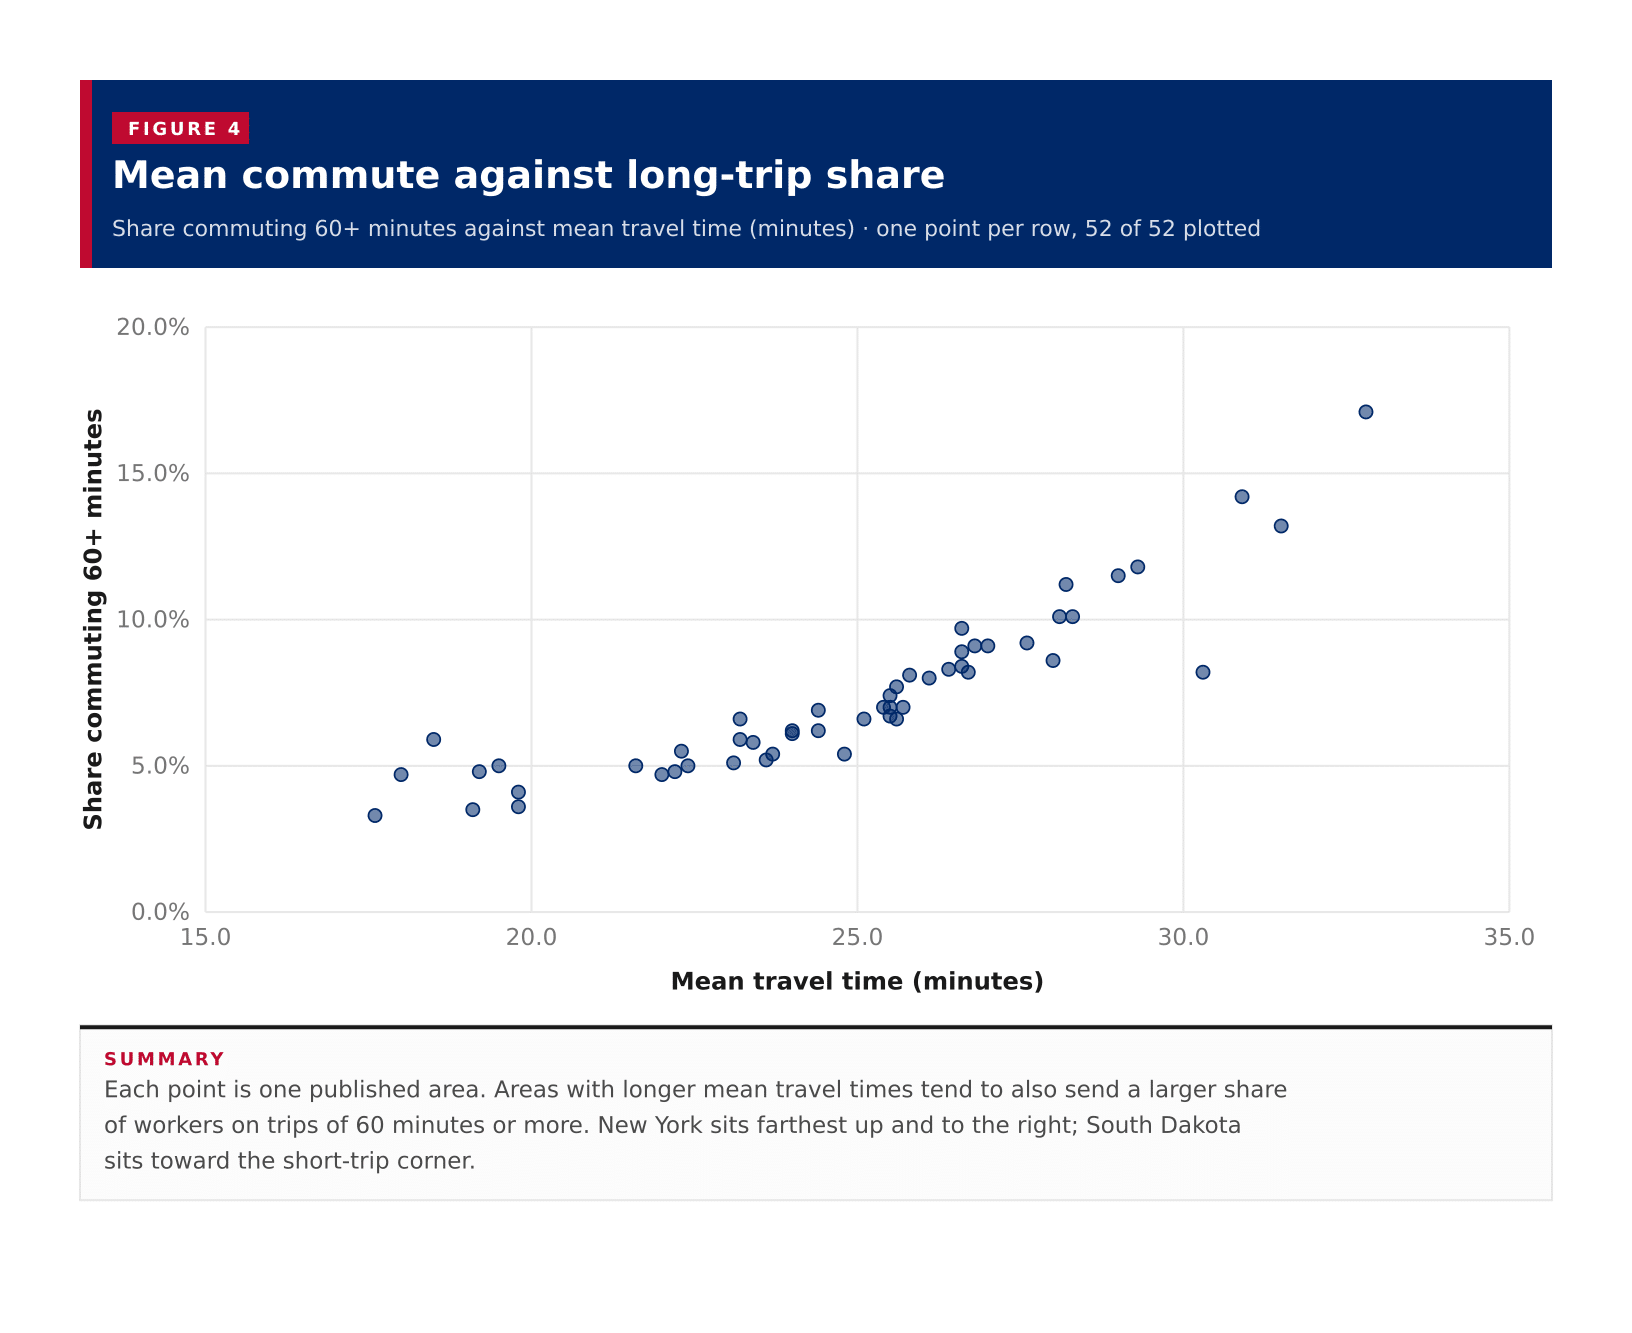
Mean commute against long-trip share

Share commuting 60+ minutes against mean travel time (minutes) · one point per row, 52 of 52 plotted

52 items
View100%
DownloadPDFImageCSV
Mean commute against long-trip shareEach point is one published area. Areas with longer mean travel times tend to also send a larger share of workers on trips of 60 minutes or more. New York sits farthest up and to the right; South Dakota sits toward the short-trip corner.0.0%5.0%10.0%15.0%20.0%15.020.025.030.035.0Share commuting 60+ minutesMean travel time (minutes)
Summary

Each point is one published area. Areas with longer mean travel times tend to also send a larger share of workers on trips of 60 minutes or more. New York sits farthest up and to the right; South Dakota sits toward the short-trip corner.

Table 1

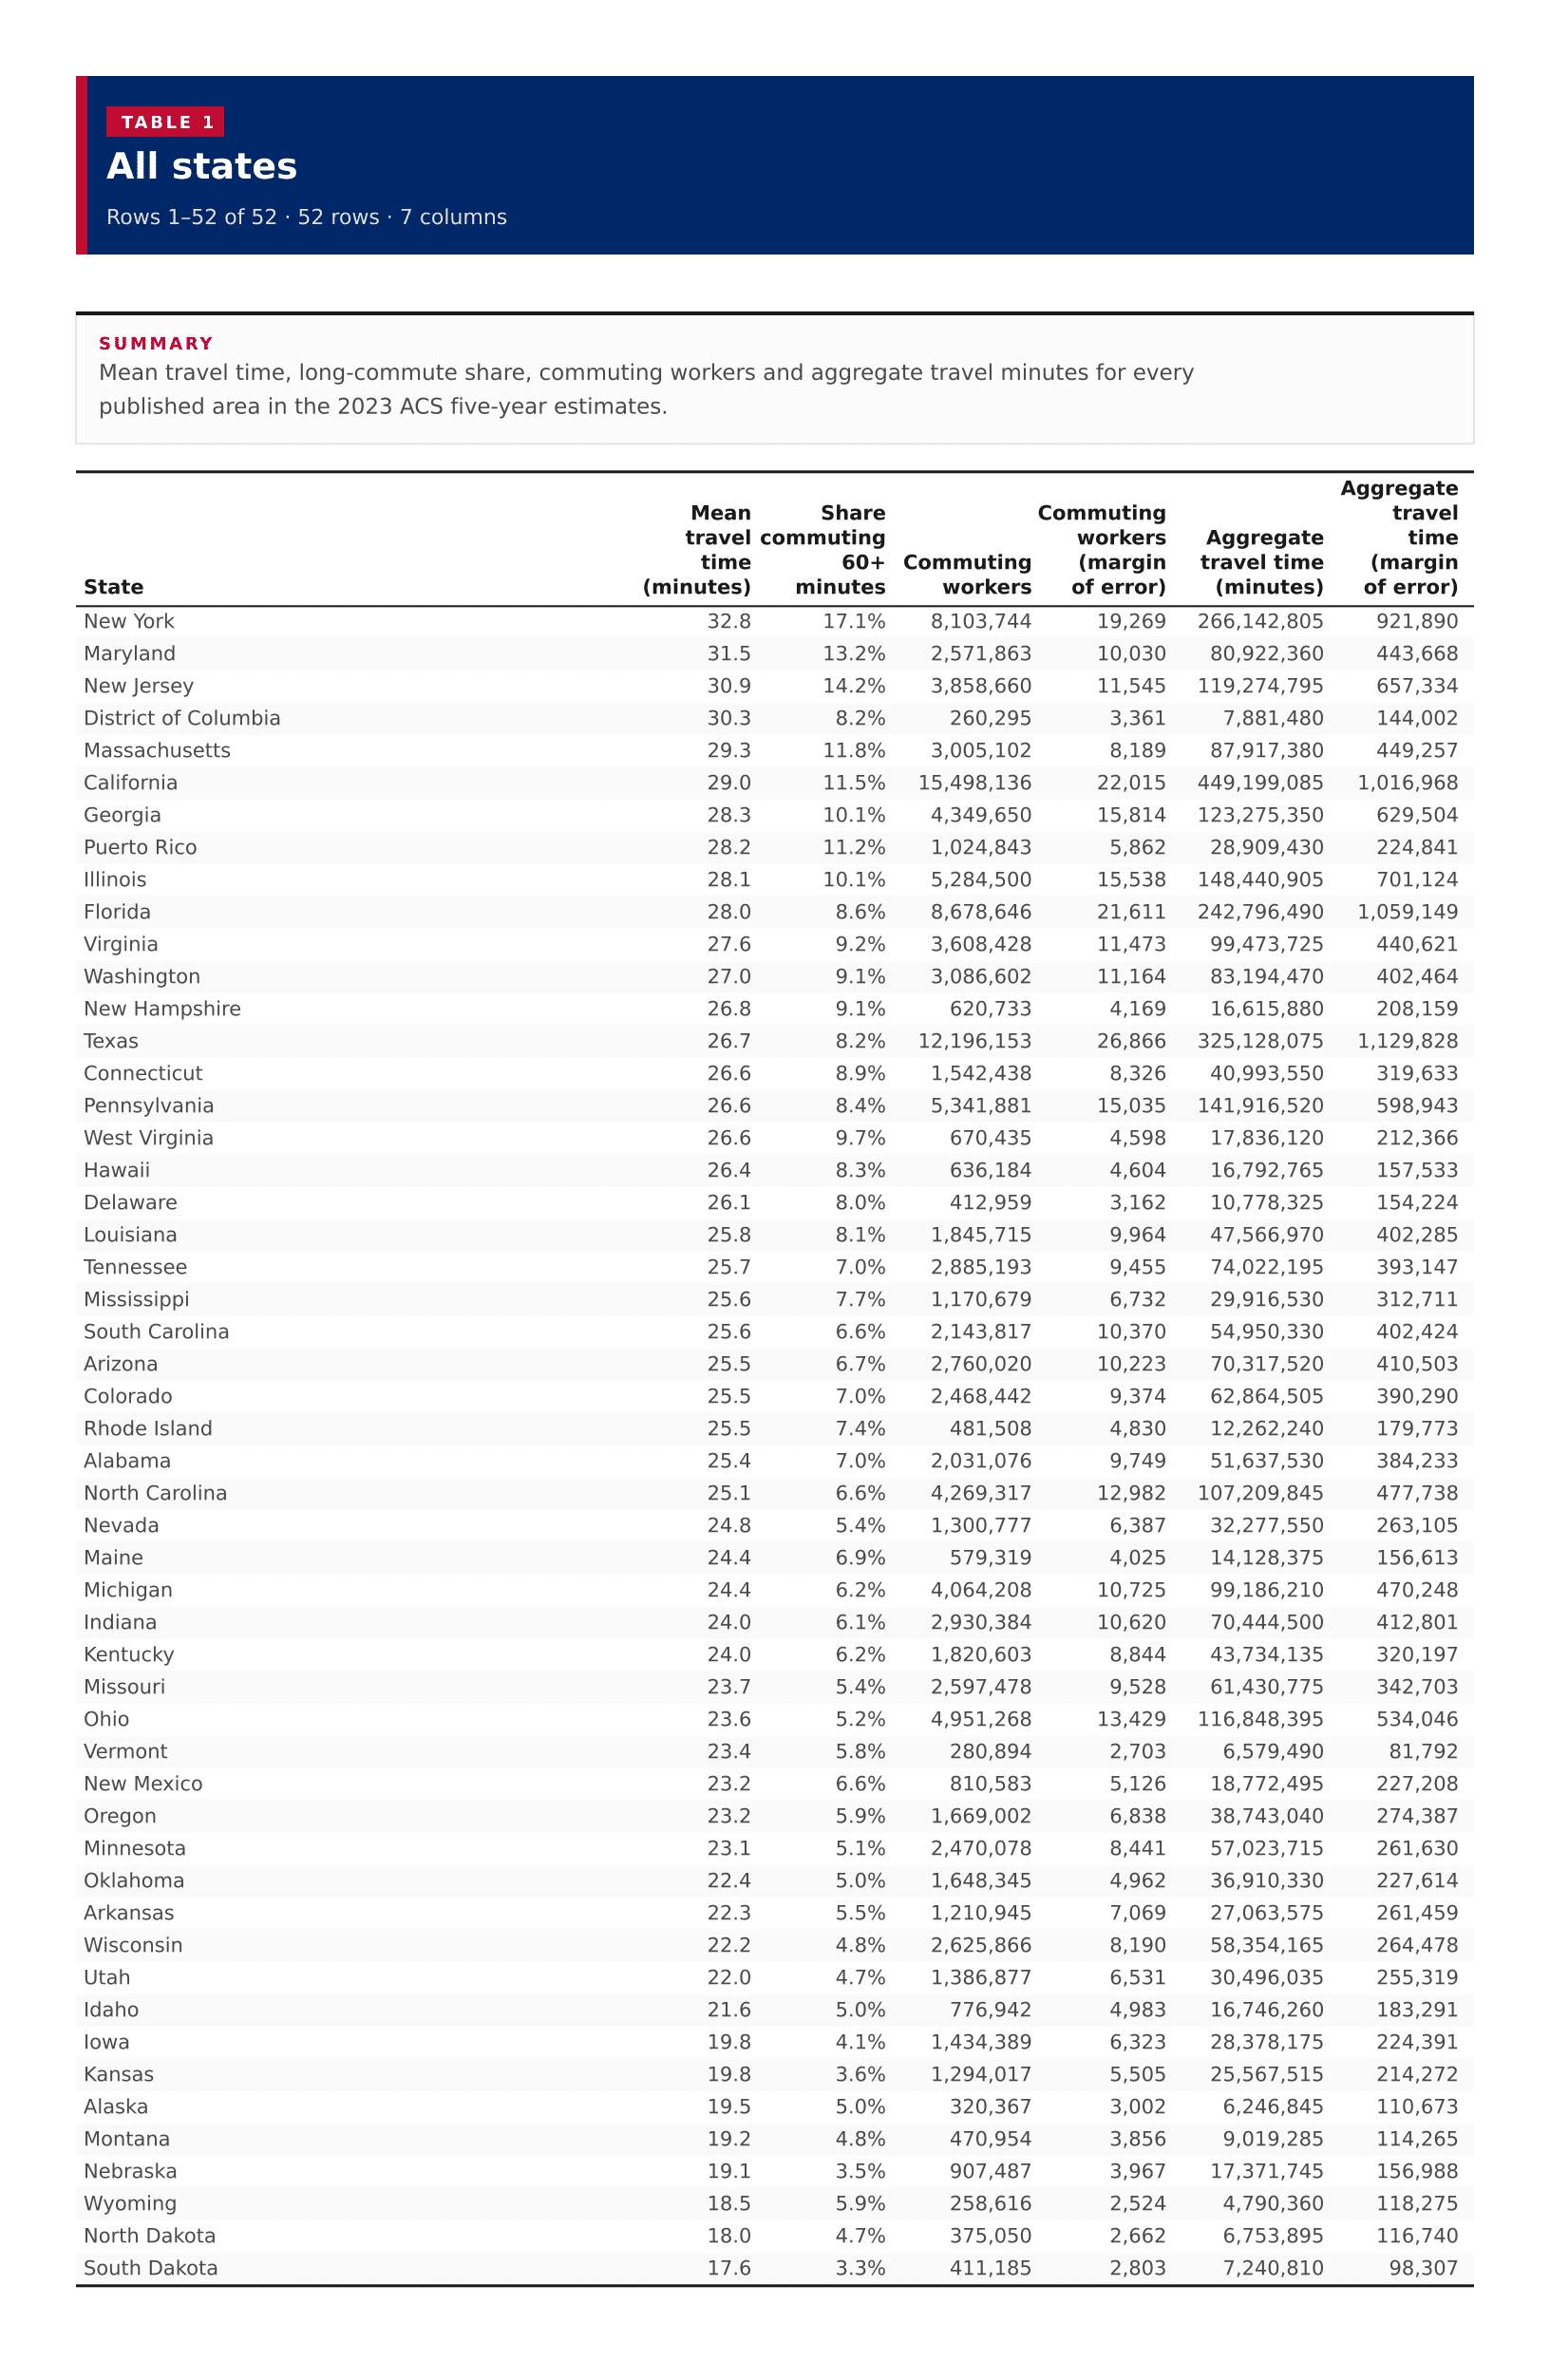
All states

52 rows · 7 columns

52 rows
View100%
DownloadPDFImageCSV
Summary

Mean travel time, long-commute share, commuting workers and aggregate travel minutes for every published area in the 2023 ACS five-year estimates.

All states
??????
New York32.817.1%8,103,74419,269266,142,805921,890
Maryland31.513.2%2,571,86310,03080,922,360443,668
New Jersey30.914.2%3,858,66011,545119,274,795657,334
District of Columbia30.38.2%260,2953,3617,881,480144,002
Massachusetts29.311.8%3,005,1028,18987,917,380449,257
California29.011.5%15,498,13622,015449,199,0851,016,968
Georgia28.310.1%4,349,65015,814123,275,350629,504
Puerto Rico28.211.2%1,024,8435,86228,909,430224,841
Illinois28.110.1%5,284,50015,538148,440,905701,124
Florida28.08.6%8,678,64621,611242,796,4901,059,149
Virginia27.69.2%3,608,42811,47399,473,725440,621
Washington27.09.1%3,086,60211,16483,194,470402,464
New Hampshire26.89.1%620,7334,16916,615,880208,159
Texas26.78.2%12,196,15326,866325,128,0751,129,828
Connecticut26.68.9%1,542,4388,32640,993,550319,633
Pennsylvania26.68.4%5,341,88115,035141,916,520598,943
West Virginia26.69.7%670,4354,59817,836,120212,366
Hawaii26.48.3%636,1844,60416,792,765157,533
Delaware26.18.0%412,9593,16210,778,325154,224
Louisiana25.88.1%1,845,7159,96447,566,970402,285
Tennessee25.77.0%2,885,1939,45574,022,195393,147
Mississippi25.67.7%1,170,6796,73229,916,530312,711
South Carolina25.66.6%2,143,81710,37054,950,330402,424
Arizona25.56.7%2,760,02010,22370,317,520410,503
Colorado25.57.0%2,468,4429,37462,864,505390,290
Rhode Island25.57.4%481,5084,83012,262,240179,773
Alabama25.47.0%2,031,0769,74951,637,530384,233
North Carolina25.16.6%4,269,31712,982107,209,845477,738
Nevada24.85.4%1,300,7776,38732,277,550263,105
Maine24.46.9%579,3194,02514,128,375156,613
Michigan24.46.2%4,064,20810,72599,186,210470,248
Indiana24.06.1%2,930,38410,62070,444,500412,801
Kentucky24.06.2%1,820,6038,84443,734,135320,197
Missouri23.75.4%2,597,4789,52861,430,775342,703
Ohio23.65.2%4,951,26813,429116,848,395534,046
Vermont23.45.8%280,8942,7036,579,49081,792
New Mexico23.26.6%810,5835,12618,772,495227,208
Oregon23.25.9%1,669,0026,83838,743,040274,387
Minnesota23.15.1%2,470,0788,44157,023,715261,630
Oklahoma22.45.0%1,648,3454,96236,910,330227,614
Arkansas22.35.5%1,210,9457,06927,063,575261,459
Wisconsin22.24.8%2,625,8668,19058,354,165264,478
Utah22.04.7%1,386,8776,53130,496,035255,319
Idaho21.65.0%776,9424,98316,746,260183,291
Iowa19.84.1%1,434,3896,32328,378,175224,391
Kansas19.83.6%1,294,0175,50525,567,515214,272
Alaska19.55.0%320,3673,0026,246,845110,673
Montana19.24.8%470,9543,8569,019,285114,265
Nebraska19.13.5%907,4873,96717,371,745156,988
Wyoming18.55.9%258,6162,5244,790,360118,275
North Dakota18.04.7%375,0502,6626,753,895116,740
South Dakota17.63.3%411,1852,8037,240,81098,307

Image files

Download all

Figure 1

Mean travel time to work, US states
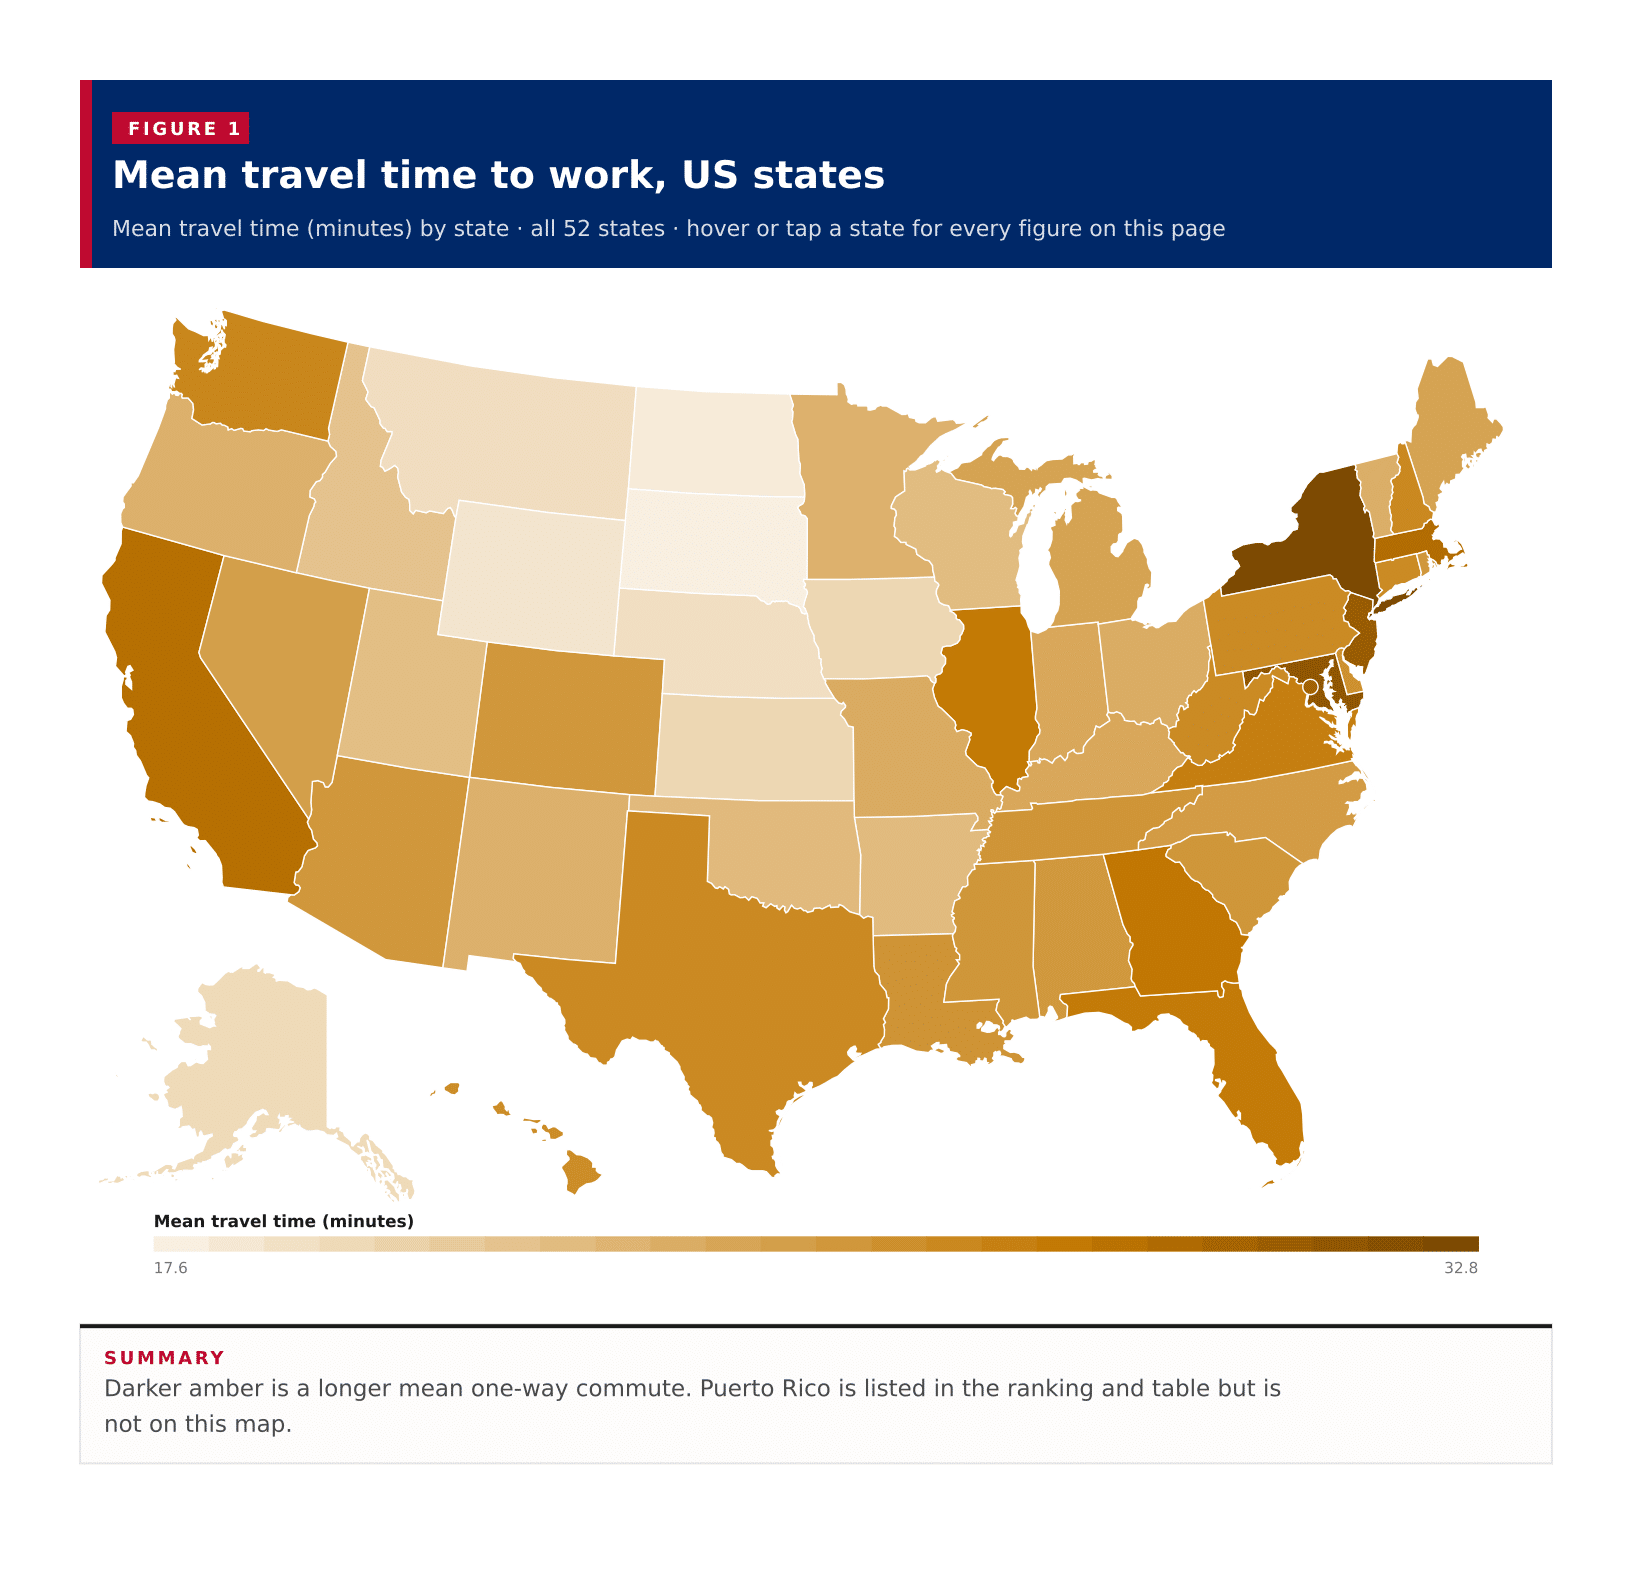
Figure 1: Mean travel time to work, US states
DownloadPDFImageCSV

Figure 2

Mean travel time to work, all published states

Figure 2: Mean travel time to work, all published states
DownloadPDFImageCSV

Figure 3

Share commuting 60+ minutes, all published states

Figure 3: Share commuting 60+ minutes, all published states
DownloadPDFImageCSV

Figure 4

Mean commute against long-trip share

Figure 4: Mean commute against long-trip share
DownloadPDFImageCSV

About this data

  • Mean travel time to work is aggregate travel time in minutes (B08013) divided by workers 16 years and over who did not work from home and reported a travel time (B08303). It is a mean for commuting workers in each area, not a median.
  • A midpoint of state means treats each published area equally. It is not a United States commute time and is not weighted by the number of workers.
  • The long-commute share is workers with a one-way trip of 60 minutes or more (B08303_012E plus B08303_013E) divided by the B08303 total.
  • The Census published 50 states, the District of Columbia and Puerto Rico. None of the means were suppressed. Alaska and Hawaii appear in the ranking and table; on the map they are shown in the usual inset positions.
  • ACS special values such as -555555555 are controlled estimates with no sampling margin of error; those cells are left blank.