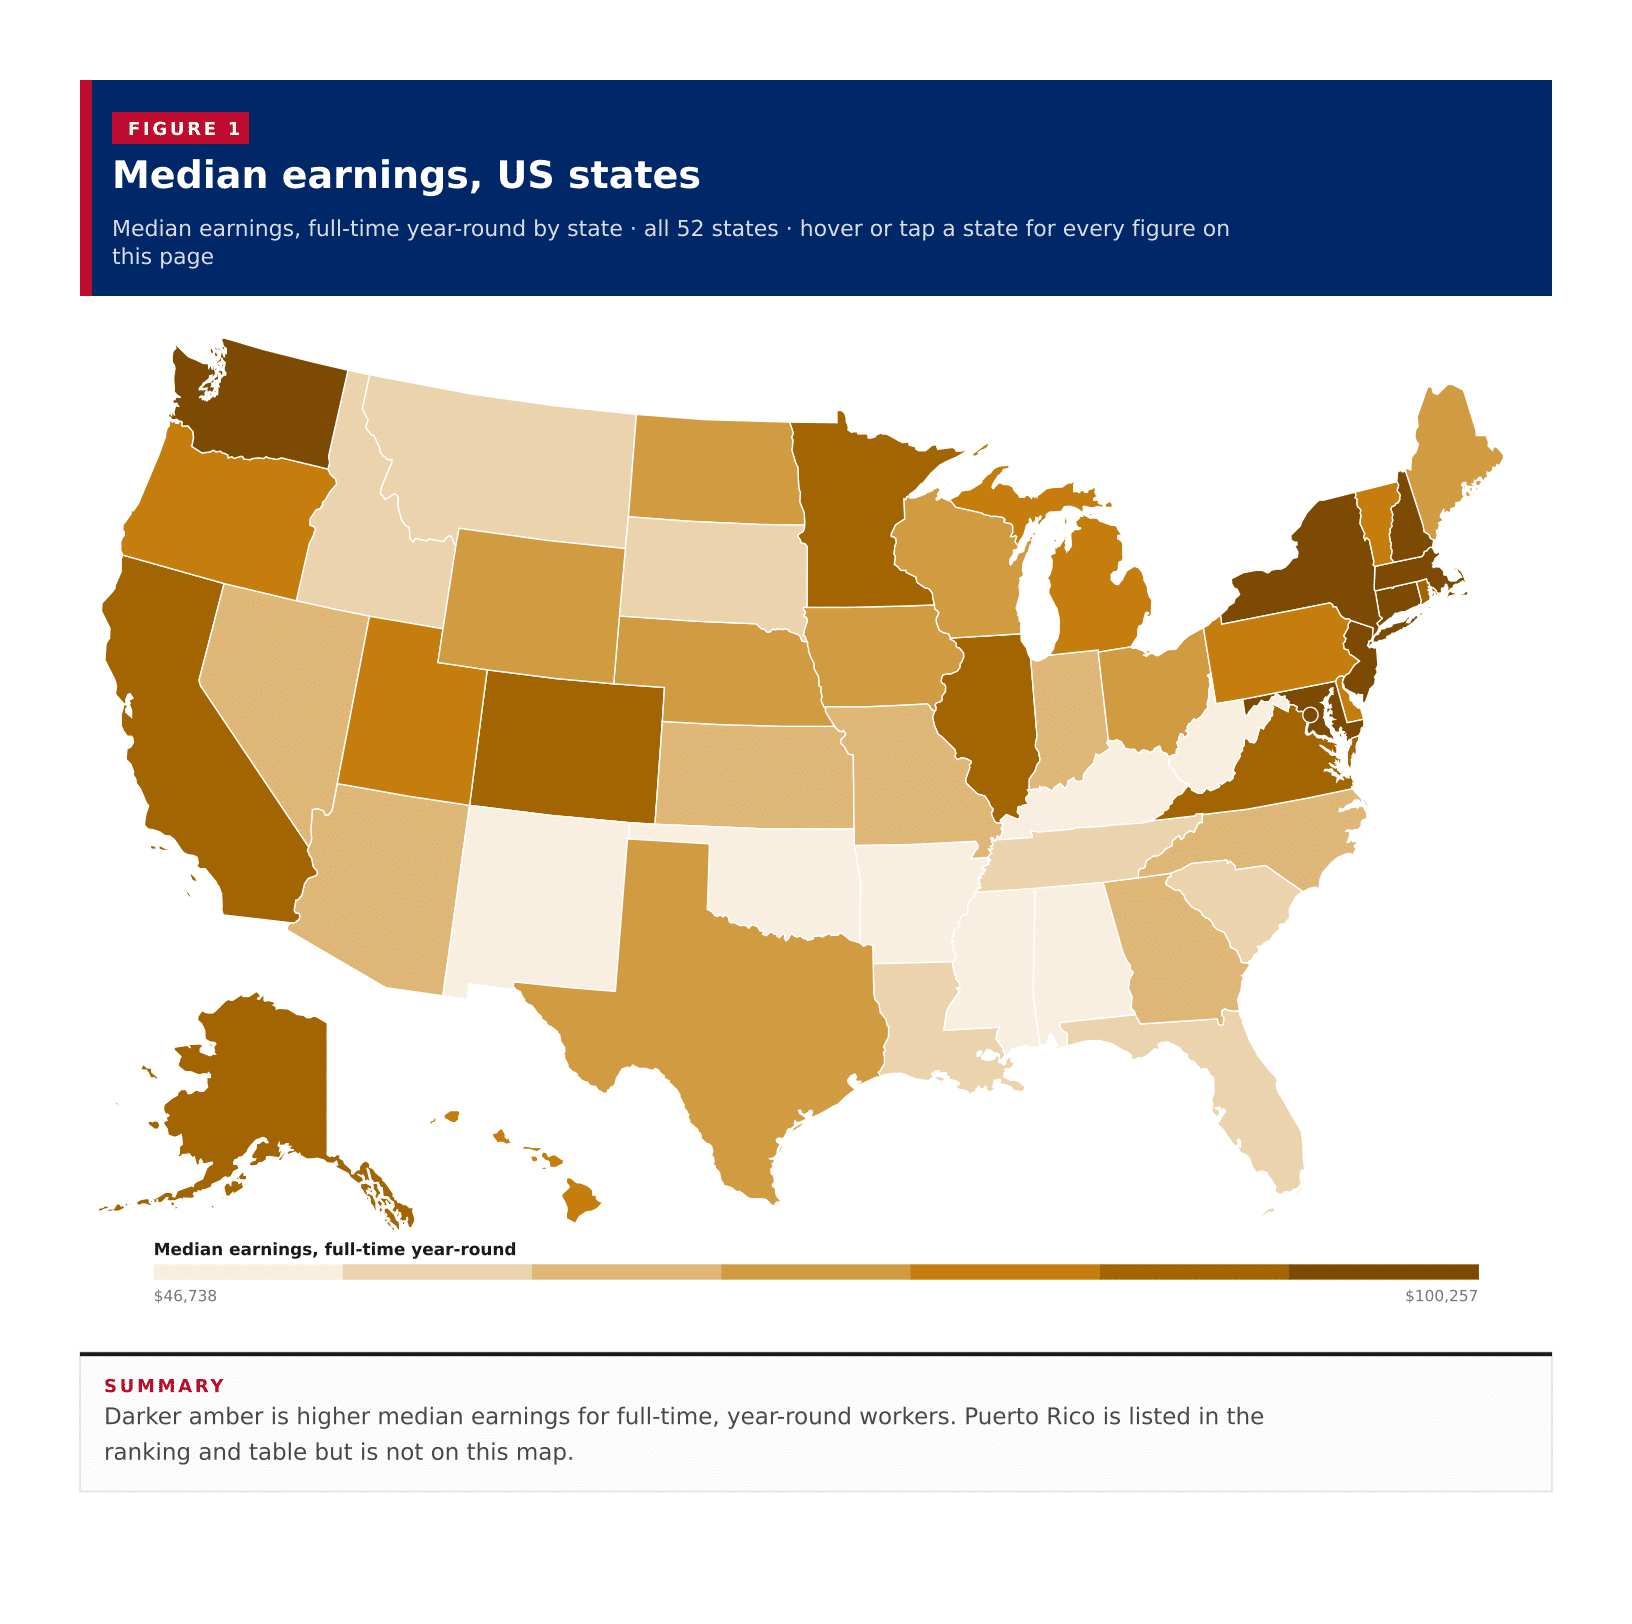
Darker amber is higher median earnings for full-time, year-round workers. Puerto Rico is listed in the ranking and table but is not on this map.
A typical published area has median earnings of $57,365 for people who worked full-time, year-round, the midpoint of the 50 states, the District of Columbia and Puerto Rico on the 2023 ACS five-year estimates. The District of Columbia leads at $100,257, and Massachusetts, New Jersey, Maryland, Connecticut and Washington also clear $70,000. Mississippi is the lowest of the 50 states at $46,738. Puerto Rico, which this table also returns, sits far lower at $27,624. The District of Columbia is $53,519 above Mississippi and $72,633 above Puerto Rico. These are medians for full-time, year-round workers in each area in 2023 inflation-adjusted dollars, not a mean salary and not a national average of people.
In short
$57,365typical published areathe middle of the published areas, not an average of workers
$100,257District of Columbiahighest full-time median earnings
$46,738Mississippilowest of the 50 states
$27,624Puerto Ricolowest figure the Census published
6areas at or above $70,000District of Columbia, Massachusetts, New Jersey, Maryland, Connecticut and Washington
Figure 1
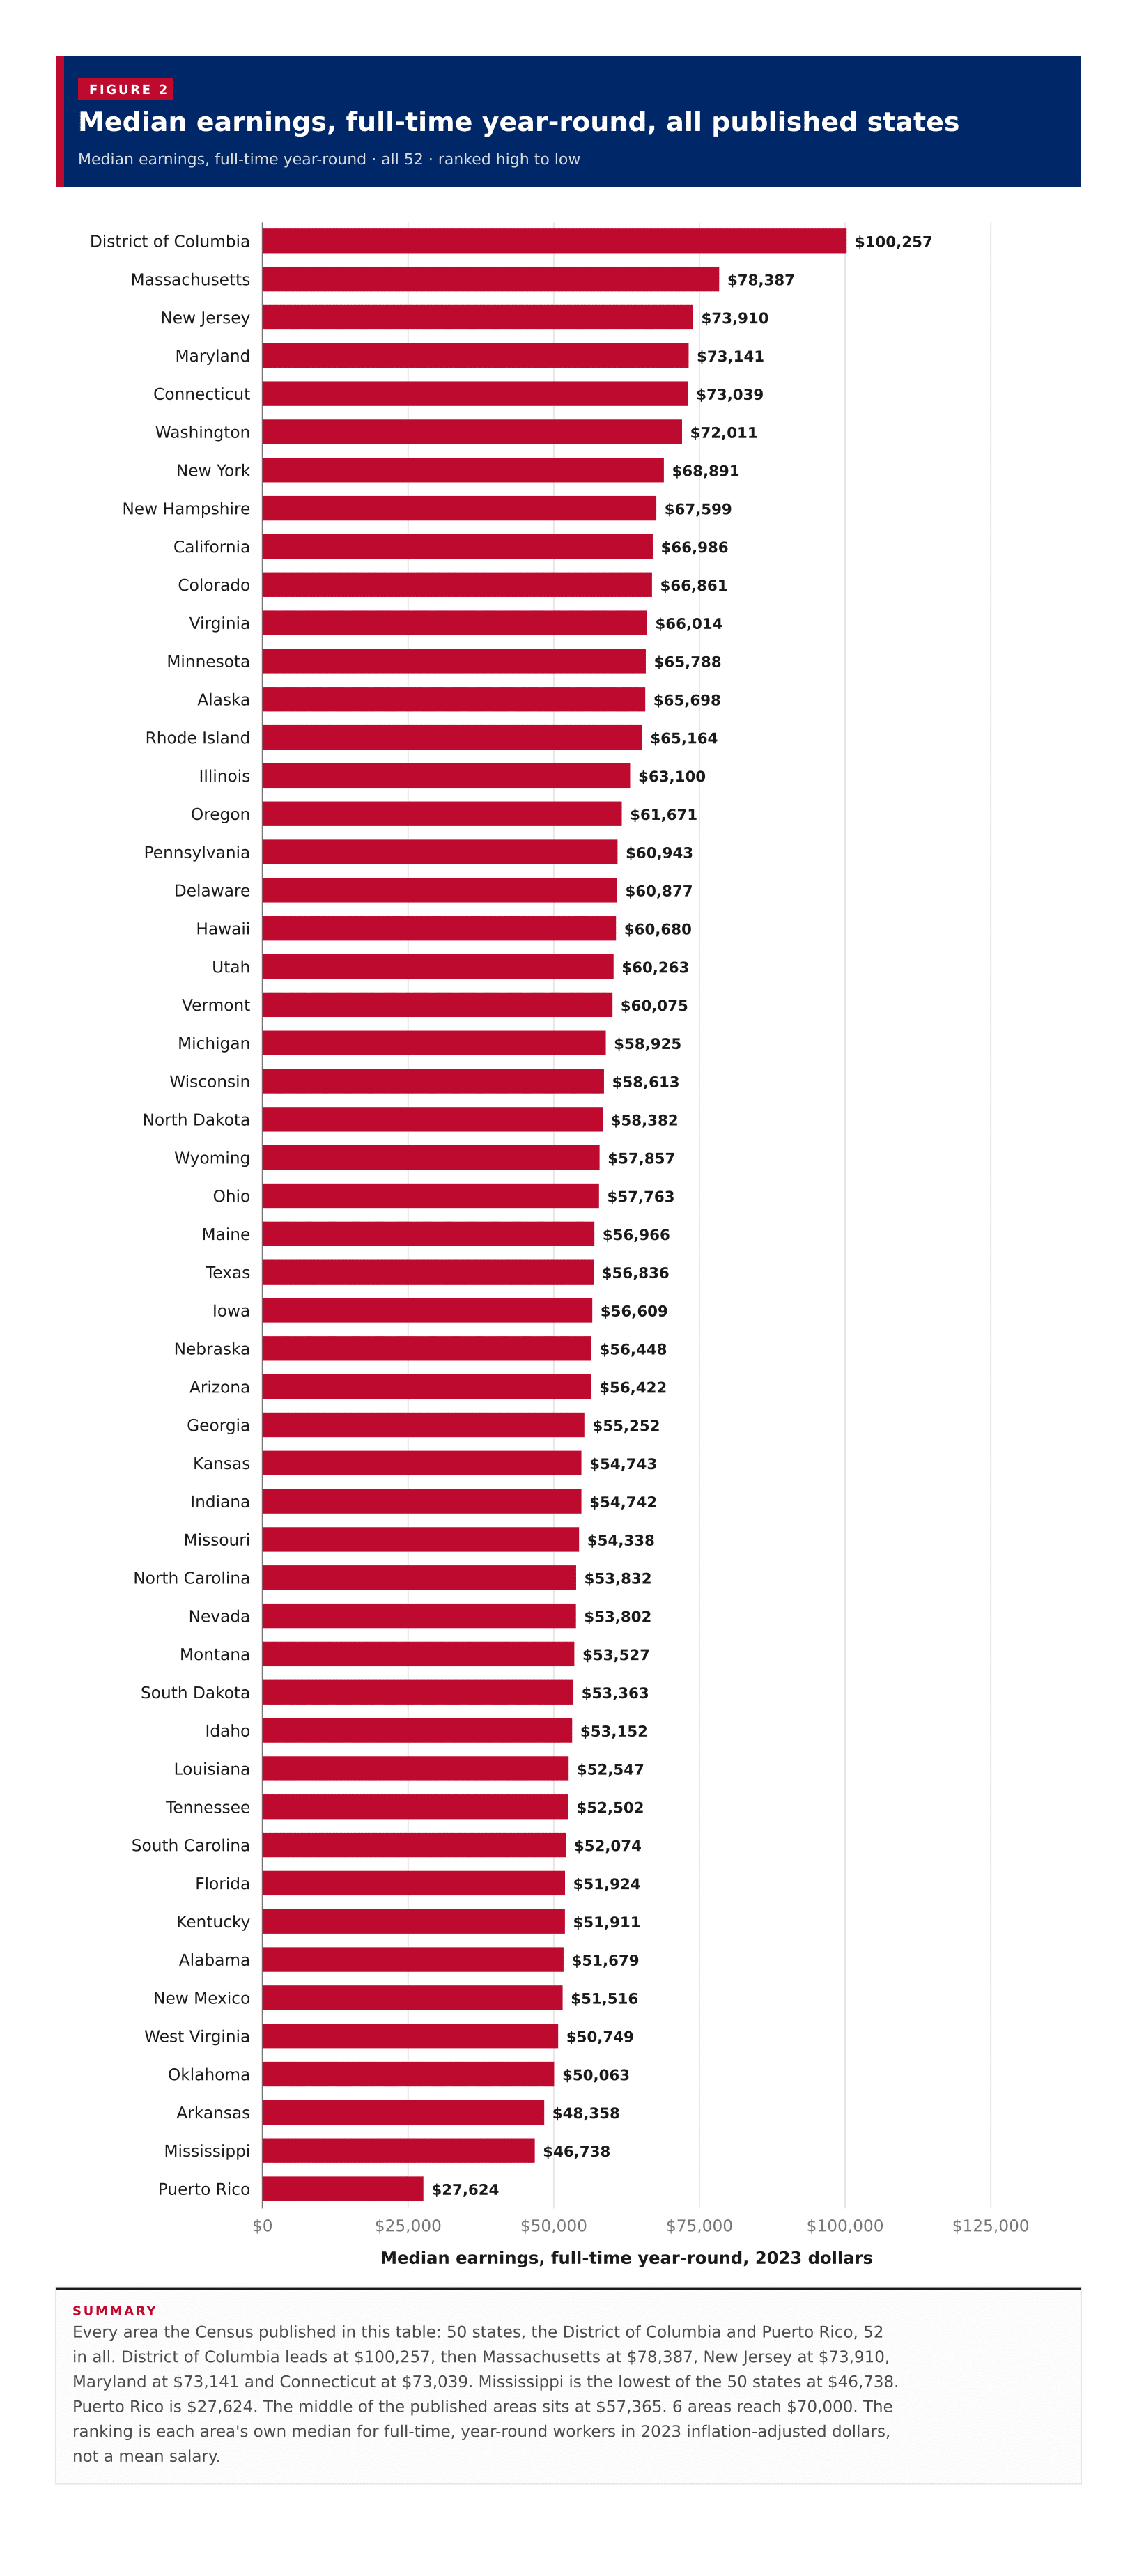
Median earnings, full-time year-round, all published states
Median earnings, full-time year-round · all 52 · ranked high to low
Every area the Census published in this table: 50 states, the District of Columbia and Puerto Rico, 52 in all. District of Columbia leads at $100,257, then Massachusetts at $78,387, New Jersey at $73,910, Maryland at $73,141 and Connecticut at $73,039. Mississippi is the lowest of the 50 states at $46,738. Puerto Rico is $27,624. The middle of the published areas sits at $57,365. 6 areas reach $70,000. The ranking is each area's own median for full-time, year-round workers in 2023 inflation-adjusted dollars, not a mean salary.
Figure 2
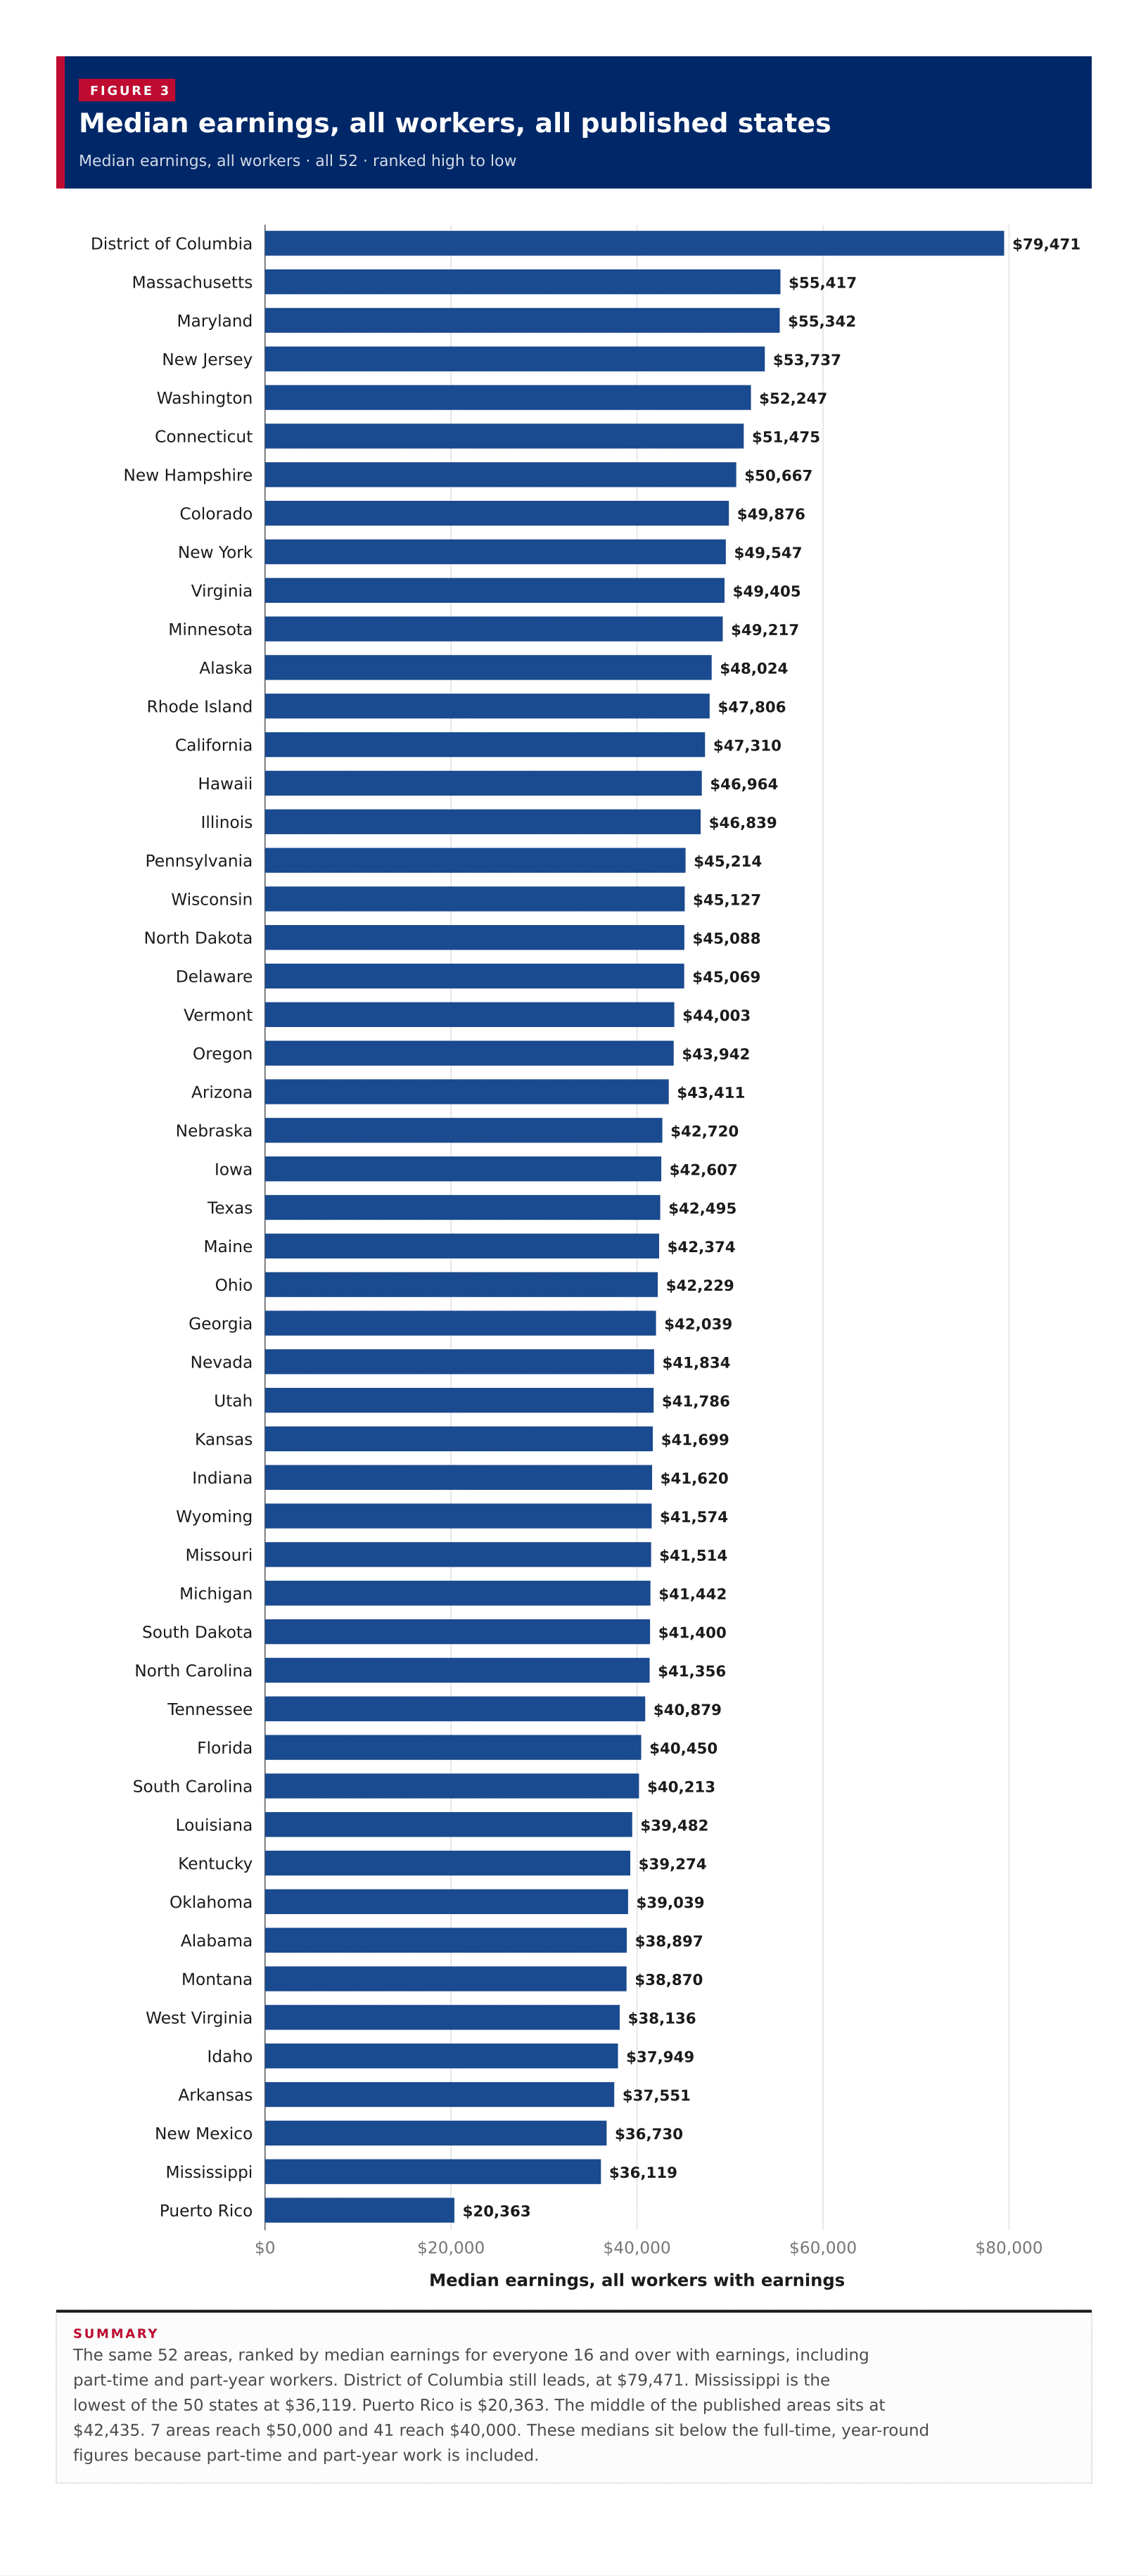
Median earnings, all workers, all published states
Median earnings, all workers · all 52 · ranked high to low
The same 52 areas, ranked by median earnings for everyone 16 and over with earnings, including part-time and part-year workers. District of Columbia still leads, at $79,471. Mississippi is the lowest of the 50 states at $36,119. Puerto Rico is $20,363. The middle of the published areas sits at $42,435. 7 areas reach $50,000 and 41 reach $40,000. These medians sit below the full-time, year-round figures because part-time and part-year work is included.
Figure 3
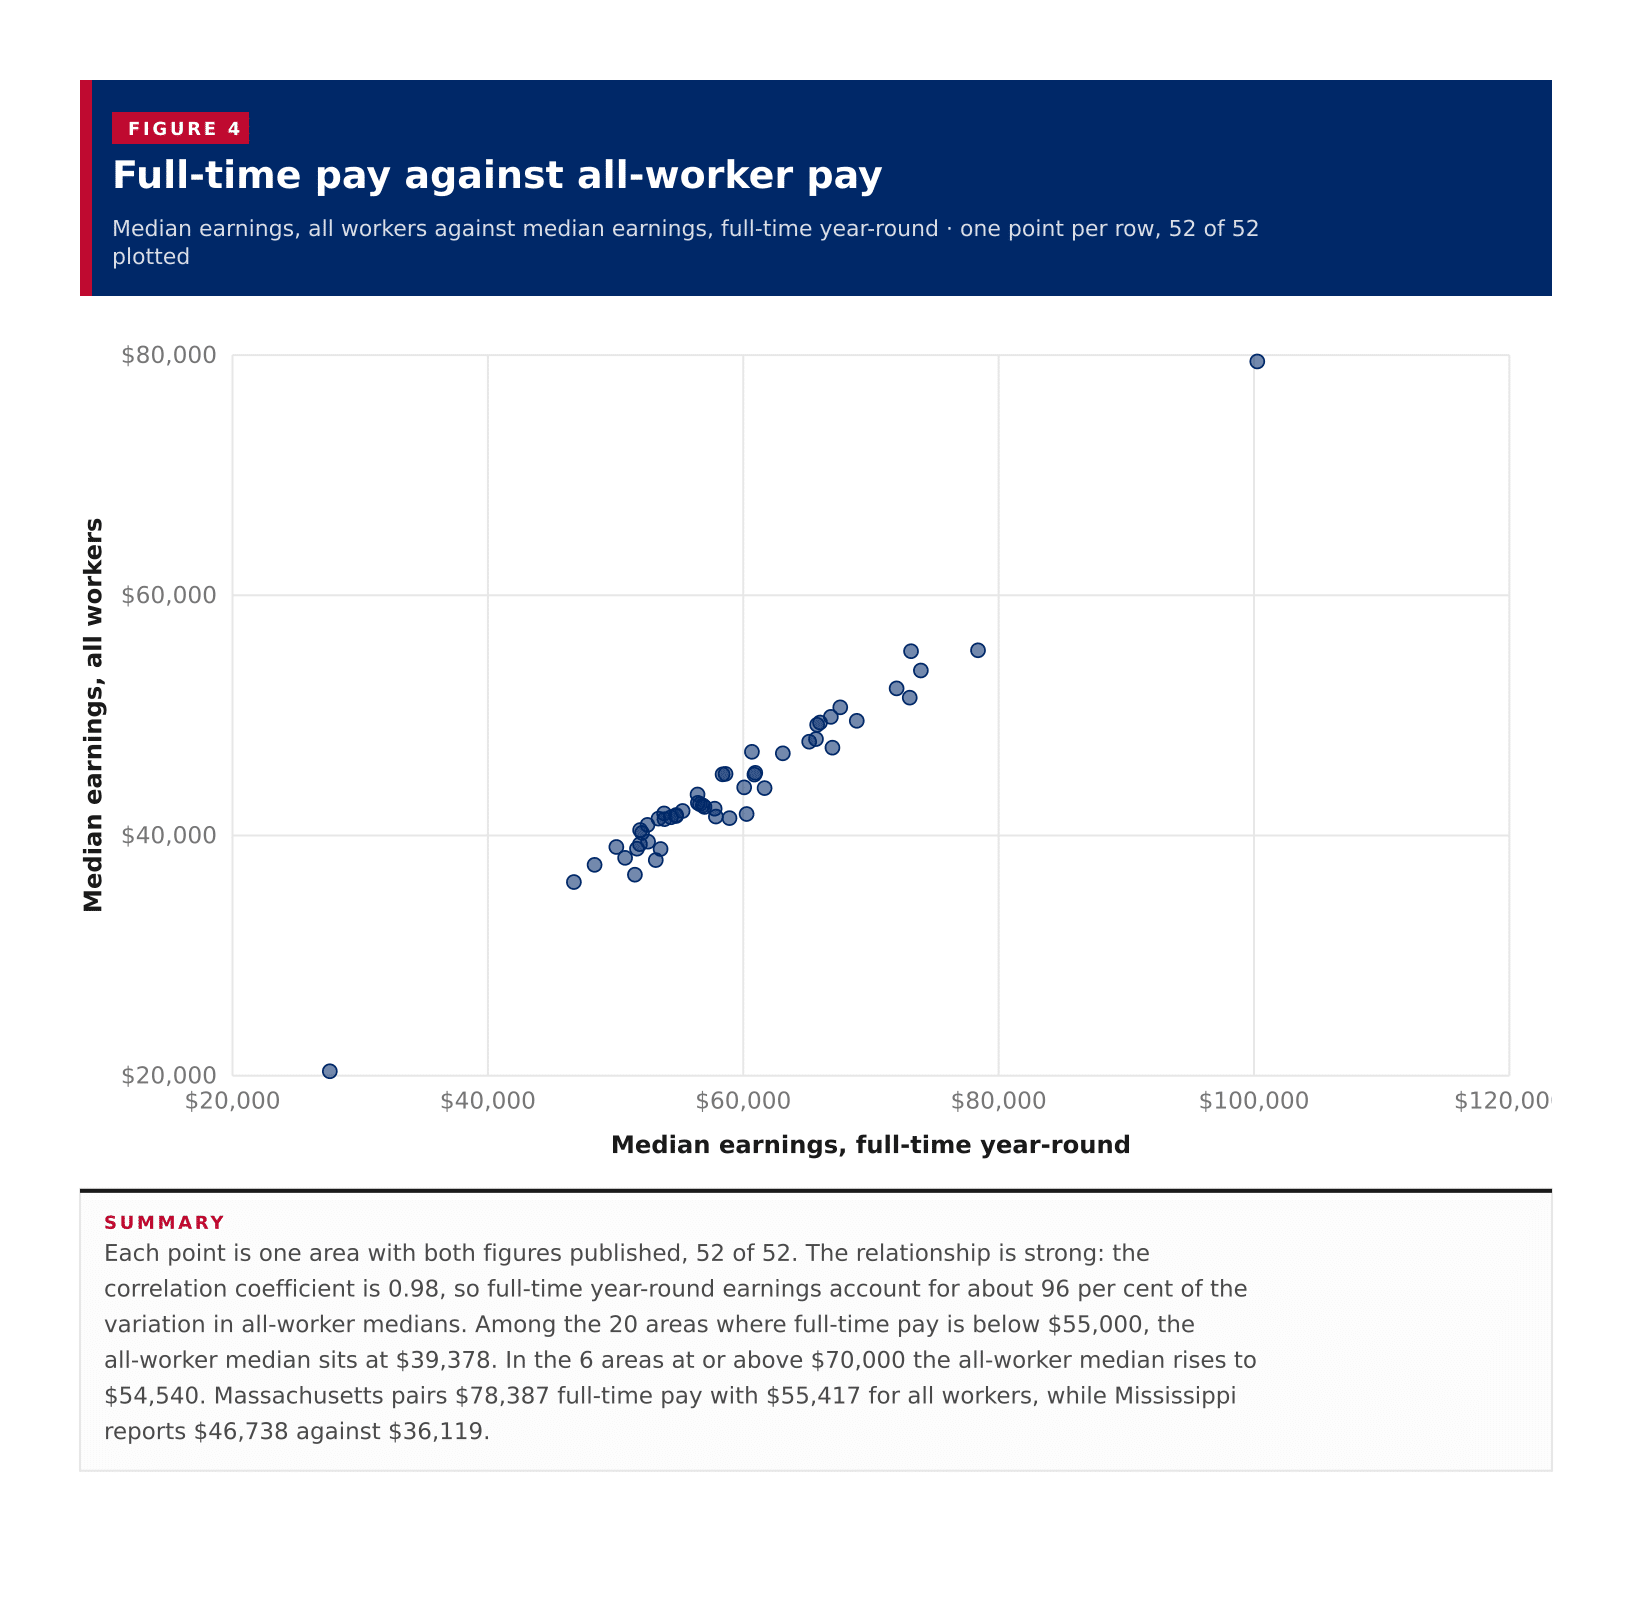
Full-time pay against all-worker pay
Median earnings, all workers against median earnings, full-time year-round · one point per row, 52 of 52 plotted
Each point is one area with both figures published, 52 of 52. The relationship is strong: the correlation coefficient is 0.98, so full-time year-round earnings account for about 96 per cent of the variation in all-worker medians. Among the 20 areas where full-time pay is below $55,000, the all-worker median sits at $39,378. In the 6 areas at or above $70,000 the all-worker median rises to $54,540. Massachusetts pairs $78,387 full-time pay with $55,417 for all workers, while Mississippi reports $46,738 against $36,119.
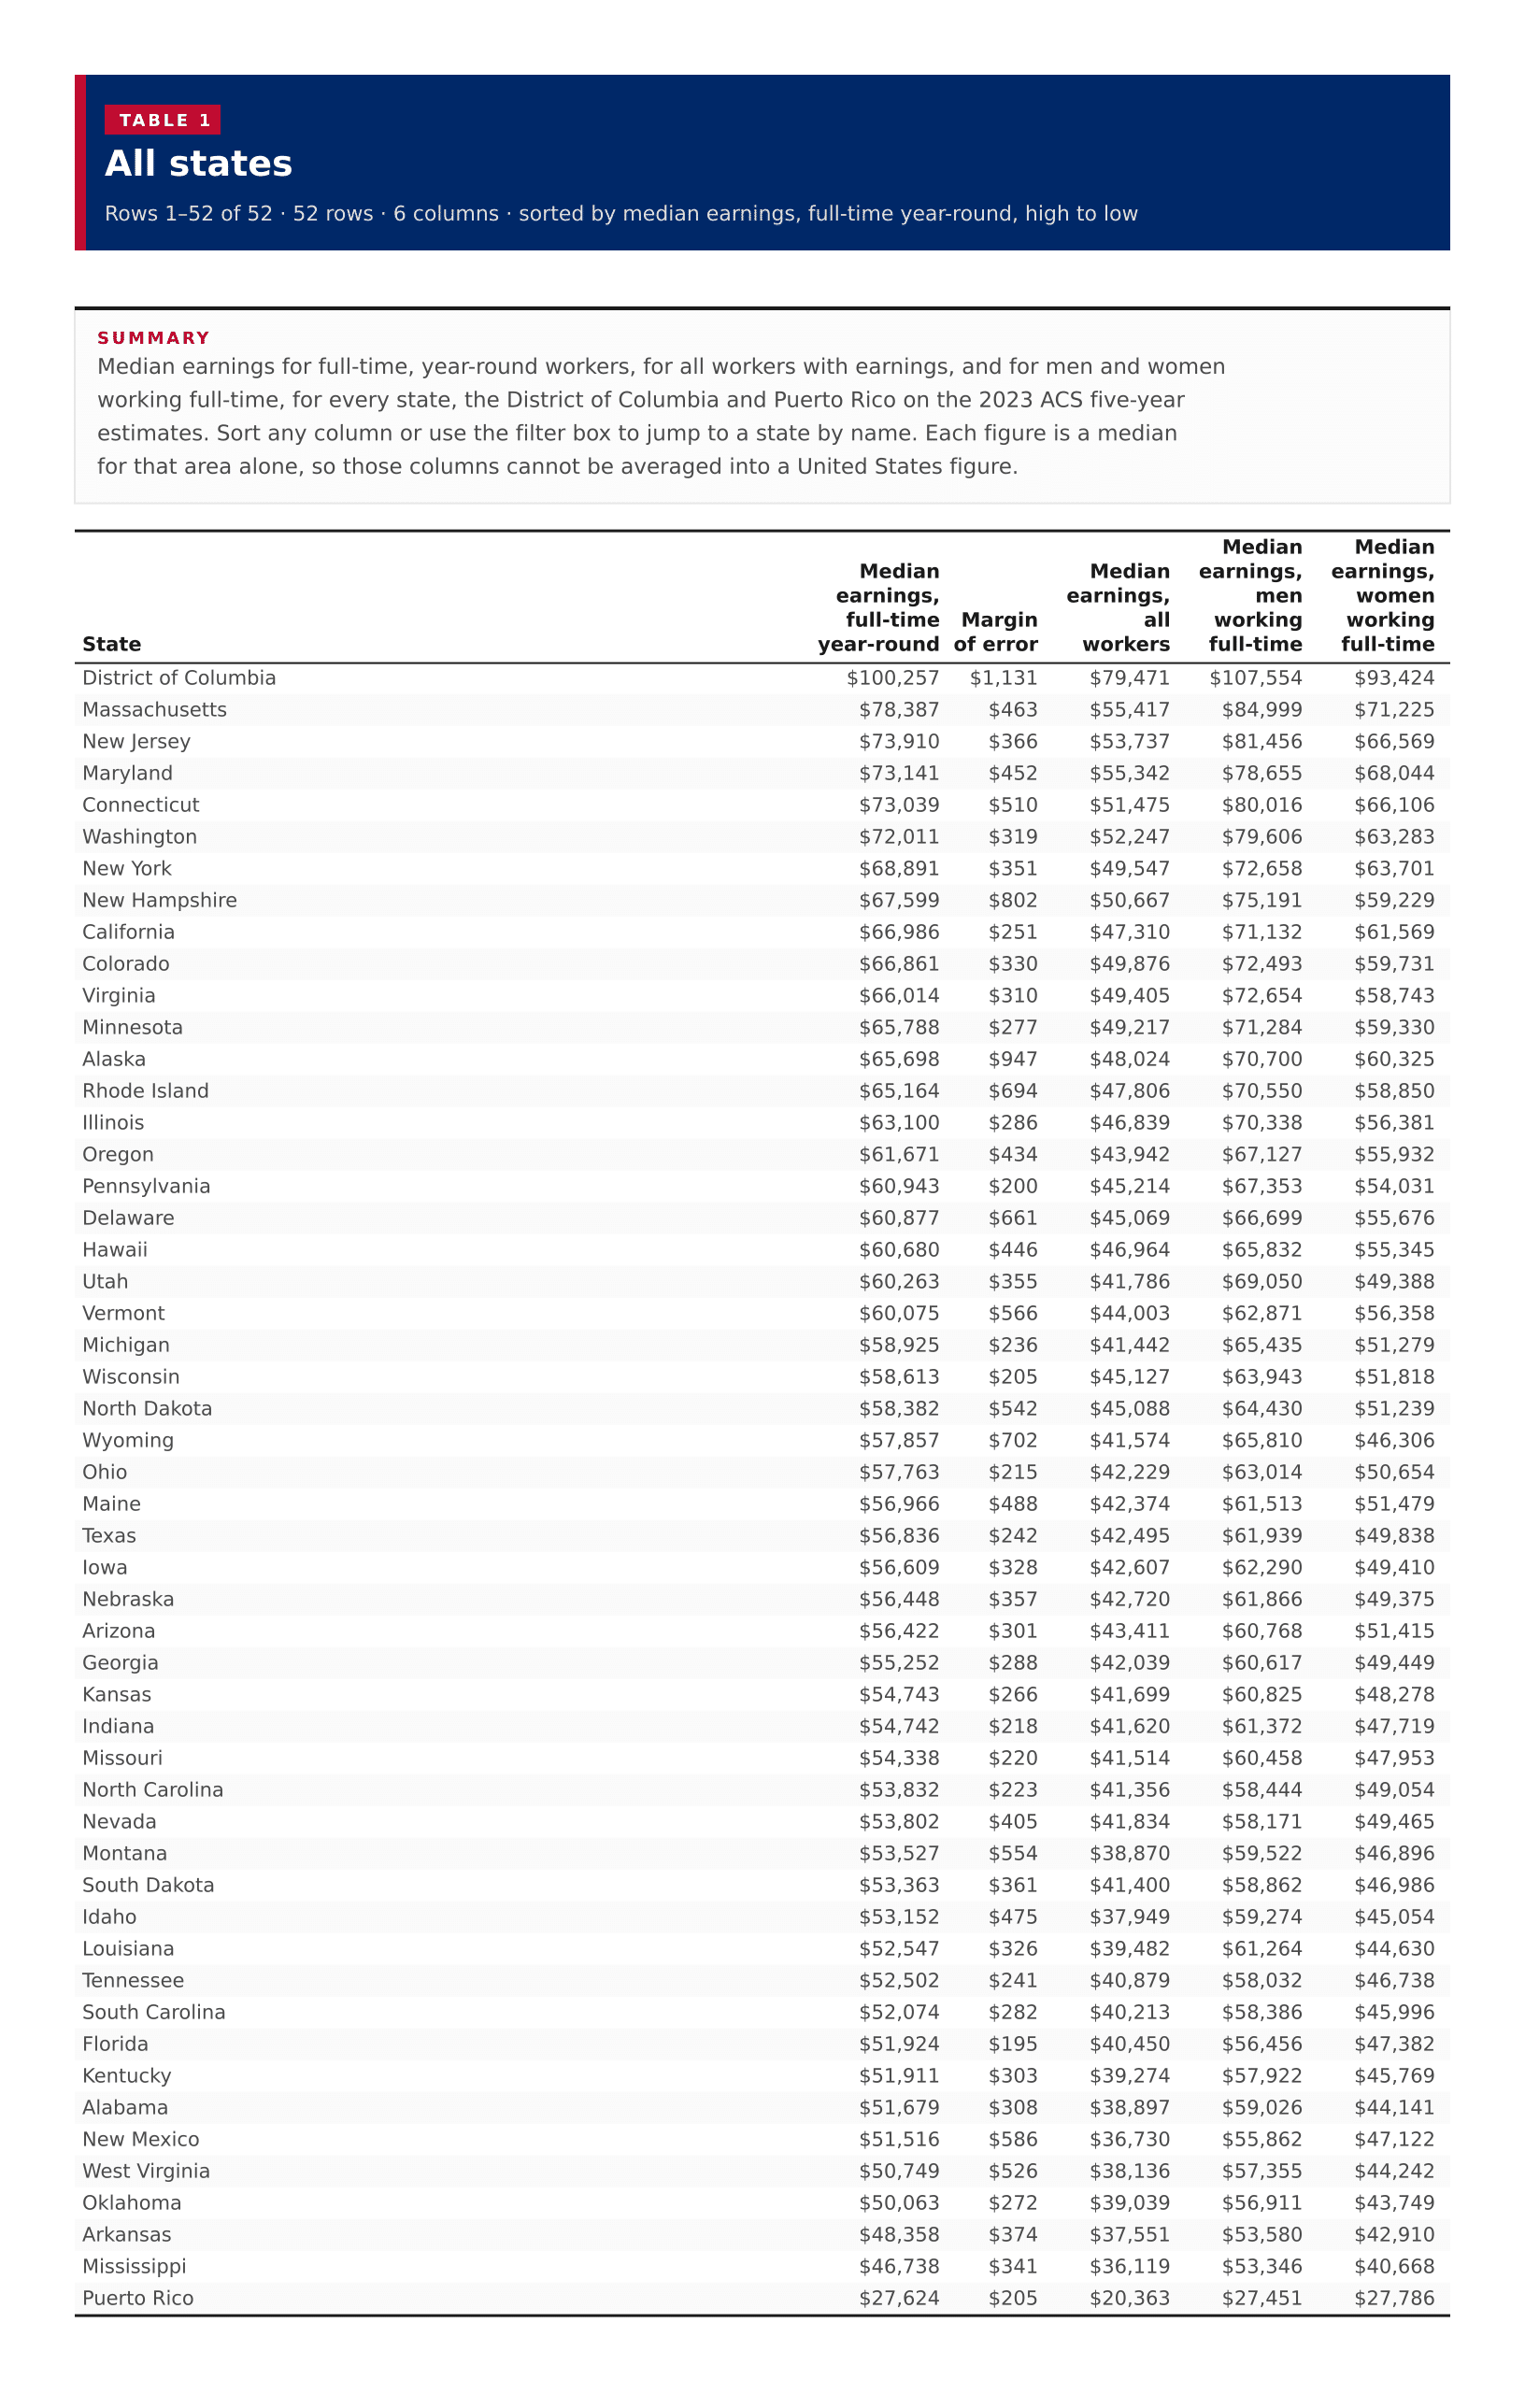
Table 1
All states
52 rows · 6 columns · sorted by median earnings, full-time year-round, high to low
Median earnings for full-time, year-round workers, for all workers with earnings, and for men and women working full-time, for every state, the District of Columbia and Puerto Rico on the 2023 ACS five-year estimates. Sort any column or use the filter box to jump to a state by name. Each figure is a median for that area alone, so those columns cannot be averaged into a United States figure.
ACS does not publish a table titled average salary. The figures on this page are medians, not means: the midpoint of workers in each area, in 2023 inflation-adjusted dollars, for the past 12 months.
The headline measure (table B20018) is median earnings for people 16 years and over who worked full-time, year-round with earnings. That is the closest ACS stand-in for typical worker pay, sometimes called salary. It is still a median, not an average.
Table B20017 adds median earnings for everyone 16 and over with earnings, including part-time and part-year workers, and the full-time year-round medians for men and for women. The all-worker median is lower because part-time and part-year work pulls it down.
A state median is the midpoint for workers in that state, so these figures cannot be averaged to produce a national figure.
The Census published 50 states, the District of Columbia and Puerto Rico. None of the medians were suppressed. Puerto Rico is listed in the ranking and table. Alaska and Hawaii appear in the ranking; on the map they are drawn as insets.