Internet access by US city

Summary

Broadband Internet, US cities

Broadband (cable, fiber or DSL) by city · all 346 cities · hover or tap a city for every figure on this page

346 items
View100%
DownloadPDFImageCSV
CitiesHighlands Ranch, Colorado
Broadband Internet, US citiesDarker amber is a higher share of households with a broadband Internet subscription such as cable, fiber or DSL. Each city is a marked point on the US state map. Alaska and Hawaii are inset. Puerto Rico cities are in the ranking and table but are not drawn here.Brownsville, Texas · Broadband (cable, fiber or DSL): 46.7% · Margin of error: 1.7% · Cellular data plan only: 33.3% · No Internet access: 12.9% · Households: 58,518 · Population: 188,023 · Population (margin of error): 90Tyler, Texas · Broadband (cable, fiber or DSL): 54.7% · Margin of error: 2.5% · Cellular data plan only: 30.3% · No Internet access: 9.1% · Households: 37,727 · Population: 107,718 · Population (margin of error): 63Elizabeth, New Jersey · Broadband (cable, fiber or DSL): 60.7% · Margin of error: 2.0% · Cellular data plan only: 13.4% · No Internet access: 11.3% · Households: 45,932 · Population: 135,887 · Population (margin of error): 79Detroit, Michigan · Broadband (cable, fiber or DSL): 61.6% · Margin of error: 0.8% · Cellular data plan only: 17.7% · No Internet access: 13.4% · Households: 253,207 · Population: 636,644 · Population (margin of error): 159Newark, New Jersey · Broadband (cable, fiber or DSL): 62.1% · Margin of error: 1.3% · Cellular data plan only: 16.6% · No Internet access: 15.2% · Households: 113,748 · Population: 307,188 · Population (margin of error): 49Cleveland, Ohio · Broadband (cable, fiber or DSL): 63.4% · Margin of error: 1.1% · Cellular data plan only: 13.3% · No Internet access: 15.2% · Households: 168,652 · Population: 367,523 · Population (margin of error): 61Memphis, Tennessee · Broadband (cable, fiber or DSL): 63.4% · Margin of error: 1.0% · Cellular data plan only: 18.0% · No Internet access: 12.2% · Households: 254,530 · Population: 629,063 · Population (margin of error): 84Waterbury, Connecticut · Broadband (cable, fiber or DSL): 63.5% · Margin of error: 2.2% · Cellular data plan only: 14.2% · No Internet access: 14.2% · Households: 45,962 · Population: 114,356 · Population (margin of error): 39Springfield, Missouri · Broadband (cable, fiber or DSL): 63.6% · Margin of error: 1.3% · Cellular data plan only: 14.6% · No Internet access: 9.5% · Households: 79,439 · Population: 169,432 · Population (margin of error): 92Hartford, Connecticut · Broadband (cable, fiber or DSL): 63.6% · Margin of error: 1.8% · Cellular data plan only: 19.3% · No Internet access: 10.7% · Households: 49,023 · Population: 119,970 · Population (margin of error): 53El Monte, California · Broadband (cable, fiber or DSL): 64.7% · Margin of error: 1.6% · Cellular data plan only: 16.5% · No Internet access: 10.0% · Households: 29,540 · Population: 107,066 · Population (margin of error): 113Mobile, Alabama · Broadband (cable, fiber or DSL): 65.8% · Margin of error: 1.5% · Cellular data plan only: 14.2% · No Internet access: 14.2% · Households: 77,587 · Population: 185,097 · Population (margin of error): 52Allentown, Pennsylvania · Broadband (cable, fiber or DSL): 65.9% · Margin of error: 2.2% · Cellular data plan only: 15.0% · No Internet access: 12.2% · Households: 46,039 · Population: 125,320 · Population (margin of error): 53Dayton, Ohio · Broadband (cable, fiber or DSL): 66.0% · Margin of error: 1.4% · Cellular data plan only: 14.6% · No Internet access: 12.6% · Households: 57,953 · Population: 136,741 · Population (margin of error): 70North Charleston, South Carolina · Broadband (cable, fiber or DSL): 66.0% · Margin of error: 2.2% · Cellular data plan only: 14.4% · No Internet access: 9.6% · Households: 47,528 · Population: 117,460 · Population (margin of error): 80Baltimore, Maryland · Broadband (cable, fiber or DSL): 66.2% · Margin of error: 0.9% · Cellular data plan only: 14.4% · No Internet access: 11.8% · Households: 250,608 · Population: 577,193Shreveport, Louisiana · Broadband (cable, fiber or DSL): 66.2% · Margin of error: 1.5% · Cellular data plan only: 13.1% · No Internet access: 14.8% · Households: 75,353 · Population: 183,483 · Population (margin of error): 60East Los Angeles, California · Broadband (cable, fiber or DSL): 66.3% · Margin of error: 1.9% · Cellular data plan only: 15.1% · No Internet access: 13.7% · Households: 30,604 · Population: 114,617 · Population (margin of error): 3,058Springfield, Illinois · Broadband (cable, fiber or DSL): 66.6% · Margin of error: 1.7% · Cellular data plan only: 18.2% · No Internet access: 9.1% · Households: 50,803 · Population: 113,714 · Population (margin of error): 376Paterson, New Jersey · Broadband (cable, fiber or DSL): 66.7% · Margin of error: 1.7% · Cellular data plan only: 19.5% · No Internet access: 10.0% · Households: 49,688 · Population: 157,660 · Population (margin of error): 137Springfield, Massachusetts · Broadband (cable, fiber or DSL): 66.8% · Margin of error: 1.8% · Cellular data plan only: 14.6% · No Internet access: 12.4% · Households: 58,046 · Population: 154,751 · Population (margin of error): 91Sunrise Manor, Nevada · Broadband (cable, fiber or DSL): 66.8% · Margin of error: 1.4% · Cellular data plan only: 14.8% · No Internet access: 10.1% · Households: 64,328 · Population: 199,099 · Population (margin of error): 3,940Salinas, California · Broadband (cable, fiber or DSL): 67.2% · Margin of error: 1.5% · Cellular data plan only: 23.1% · No Internet access: 4.9% · Households: 43,624 · Population: 161,993 · Population (margin of error): 109Birmingham, Alabama · Broadband (cable, fiber or DSL): 67.6% · Margin of error: 1.3% · Cellular data plan only: 13.6% · No Internet access: 11.9% · Households: 88,527 · Population: 199,322 · Population (margin of error): 646Beaumont, Texas · Broadband (cable, fiber or DSL): 67.8% · Margin of error: 1.6% · Cellular data plan only: 18.0% · No Internet access: 10.0% · Households: 44,915 · Population: 113,710 · Population (margin of error): 63Miami, Florida · Broadband (cable, fiber or DSL): 67.8% · Margin of error: 1.0% · Cellular data plan only: 9.4% · No Internet access: 15.6% · Households: 190,282 · Population: 446,663 · Population (margin of error): 77New Orleans, Louisiana · Broadband (cable, fiber or DSL): 67.8% · Margin of error: 0.9% · Cellular data plan only: 13.7% · No Internet access: 12.7% · Households: 155,060 · Population: 376,035Jackson, Mississippi · Broadband (cable, fiber or DSL): 67.9% · Margin of error: 1.9% · Cellular data plan only: 18.4% · No Internet access: 9.5% · Households: 61,956 · Population: 149,827 · Population (margin of error): 70Miami Gardens, Florida · Broadband (cable, fiber or DSL): 68.0% · Margin of error: 1.6% · Cellular data plan only: 12.6% · No Internet access: 11.6% · Households: 34,515 · Population: 111,264 · Population (margin of error): 111Rockford, Illinois · Broadband (cable, fiber or DSL): 68.1% · Margin of error: 1.2% · Cellular data plan only: 13.9% · No Internet access: 11.8% · Households: 61,481 · Population: 147,649 · Population (margin of error): 300South Bend, Indiana · Broadband (cable, fiber or DSL): 68.2% · Margin of error: 1.4% · Cellular data plan only: 14.4% · No Internet access: 10.5% · Households: 41,127 · Population: 102,866 · Population (margin of error): 612New Bedford, Massachusetts · Broadband (cable, fiber or DSL): 68.5% · Margin of error: 1.6% · Cellular data plan only: 13.4% · No Internet access: 12.1% · Households: 42,233 · Population: 100,731 · Population (margin of error): 62Bridgeport, Connecticut · Broadband (cable, fiber or DSL): 68.5% · Margin of error: 1.6% · Cellular data plan only: 15.1% · No Internet access: 10.5% · Households: 55,498 · Population: 148,012 · Population (margin of error): 100Topeka, Kansas · Broadband (cable, fiber or DSL): 68.6% · Margin of error: 1.4% · Cellular data plan only: 13.2% · No Internet access: 12.4% · Households: 54,303 · Population: 126,103 · Population (margin of error): 43Odessa, Texas · Broadband (cable, fiber or DSL): 68.6% · Margin of error: 1.9% · Cellular data plan only: 11.8% · No Internet access: 9.8% · Households: 44,987 · Population: 114,080 · Population (margin of error): 49Des Moines, Iowa · Broadband (cable, fiber or DSL): 68.6% · Margin of error: 1.2% · Cellular data plan only: 15.0% · No Internet access: 8.5% · Households: 90,085 · Population: 212,464 · Population (margin of error): 185Rochester, New York · Broadband (cable, fiber or DSL): 68.7% · Margin of error: 1.2% · Cellular data plan only: 13.9% · No Internet access: 11.0% · Households: 92,228 · Population: 209,720 · Population (margin of error): 114St. Louis, Missouri · Broadband (cable, fiber or DSL): 68.8% · Margin of error: 1.0% · Cellular data plan only: 13.5% · No Internet access: 11.3% · Households: 144,450 · Population: 293,109San Bernardino, California · Broadband (cable, fiber or DSL): 68.9% · Margin of error: 1.3% · Cellular data plan only: 11.3% · No Internet access: 8.4% · Households: 63,133 · Population: 221,774 · Population (margin of error): 88Knoxville, Tennessee · Broadband (cable, fiber or DSL): 69.2% · Margin of error: 1.4% · Cellular data plan only: 11.8% · No Internet access: 11.8% · Households: 84,882 · Population: 193,721 · Population (margin of error): 80Pueblo, Colorado · Broadband (cable, fiber or DSL): 69.6% · Margin of error: 1.3% · Cellular data plan only: 12.8% · No Internet access: 12.1% · Households: 46,106 · Population: 111,514 · Population (margin of error): 51Irving, Texas · Broadband (cable, fiber or DSL): 69.7% · Margin of error: 1.7% · Cellular data plan only: 19.6% · No Internet access: 7.0% · Households: 94,252 · Population: 255,036 · Population (margin of error): 57Syracuse, New York · Broadband (cable, fiber or DSL): 69.9% · Margin of error: 1.3% · Cellular data plan only: 12.3% · No Internet access: 10.7% · Households: 59,286 · Population: 146,211 · Population (margin of error): 65Kansas City, Kansas · Broadband (cable, fiber or DSL): 70.3% · Margin of error: 1.6% · Cellular data plan only: 13.2% · No Internet access: 9.7% · Households: 56,853 · Population: 154,776 · Population (margin of error): 26Waco, Texas · Broadband (cable, fiber or DSL): 70.5% · Margin of error: 1.8% · Cellular data plan only: 14.0% · No Internet access: 9.0% · Households: 52,980 · Population: 141,925 · Population (margin of error): 137Augusta-Richmond County consolidated government (balance), Georgia · Broadband (cable, fiber or DSL): 70.6% · Margin of error: 1.4% · Cellular data plan only: 11.0% · No Internet access: 9.2% · Households: 73,493 · Population: 201,504 · Population (margin of error): 20Baton Rouge, Louisiana · Broadband (cable, fiber or DSL): 70.6% · Margin of error: 1.3% · Cellular data plan only: 14.6% · No Internet access: 9.6% · Households: 87,607 · Population: 223,699 · Population (margin of error): 58Toledo, Ohio · Broadband (cable, fiber or DSL): 70.6% · Margin of error: 1.1% · Cellular data plan only: 12.5% · No Internet access: 10.7% · Households: 118,508 · Population: 268,461 · Population (margin of error): 64Tuscaloosa, Alabama · Broadband (cable, fiber or DSL): 70.6% · Margin of error: 1.7% · Cellular data plan only: 12.0% · No Internet access: 9.8% · Households: 40,193 · Population: 107,699 · Population (margin of error): 46Macon-Bibb County, Georgia · Broadband (cable, fiber or DSL): 70.7% · Margin of error: 1.1% · Cellular data plan only: 12.0% · No Internet access: 11.4% · Households: 59,681 · Population: 156,543Paradise, Nevada · Broadband (cable, fiber or DSL): 70.8% · Margin of error: 1.5% · Cellular data plan only: 13.9% · No Internet access: 8.3% · Households: 76,326 · Population: 186,178 · Population (margin of error): 4,601Pasadena, Texas · Broadband (cable, fiber or DSL): 70.9% · Margin of error: 2.0% · Cellular data plan only: 16.8% · No Internet access: 6.3% · Households: 49,791 · Population: 149,345 · Population (margin of error): 59Buffalo, New York · Broadband (cable, fiber or DSL): 70.9% · Margin of error: 1.3% · Cellular data plan only: 13.0% · No Internet access: 9.9% · Households: 119,548 · Population: 276,397 · Population (margin of error): 65Columbus, Georgia · Broadband (cable, fiber or DSL): 71.4% · Margin of error: 1.5% · Cellular data plan only: 11.8% · No Internet access: 9.4% · Households: 80,600 · Population: 204,383Milwaukee, Wisconsin · Broadband (cable, fiber or DSL): 71.7% · Margin of error: 0.6% · Cellular data plan only: 11.6% · No Internet access: 11.6% · Households: 231,084 · Population: 569,756 · Population (margin of error): 49El Paso, Texas · Broadband (cable, fiber or DSL): 71.7% · Margin of error: 0.7% · Cellular data plan only: 12.5% · No Internet access: 9.3% · Households: 242,482 · Population: 678,147 · Population (margin of error): 153Glendale, Arizona · Broadband (cable, fiber or DSL): 71.7% · Margin of error: 1.4% · Cellular data plan only: 11.0% · No Internet access: 8.5% · Households: 86,733 · Population: 250,193 · Population (margin of error): 86Clearwater, Florida · Broadband (cable, fiber or DSL): 71.9% · Margin of error: 2.1% · Cellular data plan only: 12.0% · No Internet access: 10.5% · Households: 49,909 · Population: 117,075 · Population (margin of error): 58Houston, Texas · Broadband (cable, fiber or DSL): 71.9% · Margin of error: 0.5% · Cellular data plan only: 14.3% · No Internet access: 8.6% · Households: 916,536 · Population: 2,300,419 · Population (margin of error): 172Peoria, Illinois · Broadband (cable, fiber or DSL): 71.9% · Margin of error: 1.6% · Cellular data plan only: 13.3% · No Internet access: 7.9% · Households: 48,950 · Population: 112,126 · Population (margin of error): 429Tulsa, Oklahoma · Broadband (cable, fiber or DSL): 72.0% · Margin of error: 0.7% · Cellular data plan only: 14.1% · No Internet access: 8.5% · Households: 171,382 · Population: 412,322 · Population (margin of error): 129Pomona, California · Broadband (cable, fiber or DSL): 72.1% · Margin of error: 1.7% · Cellular data plan only: 12.4% · No Internet access: 7.3% · Households: 41,827 · Population: 148,391 · Population (margin of error): 54Provo, Utah · Broadband (cable, fiber or DSL): 72.2% · Margin of error: 1.7% · Cellular data plan only: 6.5% · No Internet access: 2.8% · Households: 34,076 · Population: 114,303 · Population (margin of error): 48Wichita Falls, Texas · Broadband (cable, fiber or DSL): 72.2% · Margin of error: 1.4% · Cellular data plan only: 11.3% · No Internet access: 9.9% · Households: 38,132 · Population: 102,558 · Population (margin of error): 39Richmond, Virginia · Broadband (cable, fiber or DSL): 72.3% · Margin of error: 1.1% · Cellular data plan only: 10.5% · No Internet access: 9.2% · Households: 102,145 · Population: 227,595Philadelphia, Pennsylvania · Broadband (cable, fiber or DSL): 72.4% · Margin of error: 0.6% · Cellular data plan only: 12.7% · No Internet access: 9.5% · Households: 669,222 · Population: 1,582,432Providence, Rhode Island · Broadband (cable, fiber or DSL): 72.4% · Margin of error: 1.6% · Cellular data plan only: 13.2% · No Internet access: 9.0% · Households: 70,313 · Population: 190,214 · Population (margin of error): 61Norfolk, Virginia · Broadband (cable, fiber or DSL): 72.4% · Margin of error: 1.3% · Cellular data plan only: 12.9% · No Internet access: 9.3% · Households: 94,457 · Population: 235,037Chicago, Illinois · Broadband (cable, fiber or DSL): 72.5% · Margin of error: 0.4% · Cellular data plan only: 12.0% · No Internet access: 8.6% · Households: 1,146,547 · Population: 2,707,648 · Population (margin of error): 72High Point, North Carolina · Broadband (cable, fiber or DSL): 72.5% · Margin of error: 1.7% · Cellular data plan only: 14.9% · No Internet access: 8.0% · Households: 45,043 · Population: 115,263 · Population (margin of error): 63Indianapolis city (balance), Indiana · Broadband (cable, fiber or DSL): 72.5% · Margin of error: 0.7% · Cellular data plan only: 13.7% · No Internet access: 8.0% · Households: 359,665 · Population: 882,043 · Population (margin of error): 878Laredo, Texas · Broadband (cable, fiber or DSL): 72.6% · Margin of error: 1.5% · Cellular data plan only: 9.5% · No Internet access: 12.5% · Households: 76,259 · Population: 255,949 · Population (margin of error): 41McAllen, Texas · Broadband (cable, fiber or DSL): 72.7% · Margin of error: 1.4% · Cellular data plan only: 14.1% · No Internet access: 8.0% · Households: 48,268 · Population: 143,789 · Population (margin of error): 56Winston-Salem, North Carolina · Broadband (cable, fiber or DSL): 72.8% · Margin of error: 1.2% · Cellular data plan only: 11.5% · No Internet access: 9.5% · Households: 100,278 · Population: 250,887 · Population (margin of error): 68Brockton, Massachusetts · Broadband (cable, fiber or DSL): 72.8% · Margin of error: 2.5% · Cellular data plan only: 14.3% · No Internet access: 8.7% · Households: 35,610 · Population: 105,080 · Population (margin of error): 50Dallas, Texas · Broadband (cable, fiber or DSL): 73.0% · Margin of error: 0.6% · Cellular data plan only: 12.8% · No Internet access: 8.6% · Households: 528,038 · Population: 1,299,553 · Population (margin of error): 141Vallejo, California · Broadband (cable, fiber or DSL): 73.0% · Margin of error: 1.7% · Cellular data plan only: 15.7% · No Internet access: 4.4% · Households: 43,921 · Population: 124,637 · Population (margin of error): 70Independence, Missouri · Broadband (cable, fiber or DSL): 73.0% · Margin of error: 1.7% · Cellular data plan only: 13.1% · No Internet access: 9.5% · Households: 50,925 · Population: 121,944 · Population (margin of error): 74Louisville/Jefferson County metro government (balance), Kentucky · Broadband (cable, fiber or DSL): 73.0% · Margin of error: 0.8% · Cellular data plan only: 14.4% · No Internet access: 7.6% · Households: 262,740 · Population: 627,210 · Population (margin of error): 145Jacksonville, Florida · Broadband (cable, fiber or DSL): 73.0% · Margin of error: 0.6% · Cellular data plan only: 14.3% · No Internet access: 7.0% · Households: 384,741 · Population: 961,739 · Population (margin of error): 52Lubbock, Texas · Broadband (cable, fiber or DSL): 73.1% · Margin of error: 1.1% · Cellular data plan only: 11.2% · No Internet access: 8.0% · Households: 105,259 · Population: 261,078 · Population (margin of error): 49Lakeland, Florida · Broadband (cable, fiber or DSL): 73.2% · Margin of error: 1.6% · Cellular data plan only: 11.3% · No Internet access: 9.3% · Households: 46,339 · Population: 117,030 · Population (margin of error): 64Stockton, California · Broadband (cable, fiber or DSL): 73.2% · Margin of error: 1.1% · Cellular data plan only: 13.5% · No Internet access: 7.6% · Households: 98,295 · Population: 320,470 · Population (margin of error): 131Tucson, Arizona · Broadband (cable, fiber or DSL): 73.2% · Margin of error: 0.7% · Cellular data plan only: 13.3% · No Internet access: 7.3% · Households: 225,095 · Population: 543,348 · Population (margin of error): 98Hialeah, Florida · Broadband (cable, fiber or DSL): 73.2% · Margin of error: 1.1% · Cellular data plan only: 7.6% · No Internet access: 13.8% · Households: 77,294 · Population: 221,901 · Population (margin of error): 67Oklahoma City, Oklahoma · Broadband (cable, fiber or DSL): 73.4% · Margin of error: 0.8% · Cellular data plan only: 13.9% · No Internet access: 7.0% · Households: 275,193 · Population: 688,693 · Population (margin of error): 148Evansville, Indiana · Broadband (cable, fiber or DSL): 73.5% · Margin of error: 1.6% · Cellular data plan only: 12.9% · No Internet access: 7.9% · Households: 52,284 · Population: 116,441 · Population (margin of error): 34Inglewood, California · Broadband (cable, fiber or DSL): 73.5% · Margin of error: 1.5% · Cellular data plan only: 13.5% · No Internet access: 6.7% · Households: 35,979 · Population: 105,575 · Population (margin of error): 57Killeen, Texas · Broadband (cable, fiber or DSL): 73.6% · Margin of error: 1.9% · Cellular data plan only: 14.3% · No Internet access: 7.2% · Households: 59,824 · Population: 156,144 · Population (margin of error): 60Abilene, Texas · Broadband (cable, fiber or DSL): 73.6% · Margin of error: 1.7% · Cellular data plan only: 14.2% · No Internet access: 7.9% · Households: 46,682 · Population: 127,130 · Population (margin of error): 262Davenport, Iowa · Broadband (cable, fiber or DSL): 73.7% · Margin of error: 1.4% · Cellular data plan only: 11.4% · No Internet access: 9.1% · Households: 43,479 · Population: 101,083 · Population (margin of error): 34Metairie, Louisiana · Broadband (cable, fiber or DSL): 73.7% · Margin of error: 1.9% · Cellular data plan only: 14.1% · No Internet access: 8.9% · Households: 60,896 · Population: 138,995 · Population (margin of error): 3,016Palmdale, California · Broadband (cable, fiber or DSL): 73.7% · Margin of error: 1.6% · Cellular data plan only: 14.8% · No Internet access: 5.7% · Households: 46,502 · Population: 165,487 · Population (margin of error): 66Amarillo, Texas · Broadband (cable, fiber or DSL): 73.9% · Margin of error: 1.1% · Cellular data plan only: 12.1% · No Internet access: 8.7% · Households: 78,612 · Population: 200,945 · Population (margin of error): 43Lancaster, California · Broadband (cable, fiber or DSL): 74.0% · Margin of error: 1.4% · Cellular data plan only: 13.3% · No Internet access: 6.8% · Households: 52,183 · Population: 170,013 · Population (margin of error): 62Fresno, California · Broadband (cable, fiber or DSL): 74.0% · Margin of error: 0.9% · Cellular data plan only: 10.9% · No Internet access: 9.1% · Households: 179,684 · Population: 543,615 · Population (margin of error): 107Edinburg, Texas · Broadband (cable, fiber or DSL): 74.1% · Margin of error: 2.7% · Cellular data plan only: 9.9% · No Internet access: 10.8% · Households: 34,618 · Population: 102,561 · Population (margin of error): 51Fargo, North Dakota · Broadband (cable, fiber or DSL): 74.2% · Margin of error: 2.0% · Cellular data plan only: 11.3% · No Internet access: 4.9% · Households: 58,629 · Population: 129,064 · Population (margin of error): 49Akron, Ohio · Broadband (cable, fiber or DSL): 74.2% · Margin of error: 1.3% · Cellular data plan only: 11.5% · No Internet access: 9.6% · Households: 83,854 · Population: 189,526 · Population (margin of error): 76Modesto, California · Broadband (cable, fiber or DSL): 74.3% · Margin of error: 1.3% · Cellular data plan only: 12.7% · No Internet access: 5.9% · Households: 72,418 · Population: 218,614 · Population (margin of error): 91New York, New York · Broadband (cable, fiber or DSL): 74.4% · Margin of error: 0.3% · Cellular data plan only: 13.0% · No Internet access: 8.7% · Households: 3,313,316 · Population: 8,516,202Santa Ana, California · Broadband (cable, fiber or DSL): 74.4% · Margin of error: 1.0% · Cellular data plan only: 12.6% · No Internet access: 8.4% · Households: 79,691 · Population: 311,639 · Population (margin of error): 89Savannah, Georgia · Broadband (cable, fiber or DSL): 74.4% · Margin of error: 1.4% · Cellular data plan only: 12.4% · No Internet access: 7.5% · Households: 58,632 · Population: 147,546 · Population (margin of error): 85Lynn, Massachusetts · Broadband (cable, fiber or DSL): 74.4% · Margin of error: 1.9% · Cellular data plan only: 11.8% · No Internet access: 9.2% · Households: 36,328 · Population: 100,905 · Population (margin of error): 83Las Vegas, Nevada · Broadband (cable, fiber or DSL): 74.4% · Margin of error: 0.8% · Cellular data plan only: 12.3% · No Internet access: 7.3% · Households: 244,429 · Population: 650,873 · Population (margin of error): 108New Haven, Connecticut · Broadband (cable, fiber or DSL): 74.5% · Margin of error: 1.7% · Cellular data plan only: 12.3% · No Internet access: 8.6% · Households: 53,424 · Population: 132,893 · Population (margin of error): 76Lansing, Michigan · Broadband (cable, fiber or DSL): 74.5% · Margin of error: 1.6% · Cellular data plan only: 11.4% · No Internet access: 8.6% · Households: 51,129 · Population: 112,546 · Population (margin of error): 66West Palm Beach, Florida · Broadband (cable, fiber or DSL): 74.6% · Margin of error: 1.2% · Cellular data plan only: 11.4% · No Internet access: 8.3% · Households: 50,518 · Population: 119,508 · Population (margin of error): 117Las Cruces, New Mexico · Broadband (cable, fiber or DSL): 74.6% · Margin of error: 1.9% · Cellular data plan only: 11.1% · No Internet access: 7.9% · Households: 46,661 · Population: 112,612 · Population (margin of error): 86Fort Wayne, Indiana · Broadband (cable, fiber or DSL): 74.6% · Margin of error: 1.1% · Cellular data plan only: 14.0% · No Internet access: 7.1% · Households: 109,604 · Population: 266,235 · Population (margin of error): 395Mesquite, Texas · Broadband (cable, fiber or DSL): 74.7% · Margin of error: 2.4% · Cellular data plan only: 12.8% · No Internet access: 5.6% · Households: 50,362 · Population: 148,848 · Population (margin of error): 473Newport News, Virginia · Broadband (cable, fiber or DSL): 74.7% · Margin of error: 1.5% · Cellular data plan only: 14.9% · No Internet access: 6.4% · Households: 75,798 · Population: 184,774Wichita, Kansas · Broadband (cable, fiber or DSL): 74.7% · Margin of error: 0.7% · Cellular data plan only: 13.0% · No Internet access: 7.6% · Households: 157,646 · Population: 396,488 · Population (margin of error): 82Midland, Texas · Broadband (cable, fiber or DSL): 74.7% · Margin of error: 2.2% · Cellular data plan only: 11.6% · No Internet access: 7.0% · Households: 52,780 · Population: 133,998 · Population (margin of error): 47Albuquerque, New Mexico · Broadband (cable, fiber or DSL): 74.8% · Margin of error: 0.7% · Cellular data plan only: 10.7% · No Internet access: 8.1% · Households: 242,117 · Population: 562,488 · Population (margin of error): 118San Antonio, Texas · Broadband (cable, fiber or DSL): 74.8% · Margin of error: 0.6% · Cellular data plan only: 12.0% · No Internet access: 7.7% · Households: 547,883 · Population: 1,458,954 · Population (margin of error): 118Gainesville, Florida · Broadband (cable, fiber or DSL): 74.9% · Margin of error: 2.0% · Cellular data plan only: 8.5% · No Internet access: 4.6% · Households: 58,176 · Population: 143,611 · Population (margin of error): 98Worcester, Massachusetts · Broadband (cable, fiber or DSL): 74.9% · Margin of error: 1.4% · Cellular data plan only: 12.2% · No Internet access: 8.6% · Households: 79,089 · Population: 205,501 · Population (margin of error): 74Little Rock, Arkansas · Broadband (cable, fiber or DSL): 75.0% · Margin of error: 1.6% · Cellular data plan only: 12.0% · No Internet access: 8.1% · Households: 86,853 · Population: 202,739 · Population (margin of error): 78Lowell, Massachusetts · Broadband (cable, fiber or DSL): 75.0% · Margin of error: 2.1% · Cellular data plan only: 11.6% · No Internet access: 10.3% · Households: 42,383 · Population: 114,799 · Population (margin of error): 46Green Bay, Wisconsin · Broadband (cable, fiber or DSL): 75.1% · Margin of error: 1.3% · Cellular data plan only: 11.1% · No Internet access: 8.4% · Households: 44,092 · Population: 106,585 · Population (margin of error): 91Kansas City, Missouri · Broadband (cable, fiber or DSL): 75.2% · Margin of error: 0.8% · Cellular data plan only: 11.2% · No Internet access: 6.9% · Households: 219,486 · Population: 508,233 · Population (margin of error): 121Albany, New York · Broadband (cable, fiber or DSL): 75.2% · Margin of error: 1.5% · Cellular data plan only: 10.2% · No Internet access: 9.4% · Households: 43,745 · Population: 100,081 · Population (margin of error): 48Santa Maria, California · Broadband (cable, fiber or DSL): 75.2% · Margin of error: 2.1% · Cellular data plan only: 11.1% · No Internet access: 7.6% · Households: 29,092 · Population: 109,880 · Population (margin of error): 48Montgomery, Alabama · Broadband (cable, fiber or DSL): 75.3% · Margin of error: 1.2% · Cellular data plan only: 11.1% · No Internet access: 8.2% · Households: 80,540 · Population: 198,440 · Population (margin of error): 40Pompano Beach, Florida · Broadband (cable, fiber or DSL): 75.3% · Margin of error: 1.9% · Cellular data plan only: 10.8% · No Internet access: 8.8% · Households: 47,403 · Population: 112,212 · Population (margin of error): 80Cincinnati, Ohio · Broadband (cable, fiber or DSL): 75.4% · Margin of error: 1.3% · Cellular data plan only: 10.7% · No Internet access: 8.5% · Households: 142,810 · Population: 309,595 · Population (margin of error): 63Anaheim, California · Broadband (cable, fiber or DSL): 75.4% · Margin of error: 1.2% · Cellular data plan only: 14.0% · No Internet access: 5.5% · Households: 105,819 · Population: 344,553 · Population (margin of error): 138Urban Honolulu, Hawaii · Broadband (cable, fiber or DSL): 75.5% · Margin of error: 1.0% · Cellular data plan only: 11.3% · No Internet access: 7.3% · Households: 136,228 · Population: 346,323 · Population (margin of error): 116Corpus Christi, Texas · Broadband (cable, fiber or DSL): 75.5% · Margin of error: 1.0% · Cellular data plan only: 11.3% · No Internet access: 8.9% · Households: 118,038 · Population: 317,383 · Population (margin of error): 78Grand Rapids, Michigan · Broadband (cable, fiber or DSL): 75.5% · Margin of error: 1.2% · Cellular data plan only: 11.2% · No Internet access: 8.2% · Households: 79,944 · Population: 197,768 · Population (margin of error): 88Escondido, California · Broadband (cable, fiber or DSL): 75.5% · Margin of error: 1.5% · Cellular data plan only: 13.2% · No Internet access: 4.2% · Households: 50,658 · Population: 149,913 · Population (margin of error): 83Garland, Texas · Broadband (cable, fiber or DSL): 75.5% · Margin of error: 1.1% · Cellular data plan only: 16.0% · No Internet access: 4.6% · Households: 80,811 · Population: 245,298 · Population (margin of error): 145Warren, Michigan · Broadband (cable, fiber or DSL): 75.6% · Margin of error: 1.5% · Cellular data plan only: 12.3% · No Internet access: 8.4% · Households: 54,076 · Population: 138,128 · Population (margin of error): 56Yonkers, New York · Broadband (cable, fiber or DSL): 75.7% · Margin of error: 0.9% · Cellular data plan only: 11.5% · No Internet access: 7.8% · Households: 80,550 · Population: 209,529 · Population (margin of error): 81Phoenix, Arizona · Broadband (cable, fiber or DSL): 75.8% · Margin of error: 0.4% · Cellular data plan only: 11.2% · No Internet access: 7.6% · Households: 601,397 · Population: 1,624,832 · Population (margin of error): 112Jurupa Valley, California · Broadband (cable, fiber or DSL): 75.8% · Margin of error: 2.0% · Cellular data plan only: 11.1% · No Internet access: 5.7% · Households: 27,132 · Population: 106,244 · Population (margin of error): 54St. Paul, Minnesota · Broadband (cable, fiber or DSL): 75.9% · Margin of error: 1.0% · Cellular data plan only: 12.2% · No Internet access: 5.9% · Households: 123,067 · Population: 307,762 · Population (margin of error): 48Garden Grove, California · Broadband (cable, fiber or DSL): 76.0% · Margin of error: 1.3% · Cellular data plan only: 12.6% · No Internet access: 6.6% · Households: 48,650 · Population: 170,603 · Population (margin of error): 85Columbia, South Carolina · Broadband (cable, fiber or DSL): 76.0% · Margin of error: 2.0% · Cellular data plan only: 9.5% · No Internet access: 9.1% · Households: 51,784 · Population: 138,019 · Population (margin of error): 187College Station, Texas · Broadband (cable, fiber or DSL): 76.1% · Margin of error: 1.6% · Cellular data plan only: 6.7% · No Internet access: 2.1% · Households: 44,676 · Population: 122,280 · Population (margin of error): 66Reno, Nevada · Broadband (cable, fiber or DSL): 76.2% · Margin of error: 1.1% · Cellular data plan only: 9.7% · No Internet access: 7.7% · Households: 112,061 · Population: 268,959 · Population (margin of error): 101Bakersfield, California · Broadband (cable, fiber or DSL): 76.2% · Margin of error: 1.0% · Cellular data plan only: 13.8% · No Internet access: 5.2% · Households: 127,626 · Population: 408,366 · Population (margin of error): 97Brandon, Florida · Broadband (cable, fiber or DSL): 76.2% · Margin of error: 1.7% · Cellular data plan only: 15.4% · No Internet access: 3.7% · Households: 45,008 · Population: 116,365 · Population (margin of error): 3,137Ontario, California · Broadband (cable, fiber or DSL): 76.4% · Margin of error: 1.6% · Cellular data plan only: 12.1% · No Internet access: 4.5% · Households: 52,664 · Population: 178,347 · Population (margin of error): 66Downey, California · Broadband (cable, fiber or DSL): 76.5% · Margin of error: 1.7% · Cellular data plan only: 12.4% · No Internet access: 4.4% · Households: 34,727 · Population: 111,793 · Population (margin of error): 61Spokane Valley, Washington · Broadband (cable, fiber or DSL): 76.5% · Margin of error: 1.7% · Cellular data plan only: 10.0% · No Internet access: 7.8% · Households: 42,781 · Population: 105,460 · Population (margin of error): 71Lehigh Acres, Florida · Broadband (cable, fiber or DSL): 76.7% · Margin of error: 1.8% · Cellular data plan only: 11.0% · No Internet access: 6.7% · Households: 38,555 · Population: 127,391 · Population (margin of error): 3,339Greeley, Colorado · Broadband (cable, fiber or DSL): 76.7% · Margin of error: 1.8% · Cellular data plan only: 10.2% · No Internet access: 7.1% · Households: 38,901 · Population: 109,421 · Population (margin of error): 62Visalia, California · Broadband (cable, fiber or DSL): 76.8% · Margin of error: 2.0% · Cellular data plan only: 10.5% · No Internet access: 7.3% · Households: 46,466 · Population: 142,649 · Population (margin of error): 1,065Fort Worth, Texas · Broadband (cable, fiber or DSL): 76.8% · Margin of error: 0.6% · Cellular data plan only: 11.7% · No Internet access: 6.3% · Households: 334,230 · Population: 941,311 · Population (margin of error): 527Rialto, California · Broadband (cable, fiber or DSL): 77.0% · Margin of error: 2.2% · Cellular data plan only: 9.4% · No Internet access: 4.9% · Households: 26,856 · Population: 103,866 · Population (margin of error): 60Los Angeles, California · Broadband (cable, fiber or DSL): 77.0% · Margin of error: 0.3% · Cellular data plan only: 11.7% · No Internet access: 6.5% · Households: 1,419,663 · Population: 3,857,897 · Population (margin of error): 75Cedar Rapids, Iowa · Broadband (cable, fiber or DSL): 77.1% · Margin of error: 1.1% · Cellular data plan only: 12.7% · No Internet access: 5.5% · Households: 58,870 · Population: 136,859 · Population (margin of error): 60Grand Prairie, Texas · Broadband (cable, fiber or DSL): 77.1% · Margin of error: 1.3% · Cellular data plan only: 10.7% · No Internet access: 5.8% · Households: 66,943 · Population: 198,564 · Population (margin of error): 92Richmond, California · Broadband (cable, fiber or DSL): 77.1% · Margin of error: 1.8% · Cellular data plan only: 13.0% · No Internet access: 5.9% · Households: 40,466 · Population: 115,396 · Population (margin of error): 54Glendale, California · Broadband (cable, fiber or DSL): 77.1% · Margin of error: 0.8% · Cellular data plan only: 11.5% · No Internet access: 7.6% · Households: 73,179 · Population: 192,270 · Population (margin of error): 67Dearborn, Michigan · Broadband (cable, fiber or DSL): 77.2% · Margin of error: 1.3% · Cellular data plan only: 11.2% · No Internet access: 5.8% · Households: 36,276 · Population: 107,846 · Population (margin of error): 57Miramar, Florida · Broadband (cable, fiber or DSL): 77.4% · Margin of error: 1.9% · Cellular data plan only: 11.2% · No Internet access: 6.0% · Households: 44,446 · Population: 135,986 · Population (margin of error): 63North Las Vegas, Nevada · Broadband (cable, fiber or DSL): 77.4% · Margin of error: 0.9% · Cellular data plan only: 11.9% · No Internet access: 5.7% · Households: 85,814 · Population: 270,773 · Population (margin of error): 64Norwalk, California · Broadband (cable, fiber or DSL): 77.4% · Margin of error: 2.3% · Cellular data plan only: 9.4% · No Internet access: 5.0% · Households: 26,801 · Population: 100,713 · Population (margin of error): 59Victorville, California · Broadband (cable, fiber or DSL): 77.4% · Margin of error: 1.6% · Cellular data plan only: 11.5% · No Internet access: 6.0% · Households: 37,480 · Population: 135,983 · Population (margin of error): 80Oakland, California · Broadband (cable, fiber or DSL): 77.5% · Margin of error: 0.9% · Cellular data plan only: 9.9% · No Internet access: 8.2% · Households: 173,179 · Population: 438,072 · Population (margin of error): 58Hollywood, Florida · Broadband (cable, fiber or DSL): 77.6% · Margin of error: 1.7% · Cellular data plan only: 11.4% · No Internet access: 6.6% · Households: 60,456 · Population: 152,935 · Population (margin of error): 60Concord, North Carolina · Broadband (cable, fiber or DSL): 77.6% · Margin of error: 1.7% · Cellular data plan only: 11.6% · No Internet access: 5.6% · Households: 37,047 · Population: 106,518 · Population (margin of error): 49Pembroke Pines, Florida · Broadband (cable, fiber or DSL): 77.6% · Margin of error: 1.3% · Cellular data plan only: 10.3% · No Internet access: 6.7% · Households: 63,994 · Population: 170,557 · Population (margin of error): 64Salt Lake City, Utah · Broadband (cable, fiber or DSL): 77.8% · Margin of error: 1.0% · Cellular data plan only: 11.0% · No Internet access: 4.7% · Households: 88,932 · Population: 203,888 · Population (margin of error): 77Tampa, Florida · Broadband (cable, fiber or DSL): 77.9% · Margin of error: 0.8% · Cellular data plan only: 11.7% · No Internet access: 5.2% · Households: 160,527 · Population: 393,389 · Population (margin of error): 134Pittsburgh, Pennsylvania · Broadband (cable, fiber or DSL): 77.9% · Margin of error: 0.7% · Cellular data plan only: 10.3% · No Internet access: 8.4% · Households: 137,593 · Population: 303,620 · Population (margin of error): 57Elgin, Illinois · Broadband (cable, fiber or DSL): 77.9% · Margin of error: 2.0% · Cellular data plan only: 11.9% · No Internet access: 4.9% · Households: 38,846 · Population: 114,106 · Population (margin of error): 399Billings, Montana · Broadband (cable, fiber or DSL): 77.9% · Margin of error: 1.7% · Cellular data plan only: 9.9% · No Internet access: 6.1% · Households: 50,340 · Population: 118,321 · Population (margin of error): 43Long Beach, California · Broadband (cable, fiber or DSL): 77.9% · Margin of error: 0.7% · Cellular data plan only: 10.8% · No Internet access: 6.1% · Households: 171,309 · Population: 458,491 · Population (margin of error): 71Anchorage, Alaska · Broadband (cable, fiber or DSL): 78.0% · Margin of error: 1.5% · Cellular data plan only: 14.0% · No Internet access: 4.0% · Households: 107,868 · Population: 289,069Chattanooga, Tennessee · Broadband (cable, fiber or DSL): 78.1% · Margin of error: 1.3% · Cellular data plan only: 9.8% · No Internet access: 7.7% · Households: 77,916 · Population: 182,832 · Population (margin of error): 79West Valley City, Utah · Broadband (cable, fiber or DSL): 78.1% · Margin of error: 0.8% · Cellular data plan only: 12.6% · No Internet access: 4.0% · Households: 38,855 · Population: 137,955 · Population (margin of error): 55Hampton, Virginia · Broadband (cable, fiber or DSL): 78.1% · Margin of error: 1.5% · Cellular data plan only: 11.5% · No Internet access: 6.6% · Households: 57,740 · Population: 137,334Joliet, Illinois · Broadband (cable, fiber or DSL): 78.2% · Margin of error: 1.1% · Cellular data plan only: 11.0% · No Internet access: 6.1% · Households: 50,648 · Population: 149,785 · Population (margin of error): 914Greensboro, North Carolina · Broadband (cable, fiber or DSL): 78.3% · Margin of error: 1.0% · Cellular data plan only: 8.9% · No Internet access: 7.7% · Households: 121,189 · Population: 298,564 · Population (margin of error): 102El Cajon, California · Broadband (cable, fiber or DSL): 78.3% · Margin of error: 1.8% · Cellular data plan only: 12.4% · No Internet access: 5.1% · Households: 33,986 · Population: 104,909 · Population (margin of error): 94Fort Lauderdale, Florida · Broadband (cable, fiber or DSL): 78.4% · Margin of error: 1.0% · Cellular data plan only: 10.2% · No Internet access: 6.4% · Households: 80,575 · Population: 183,032 · Population (margin of error): 56Omaha, Nebraska · Broadband (cable, fiber or DSL): 78.4% · Margin of error: 0.8% · Cellular data plan only: 10.6% · No Internet access: 6.5% · Households: 199,926 · Population: 488,197 · Population (margin of error): 68Wilmington, North Carolina · Broadband (cable, fiber or DSL): 78.6% · Margin of error: 1.3% · Cellular data plan only: 10.0% · No Internet access: 5.4% · Households: 55,145 · Population: 118,578 · Population (margin of error): 53Moreno Valley, California · Broadband (cable, fiber or DSL): 78.7% · Margin of error: 1.4% · Cellular data plan only: 12.8% · No Internet access: 3.3% · Households: 54,808 · Population: 210,378 · Population (margin of error): 68Nampa, Idaho · Broadband (cable, fiber or DSL): 78.7% · Margin of error: 1.6% · Cellular data plan only: 11.8% · No Internet access: 3.5% · Households: 37,305 · Population: 106,289 · Population (margin of error): 52Minneapolis, Minnesota · Broadband (cable, fiber or DSL): 78.8% · Margin of error: 0.8% · Cellular data plan only: 9.3% · No Internet access: 5.6% · Households: 188,944 · Population: 426,845 · Population (margin of error): 69Menifee, California · Broadband (cable, fiber or DSL): 78.8% · Margin of error: 2.0% · Cellular data plan only: 9.5% · No Internet access: 5.5% · Households: 35,034 · Population: 107,020 · Population (margin of error): 63Fairfield, California · Broadband (cable, fiber or DSL): 78.9% · Margin of error: 2.0% · Cellular data plan only: 10.4% · No Internet access: 4.5% · Households: 37,955 · Population: 119,985 · Population (margin of error): 50Spokane, Washington · Broadband (cable, fiber or DSL): 79.0% · Margin of error: 0.8% · Cellular data plan only: 9.7% · No Internet access: 6.4% · Households: 96,602 · Population: 229,228 · Population (margin of error): 74Fayetteville, North Carolina · Broadband (cable, fiber or DSL): 79.1% · Margin of error: 0.9% · Cellular data plan only: 9.2% · No Internet access: 7.6% · Households: 81,499 · Population: 209,692 · Population (margin of error): 87Mesa, Arizona · Broadband (cable, fiber or DSL): 79.1% · Margin of error: 0.8% · Cellular data plan only: 10.5% · No Internet access: 5.3% · Households: 196,065 · Population: 507,478 · Population (margin of error): 87Denton, Texas · Broadband (cable, fiber or DSL): 79.1% · Margin of error: 1.7% · Cellular data plan only: 9.2% · No Internet access: 4.4% · Households: 53,983 · Population: 146,987 · Population (margin of error): 68Salem, Oregon · Broadband (cable, fiber or DSL): 79.1% · Margin of error: 1.5% · Cellular data plan only: 10.4% · No Internet access: 5.7% · Households: 67,028 · Population: 176,666 · Population (margin of error): 96Tallahassee, Florida · Broadband (cable, fiber or DSL): 79.1% · Margin of error: 1.1% · Cellular data plan only: 9.8% · No Internet access: 5.3% · Households: 83,637 · Population: 199,696 · Population (margin of error): 118Atlanta, Georgia · Broadband (cable, fiber or DSL): 79.1% · Margin of error: 0.8% · Cellular data plan only: 9.2% · No Internet access: 6.4% · Households: 231,504 · Population: 499,287 · Population (margin of error): 90Athens-Clarke County unified government (balance), Georgia · Broadband (cable, fiber or DSL): 79.2% · Margin of error: 1.5% · Cellular data plan only: 8.9% · No Internet access: 5.0% · Households: 53,397 · Population: 126,987 · Population (margin of error): 688Chesapeake, Virginia · Broadband (cable, fiber or DSL): 79.2% · Margin of error: 1.4% · Cellular data plan only: 10.8% · No Internet access: 5.8% · Households: 92,361 · Population: 251,153Tacoma, Washington · Broadband (cable, fiber or DSL): 79.2% · Margin of error: 1.0% · Cellular data plan only: 11.1% · No Internet access: 5.6% · Households: 91,612 · Population: 220,482 · Population (margin of error): 73Lexington-Fayette urban county, Kentucky · Broadband (cable, fiber or DSL): 79.2% · Margin of error: 0.8% · Cellular data plan only: 9.8% · No Internet access: 5.0% · Households: 137,803 · Population: 321,122Arlington, Texas · Broadband (cable, fiber or DSL): 79.3% · Margin of error: 1.0% · Cellular data plan only: 9.9% · No Internet access: 5.5% · Households: 140,408 · Population: 394,769 · Population (margin of error): 103Spring Valley, Nevada · Broadband (cable, fiber or DSL): 79.3% · Margin of error: 1.1% · Cellular data plan only: 10.2% · No Internet access: 6.1% · Households: 87,275 · Population: 219,913 · Population (margin of error): 5,139Rio Rancho, New Mexico · Broadband (cable, fiber or DSL): 79.4% · Margin of error: 2.1% · Cellular data plan only: 8.3% · No Internet access: 4.4% · Households: 39,192 · Population: 106,533 · Population (margin of error): 72West Covina, California · Broadband (cable, fiber or DSL): 79.4% · Margin of error: 1.8% · Cellular data plan only: 9.3% · No Internet access: 6.4% · Households: 32,586 · Population: 107,436 · Population (margin of error): 76Lafayette, Louisiana · Broadband (cable, fiber or DSL): 79.4% · Margin of error: 1.9% · Cellular data plan only: 10.4% · No Internet access: 7.2% · Households: 52,480 · Population: 121,537 · Population (margin of error): 75Norman, Oklahoma · Broadband (cable, fiber or DSL): 79.4% · Margin of error: 1.7% · Cellular data plan only: 8.4% · No Internet access: 5.4% · Households: 51,489 · Population: 128,714 · Population (margin of error): 76Sacramento, California · Broadband (cable, fiber or DSL): 79.5% · Margin of error: 0.8% · Cellular data plan only: 10.5% · No Internet access: 5.1% · Households: 199,401 · Population: 524,802 · Population (margin of error): 252Sterling Heights, Michigan · Broadband (cable, fiber or DSL): 79.5% · Margin of error: 1.3% · Cellular data plan only: 12.0% · No Internet access: 5.1% · Households: 51,407 · Population: 133,473 · Population (margin of error): 73Washington, District of Columbia · Broadband (cable, fiber or DSL): 79.6% · Margin of error: 0.6% · Cellular data plan only: 8.9% · No Internet access: 6.8% · Households: 321,556 · Population: 672,079Orlando, Florida · Broadband (cable, fiber or DSL): 79.6% · Margin of error: 1.0% · Cellular data plan only: 9.5% · No Internet access: 5.4% · Households: 126,665 · Population: 311,732 · Population (margin of error): 141Nashville-Davidson metropolitan government (balance), Tennessee · Broadband (cable, fiber or DSL): 79.6% · Margin of error: 0.6% · Cellular data plan only: 9.6% · No Internet access: 6.5% · Households: 303,539 · Population: 684,298 · Population (margin of error): 77Cape Coral, Florida · Broadband (cable, fiber or DSL): 79.6% · Margin of error: 0.9% · Cellular data plan only: 10.9% · No Internet access: 5.1% · Households: 79,258 · Population: 206,387 · Population (margin of error): 42Jersey City, New Jersey · Broadband (cable, fiber or DSL): 79.7% · Margin of error: 1.0% · Cellular data plan only: 11.2% · No Internet access: 6.5% · Households: 123,132 · Population: 289,691 · Population (margin of error): 57Eugene, Oregon · Broadband (cable, fiber or DSL): 79.8% · Margin of error: 1.4% · Cellular data plan only: 9.3% · No Internet access: 3.7% · Households: 76,140 · Population: 177,520 · Population (margin of error): 70Surprise, Arizona · Broadband (cable, fiber or DSL): 79.8% · Margin of error: 1.2% · Cellular data plan only: 11.9% · No Internet access: 3.1% · Households: 54,442 · Population: 149,519 · Population (margin of error): 64Gresham, Oregon · Broadband (cable, fiber or DSL): 79.9% · Margin of error: 1.8% · Cellular data plan only: 8.8% · No Internet access: 6.6% · Households: 42,061 · Population: 112,818 · Population (margin of error): 58Costa Mesa, California · Broadband (cable, fiber or DSL): 79.9% · Margin of error: 1.0% · Cellular data plan only: 12.4% · No Internet access: 2.9% · Households: 41,628 · Population: 110,538 · Population (margin of error): 83Charleston, South Carolina · Broadband (cable, fiber or DSL): 79.9% · Margin of error: 1.2% · Cellular data plan only: 9.3% · No Internet access: 5.4% · Households: 66,408 · Population: 152,014 · Population (margin of error): 77Manchester, New Hampshire · Broadband (cable, fiber or DSL): 80.0% · Margin of error: 1.3% · Cellular data plan only: 9.3% · No Internet access: 7.2% · Households: 49,546 · Population: 115,415 · Population (margin of error): 61Huntsville, Alabama · Broadband (cable, fiber or DSL): 80.0% · Margin of error: 1.3% · Cellular data plan only: 8.4% · No Internet access: 6.2% · Households: 94,058 · Population: 218,814 · Population (margin of error): 61San Buenaventura (Ventura), California · Broadband (cable, fiber or DSL): 80.0% · Margin of error: 1.6% · Cellular data plan only: 9.3% · No Internet access: 4.6% · Households: 42,119 · Population: 109,900 · Population (margin of error): 62Pasadena, California · Broadband (cable, fiber or DSL): 80.1% · Margin of error: 1.2% · Cellular data plan only: 9.7% · No Internet access: 5.7% · Households: 57,131 · Population: 136,462 · Population (margin of error): 63Fullerton, California · Broadband (cable, fiber or DSL): 80.1% · Margin of error: 0.9% · Cellular data plan only: 11.0% · No Internet access: 3.7% · Households: 47,484 · Population: 141,278 · Population (margin of error): 65Boston, Massachusetts · Broadband (cable, fiber or DSL): 80.1% · Margin of error: 0.7% · Cellular data plan only: 9.0% · No Internet access: 7.0% · Households: 279,216 · Population: 663,972 · Population (margin of error): 76Aurora, Colorado · Broadband (cable, fiber or DSL): 80.2% · Margin of error: 0.8% · Cellular data plan only: 10.6% · No Internet access: 4.2% · Households: 143,179 · Population: 390,201 · Population (margin of error): 117Sparks, Nevada · Broadband (cable, fiber or DSL): 80.4% · Margin of error: 1.1% · Cellular data plan only: 9.1% · No Internet access: 4.5% · Households: 41,331 · Population: 109,106 · Population (margin of error): 75Palm Bay, Florida · Broadband (cable, fiber or DSL): 80.5% · Margin of error: 1.9% · Cellular data plan only: 8.5% · No Internet access: 6.5% · Households: 44,432 · Population: 125,273 · Population (margin of error): 104Hesperia, California · Broadband (cable, fiber or DSL): 80.5% · Margin of error: 1.1% · Cellular data plan only: 9.7% · No Internet access: 4.2% · Households: 29,215 · Population: 100,141 · Population (margin of error): 44Chico, California · Broadband (cable, fiber or DSL): 80.6% · Margin of error: 1.5% · Cellular data plan only: 10.0% · No Internet access: 4.3% · Households: 41,934 · Population: 102,032 · Population (margin of error): 57Antioch, California · Broadband (cable, fiber or DSL): 80.7% · Margin of error: 1.4% · Cellular data plan only: 10.7% · No Internet access: 3.1% · Households: 37,042 · Population: 115,759 · Population (margin of error): 110Vancouver, Washington · Broadband (cable, fiber or DSL): 80.7% · Margin of error: 1.1% · Cellular data plan only: 9.1% · No Internet access: 5.7% · Households: 79,747 · Population: 192,696 · Population (margin of error): 110Everett, Washington · Broadband (cable, fiber or DSL): 80.7% · Margin of error: 1.9% · Cellular data plan only: 8.9% · No Internet access: 5.7% · Households: 44,255 · Population: 111,083 · Population (margin of error): 80St. Petersburg, Florida · Broadband (cable, fiber or DSL): 80.9% · Margin of error: 1.0% · Cellular data plan only: 9.7% · No Internet access: 5.4% · Households: 116,772 · Population: 260,646 · Population (margin of error): 54Rochester, Minnesota · Broadband (cable, fiber or DSL): 80.9% · Margin of error: 1.4% · Cellular data plan only: 8.3% · No Internet access: 4.2% · Households: 50,658 · Population: 121,638 · Population (margin of error): 72Murfreesboro, Tennessee · Broadband (cable, fiber or DSL): 80.9% · Margin of error: 1.6% · Cellular data plan only: 10.5% · No Internet access: 4.3% · Households: 58,567 · Population: 157,547 · Population (margin of error): 53Alexandria, Virginia · Broadband (cable, fiber or DSL): 80.9% · Margin of error: 1.2% · Cellular data plan only: 10.6% · No Internet access: 4.7% · Households: 75,349 · Population: 156,788Corona, California · Broadband (cable, fiber or DSL): 81.0% · Margin of error: 1.1% · Cellular data plan only: 7.4% · No Internet access: 5.6% · Households: 48,083 · Population: 158,839 · Population (margin of error): 97Clovis, California · Broadband (cable, fiber or DSL): 81.1% · Margin of error: 0.8% · Cellular data plan only: 10.2% · No Internet access: 4.1% · Households: 41,080 · Population: 122,719 · Population (margin of error): 69Oxnard, California · Broadband (cable, fiber or DSL): 81.1% · Margin of error: 1.0% · Cellular data plan only: 7.8% · No Internet access: 7.4% · Households: 51,798 · Population: 201,014 · Population (margin of error): 62Orange, California · Broadband (cable, fiber or DSL): 81.2% · Margin of error: 1.3% · Cellular data plan only: 10.8% · No Internet access: 3.1% · Households: 44,867 · Population: 138,723 · Population (margin of error): 68Tempe, Arizona · Broadband (cable, fiber or DSL): 81.3% · Margin of error: 1.6% · Cellular data plan only: 9.8% · No Internet access: 3.0% · Households: 77,053 · Population: 186,419 · Population (margin of error): 81Boise City, Idaho · Broadband (cable, fiber or DSL): 81.3% · Margin of error: 1.3% · Cellular data plan only: 9.7% · No Internet access: 3.7% · Households: 99,616 · Population: 235,701 · Population (margin of error): 54Columbia, Missouri · Broadband (cable, fiber or DSL): 81.4% · Margin of error: 1.8% · Cellular data plan only: 6.1% · No Internet access: 4.2% · Households: 51,381 · Population: 127,200 · Population (margin of error): 64Rancho Cucamonga, California · Broadband (cable, fiber or DSL): 81.4% · Margin of error: 1.3% · Cellular data plan only: 9.3% · No Internet access: 3.6% · Households: 57,945 · Population: 174,693 · Population (margin of error): 83Riverside, California · Broadband (cable, fiber or DSL): 81.4% · Margin of error: 0.8% · Cellular data plan only: 9.4% · No Internet access: 4.5% · Households: 92,368 · Population: 316,241 · Population (margin of error): 115Hayward, California · Broadband (cable, fiber or DSL): 81.6% · Margin of error: 1.3% · Cellular data plan only: 9.8% · No Internet access: 4.7% · Households: 49,470 · Population: 159,201 · Population (margin of error): 69Spring Hill, Florida · Broadband (cable, fiber or DSL): 81.7% · Margin of error: 1.6% · Cellular data plan only: 9.0% · No Internet access: 4.7% · Households: 44,985 · Population: 118,814 · Population (margin of error): 2,310Sioux Falls, South Dakota · Broadband (cable, fiber or DSL): 81.7% · Margin of error: 0.8% · Cellular data plan only: 9.2% · No Internet access: 4.5% · Households: 82,836 · Population: 197,642 · Population (margin of error): 66Lincoln, Nebraska · Broadband (cable, fiber or DSL): 81.8% · Margin of error: 0.7% · Cellular data plan only: 8.2% · No Internet access: 4.6% · Households: 120,698 · Population: 291,932 · Population (margin of error): 71Denver, Colorado · Broadband (cable, fiber or DSL): 81.8% · Margin of error: 0.5% · Cellular data plan only: 8.1% · No Internet access: 4.3% · Households: 329,578 · Population: 713,734Columbus, Ohio · Broadband (cable, fiber or DSL): 82.0% · Margin of error: 0.6% · Cellular data plan only: 9.0% · No Internet access: 5.5% · Households: 386,581 · Population: 906,480 · Population (margin of error): 134Stamford, Connecticut · Broadband (cable, fiber or DSL): 82.0% · Margin of error: 1.3% · Cellular data plan only: 9.6% · No Internet access: 4.7% · Households: 54,165 · Population: 135,806 · Population (margin of error): 40Aurora, Illinois · Broadband (cable, fiber or DSL): 82.0% · Margin of error: 1.3% · Cellular data plan only: 7.0% · No Internet access: 6.5% · Households: 60,396 · Population: 179,867 · Population (margin of error): 480Chula Vista, California · Broadband (cable, fiber or DSL): 82.2% · Margin of error: 0.9% · Cellular data plan only: 10.0% · No Internet access: 4.4% · Households: 85,193 · Population: 275,030 · Population (margin of error): 61Charlotte, North Carolina · Broadband (cable, fiber or DSL): 82.3% · Margin of error: 0.5% · Cellular data plan only: 8.4% · No Internet access: 5.6% · Households: 361,100 · Population: 886,283 · Population (margin of error): 226Kent, Washington · Broadband (cable, fiber or DSL): 82.3% · Margin of error: 1.5% · Cellular data plan only: 11.3% · No Internet access: 3.4% · Households: 46,727 · Population: 135,015 · Population (margin of error): 73San Francisco, California · Broadband (cable, fiber or DSL): 82.4% · Margin of error: 0.6% · Cellular data plan only: 8.2% · No Internet access: 5.2% · Households: 362,650 · Population: 836,321Durham, North Carolina · Broadband (cable, fiber or DSL): 82.4% · Margin of error: 1.4% · Cellular data plan only: 8.8% · No Internet access: 4.6% · Households: 123,318 · Population: 288,465 · Population (margin of error): 163South Fulton, Georgia · Broadband (cable, fiber or DSL): 82.4% · Margin of error: 2.4% · Cellular data plan only: 9.6% · No Internet access: 3.9% · Households: 39,519 · Population: 109,157 · Population (margin of error): 51Carrollton, Texas · Broadband (cable, fiber or DSL): 82.5% · Margin of error: 1.0% · Cellular data plan only: 10.0% · No Internet access: 3.5% · Households: 51,059 · Population: 132,741 · Population (margin of error): 170Peoria, Arizona · Broadband (cable, fiber or DSL): 82.6% · Margin of error: 0.9% · Cellular data plan only: 8.3% · No Internet access: 3.9% · Households: 73,165 · Population: 194,338 · Population (margin of error): 207Daly City, California · Broadband (cable, fiber or DSL): 82.6% · Margin of error: 1.8% · Cellular data plan only: 9.8% · No Internet access: 5.0% · Households: 32,225 · Population: 102,560 · Population (margin of error): 52Madison, Wisconsin · Broadband (cable, fiber or DSL): 82.7% · Margin of error: 1.1% · Cellular data plan only: 6.8% · No Internet access: 3.2% · Households: 125,787 · Population: 275,568 · Population (margin of error): 76Portland, Oregon · Broadband (cable, fiber or DSL): 82.7% · Margin of error: 0.6% · Cellular data plan only: 9.0% · No Internet access: 4.2% · Households: 287,030 · Population: 642,715 · Population (margin of error): 699Quincy, Massachusetts · Broadband (cable, fiber or DSL): 82.8% · Margin of error: 1.1% · Cellular data plan only: 9.4% · No Internet access: 5.0% · Households: 45,571 · Population: 101,361 · Population (margin of error): 35Renton, Washington · Broadband (cable, fiber or DSL): 82.9% · Margin of error: 1.5% · Cellular data plan only: 9.7% · No Internet access: 3.9% · Households: 41,251 · Population: 105,279 · Population (margin of error): 70Concord, California · Broadband (cable, fiber or DSL): 82.9% · Margin of error: 1.4% · Cellular data plan only: 9.9% · No Internet access: 3.2% · Households: 45,635 · Population: 124,260 · Population (margin of error): 42Oceanside, California · Broadband (cable, fiber or DSL): 82.9% · Margin of error: 0.7% · Cellular data plan only: 9.4% · No Internet access: 3.7% · Households: 61,417 · Population: 172,542 · Population (margin of error): 76Santa Rosa, California · Broadband (cable, fiber or DSL): 82.9% · Margin of error: 1.2% · Cellular data plan only: 8.7% · No Internet access: 3.7% · Households: 68,234 · Population: 177,216 · Population (margin of error): 54Austin, Texas · Broadband (cable, fiber or DSL): 82.9% · Margin of error: 0.6% · Cellular data plan only: 7.9% · No Internet access: 4.6% · Households: 440,294 · Population: 967,862 · Population (margin of error): 373Broken Arrow, Oklahoma · Broadband (cable, fiber or DSL): 83.0% · Margin of error: 0.8% · Cellular data plan only: 8.8% · No Internet access: 4.4% · Households: 43,634 · Population: 115,919 · Population (margin of error): 85Fontana, California · Broadband (cable, fiber or DSL): 83.0% · Margin of error: 1.1% · Cellular data plan only: 8.8% · No Internet access: 2.6% · Households: 57,111 · Population: 211,921 · Population (margin of error): 98Lewisville, Texas · Broadband (cable, fiber or DSL): 83.1% · Margin of error: 1.7% · Cellular data plan only: 10.6% · No Internet access: 2.2% · Households: 50,147 · Population: 128,313 · Population (margin of error): 470Henderson, Nevada · Broadband (cable, fiber or DSL): 83.2% · Margin of error: 0.8% · Cellular data plan only: 8.2% · No Internet access: 4.1% · Households: 127,507 · Population: 324,523 · Population (margin of error): 51Thousand Oaks, California · Broadband (cable, fiber or DSL): 83.2% · Margin of error: 1.2% · Cellular data plan only: 7.9% · No Internet access: 4.2% · Households: 46,268 · Population: 125,676 · Population (margin of error): 60San Tan Valley, Arizona · Broadband (cable, fiber or DSL): 83.3% · Margin of error: 1.8% · Cellular data plan only: 8.9% · No Internet access: 1.9% · Households: 33,646 · Population: 105,231 · Population (margin of error): 2,932Clarksville, Tennessee · Broadband (cable, fiber or DSL): 83.3% · Margin of error: 1.2% · Cellular data plan only: 7.3% · No Internet access: 4.5% · Households: 64,863 · Population: 171,897 · Population (margin of error): 51Raleigh, North Carolina · Broadband (cable, fiber or DSL): 83.5% · Margin of error: 0.8% · Cellular data plan only: 7.8% · No Internet access: 3.8% · Households: 196,924 · Population: 470,763 · Population (margin of error): 429Fort Collins, Colorado · Broadband (cable, fiber or DSL): 83.6% · Margin of error: 1.2% · Cellular data plan only: 6.1% · No Internet access: 2.5% · Households: 70,782 · Population: 169,705 · Population (margin of error): 63Simi Valley, California · Broadband (cable, fiber or DSL): 83.7% · Margin of error: 1.1% · Cellular data plan only: 8.3% · No Internet access: 4.3% · Households: 44,355 · Population: 125,769 · Population (margin of error): 77Colorado Springs, Colorado · Broadband (cable, fiber or DSL): 83.7% · Margin of error: 0.8% · Cellular data plan only: 8.3% · No Internet access: 4.2% · Households: 198,070 · Population: 483,099 · Population (margin of error): 79San Diego, California · Broadband (cable, fiber or DSL): 83.8% · Margin of error: 0.5% · Cellular data plan only: 8.9% · No Internet access: 3.9% · Households: 522,146 · Population: 1,385,061 · Population (margin of error): 147Port St. Lucie, Florida · Broadband (cable, fiber or DSL): 83.9% · Margin of error: 1.4% · Cellular data plan only: 7.7% · No Internet access: 3.7% · Households: 79,185 · Population: 220,453 · Population (margin of error): 73Lakewood, Colorado · Broadband (cable, fiber or DSL): 83.9% · Margin of error: 1.3% · Cellular data plan only: 7.3% · No Internet access: 4.8% · Households: 69,296 · Population: 156,309 · Population (margin of error): 154Westminster, Colorado · Broadband (cable, fiber or DSL): 84.0% · Margin of error: 1.1% · Cellular data plan only: 7.5% · No Internet access: 4.5% · Households: 47,995 · Population: 115,546 · Population (margin of error): 83West Jordan, Utah · Broadband (cable, fiber or DSL): 84.2% · Margin of error: 1.4% · Cellular data plan only: 9.2% · No Internet access: 1.6% · Households: 36,295 · Population: 116,277 · Population (margin of error): 73Roseville, California · Broadband (cable, fiber or DSL): 84.3% · Margin of error: 0.9% · Cellular data plan only: 7.6% · No Internet access: 3.5% · Households: 57,921 · Population: 152,438 · Population (margin of error): 80Bend, Oregon · Broadband (cable, fiber or DSL): 84.3% · Margin of error: 1.6% · Cellular data plan only: 8.0% · No Internet access: 3.8% · Households: 43,278 · Population: 101,472 · Population (margin of error): 76San Jose, California · Broadband (cable, fiber or DSL): 84.4% · Margin of error: 0.5% · Cellular data plan only: 8.0% · No Internet access: 3.8% · Households: 326,767 · Population: 990,054 · Population (margin of error): 201Burbank, California · Broadband (cable, fiber or DSL): 84.4% · Margin of error: 1.1% · Cellular data plan only: 6.6% · No Internet access: 5.9% · Households: 43,066 · Population: 105,165 · Population (margin of error): 81Virginia Beach, Virginia · Broadband (cable, fiber or DSL): 84.5% · Margin of error: 0.8% · Cellular data plan only: 8.1% · No Internet access: 4.1% · Households: 179,800 · Population: 457,066Vacaville, California · Broadband (cable, fiber or DSL): 84.6% · Margin of error: 1.4% · Cellular data plan only: 7.8% · No Internet access: 3.5% · Households: 34,401 · Population: 102,085 · Population (margin of error): 63Thornton, Colorado · Broadband (cable, fiber or DSL): 84.7% · Margin of error: 1.5% · Cellular data plan only: 8.5% · No Internet access: 2.7% · Households: 49,579 · Population: 142,878 · Population (margin of error): 77Huntington Beach, California · Broadband (cable, fiber or DSL): 84.7% · Margin of error: 1.0% · Cellular data plan only: 8.6% · No Internet access: 3.4% · Households: 77,549 · Population: 196,010 · Population (margin of error): 78Santa Clarita, California · Broadband (cable, fiber or DSL): 84.8% · Margin of error: 1.1% · Cellular data plan only: 8.5% · No Internet access: 2.5% · Households: 75,281 · Population: 229,021 · Population (margin of error): 97Torrance, California · Broadband (cable, fiber or DSL): 84.9% · Margin of error: 1.3% · Cellular data plan only: 7.8% · No Internet access: 3.6% · Households: 55,317 · Population: 143,499 · Population (margin of error): 65Arvada, Colorado · Broadband (cable, fiber or DSL): 85.1% · Margin of error: 1.2% · Cellular data plan only: 8.5% · No Internet access: 3.5% · Households: 49,766 · Population: 122,835 · Population (margin of error): 66San Mateo, California · Broadband (cable, fiber or DSL): 85.3% · Margin of error: 1.4% · Cellular data plan only: 8.6% · No Internet access: 3.7% · Households: 39,760 · Population: 103,555 · Population (margin of error): 58Enterprise, Nevada · Broadband (cable, fiber or DSL): 85.4% · Margin of error: 1.2% · Cellular data plan only: 8.0% · No Internet access: 2.6% · Households: 82,039 · Population: 232,043 · Population (margin of error): 5,278Seattle, Washington · Broadband (cable, fiber or DSL): 85.6% · Margin of error: 0.5% · Cellular data plan only: 6.9% · No Internet access: 3.4% · Households: 353,019 · Population: 741,440 · Population (margin of error): 121Cambridge, Massachusetts · Broadband (cable, fiber or DSL): 85.7% · Margin of error: 1.3% · Cellular data plan only: 6.5% · No Internet access: 3.1% · Households: 49,592 · Population: 117,794 · Population (margin of error): 60Goodyear, Arizona · Broadband (cable, fiber or DSL): 85.8% · Margin of error: 1.3% · Cellular data plan only: 8.3% · No Internet access: 1.9% · Households: 35,839 · Population: 102,891 · Population (margin of error): 62Davie, Florida · Broadband (cable, fiber or DSL): 85.9% · Margin of error: 1.6% · Cellular data plan only: 7.0% · No Internet access: 4.5% · Households: 38,377 · Population: 106,412 · Population (margin of error): 62Ann Arbor, Michigan · Broadband (cable, fiber or DSL): 85.9% · Margin of error: 0.7% · Cellular data plan only: 6.3% · No Internet access: 2.0% · Households: 49,907 · Population: 121,179 · Population (margin of error): 50Boulder, Colorado · Broadband (cable, fiber or DSL): 86.0% · Margin of error: 1.3% · Cellular data plan only: 7.1% · No Internet access: 2.3% · Households: 43,825 · Population: 106,274 · Population (margin of error): 49Lee's Summit, Missouri · Broadband (cable, fiber or DSL): 86.1% · Margin of error: 1.1% · Cellular data plan only: 7.4% · No Internet access: 2.5% · Households: 39,531 · Population: 102,583 · Population (margin of error): 51Berkeley, California · Broadband (cable, fiber or DSL): 86.1% · Margin of error: 1.4% · Cellular data plan only: 6.6% · No Internet access: 3.5% · Households: 46,762 · Population: 120,223 · Population (margin of error): 50Hillsboro, Oregon · Broadband (cable, fiber or DSL): 86.1% · Margin of error: 1.8% · Cellular data plan only: 7.5% · No Internet access: 2.0% · Households: 41,304 · Population: 107,050 · Population (margin of error): 43Sandy Springs, Georgia · Broadband (cable, fiber or DSL): 86.1% · Margin of error: 1.6% · Cellular data plan only: 6.3% · No Internet access: 3.2% · Households: 52,035 · Population: 107,198 · Population (margin of error): 40Coral Springs, Florida · Broadband (cable, fiber or DSL): 86.2% · Margin of error: 1.8% · Cellular data plan only: 6.3% · No Internet access: 3.1% · Households: 44,659 · Population: 133,962 · Population (margin of error): 64Richardson, Texas · Broadband (cable, fiber or DSL): 86.2% · Margin of error: 2.0% · Cellular data plan only: 6.4% · No Internet access: 2.5% · Households: 45,444 · Population: 118,269 · Population (margin of error): 91Riverview, Florida · Broadband (cable, fiber or DSL): 86.4% · Margin of error: 1.8% · Cellular data plan only: 9.5% · No Internet access: 1.8% · Households: 38,144 · Population: 107,776 · Population (margin of error): 3,794Elk Grove, California · Broadband (cable, fiber or DSL): 86.4% · Margin of error: 1.2% · Cellular data plan only: 7.5% · No Internet access: 2.2% · Households: 54,707 · Population: 177,221 · Population (margin of error): 134Arlington, Virginia · Broadband (cable, fiber or DSL): 86.4% · Margin of error: 1.0% · Cellular data plan only: 7.3% · No Internet access: 3.4% · Households: 111,530 · Population: 235,463Meridian, Idaho · Broadband (cable, fiber or DSL): 86.6% · Margin of error: 1.3% · Cellular data plan only: 6.1% · No Internet access: 2.4% · Households: 45,486 · Population: 124,865 · Population (margin of error): 75Chandler, Arizona · Broadband (cable, fiber or DSL): 86.7% · Margin of error: 0.9% · Cellular data plan only: 6.8% · No Internet access: 2.9% · Households: 105,867 · Population: 278,123 · Population (margin of error): 77Scottsdale, Arizona · Broadband (cable, fiber or DSL): 86.8% · Margin of error: 0.6% · Cellular data plan only: 7.1% · No Internet access: 3.0% · Households: 117,787 · Population: 242,169 · Population (margin of error): 118Olathe, Kansas · Broadband (cable, fiber or DSL): 86.9% · Margin of error: 0.9% · Cellular data plan only: 7.3% · No Internet access: 2.8% · Households: 51,985 · Population: 143,720 · Population (margin of error): 63Murrieta, California · Broadband (cable, fiber or DSL): 87.0% · Margin of error: 0.8% · Cellular data plan only: 7.0% · No Internet access: 3.0% · Households: 35,452 · Population: 111,621 · Population (margin of error): 63Fishers, Indiana · Broadband (cable, fiber or DSL): 87.2% · Margin of error: 1.9% · Cellular data plan only: 8.0% · No Internet access: 1.3% · Households: 36,680 · Population: 100,918 · Population (margin of error): 35McKinney, Texas · Broadband (cable, fiber or DSL): 87.2% · Margin of error: 1.1% · Cellular data plan only: 5.4% · No Internet access: 4.2% · Households: 70,787 · Population: 202,314 · Population (margin of error): 65League City, Texas · Broadband (cable, fiber or DSL): 87.2% · Margin of error: 1.3% · Cellular data plan only: 6.8% · No Internet access: 2.3% · Households: 42,827 · Population: 114,885 · Population (margin of error): 119Round Rock, Texas · Broadband (cable, fiber or DSL): 87.5% · Margin of error: 1.5% · Cellular data plan only: 6.7% · No Internet access: 3.1% · Households: 46,764 · Population: 124,288 · Population (margin of error): 898Overland Park, Kansas · Broadband (cable, fiber or DSL): 87.6% · Margin of error: 0.7% · Cellular data plan only: 6.9% · No Internet access: 2.8% · Households: 82,965 · Population: 197,199 · Population (margin of error): 94Irvine, California · Broadband (cable, fiber or DSL): 87.6% · Margin of error: 0.6% · Cellular data plan only: 6.7% · No Internet access: 1.8% · Households: 111,979 · Population: 308,160 · Population (margin of error): 117Carlsbad, California · Broadband (cable, fiber or DSL): 87.7% · Margin of error: 1.4% · Cellular data plan only: 5.9% · No Internet access: 2.7% · Households: 43,981 · Population: 114,500 · Population (margin of error): 85Santa Clara, California · Broadband (cable, fiber or DSL): 87.8% · Margin of error: 1.4% · Cellular data plan only: 6.3% · No Internet access: 2.8% · Households: 48,601 · Population: 129,239 · Population (margin of error): 65Temecula, California · Broadband (cable, fiber or DSL): 87.9% · Margin of error: 1.6% · Cellular data plan only: 6.4% · No Internet access: 2.0% · Households: 35,423 · Population: 110,404 · Population (margin of error): 64Plano, Texas · Broadband (cable, fiber or DSL): 88.5% · Margin of error: 1.1% · Cellular data plan only: 6.6% · No Internet access: 1.9% · Households: 110,522 · Population: 287,339 · Population (margin of error): 74Sugar Land, Texas · Broadband (cable, fiber or DSL): 88.6% · Margin of error: 1.2% · Cellular data plan only: 7.1% · No Internet access: 1.4% · Households: 37,830 · Population: 109,735 · Population (margin of error): 64Carmel, Indiana · Broadband (cable, fiber or DSL): 88.9% · Margin of error: 1.3% · Cellular data plan only: 6.6% · No Internet access: 1.8% · Households: 38,160 · Population: 100,501 · Population (margin of error): 198Pearland, Texas · Broadband (cable, fiber or DSL): 89.0% · Margin of error: 1.3% · Cellular data plan only: 5.9% · No Internet access: 1.4% · Households: 43,526 · Population: 125,983 · Population (margin of error): 75Centennial, Colorado · Broadband (cable, fiber or DSL): 89.1% · Margin of error: 0.9% · Cellular data plan only: 5.5% · No Internet access: 2.0% · Households: 41,518 · Population: 107,386 · Population (margin of error): 70The Woodlands, Texas · Broadband (cable, fiber or DSL): 89.3% · Margin of error: 1.3% · Cellular data plan only: 5.7% · No Internet access: 2.0% · Households: 42,657 · Population: 116,916 · Population (margin of error): 5,154Sunnyvale, California · Broadband (cable, fiber or DSL): 89.3% · Margin of error: 1.4% · Cellular data plan only: 6.0% · No Internet access: 2.4% · Households: 58,791 · Population: 153,455 · Population (margin of error): 92Columbia, Maryland · Broadband (cable, fiber or DSL): 89.5% · Margin of error: 1.2% · Cellular data plan only: 5.5% · No Internet access: 3.2% · Households: 41,218 · Population: 105,871 · Population (margin of error): 2,631Fremont, California · Broadband (cable, fiber or DSL): 89.7% · Margin of error: 0.9% · Cellular data plan only: 5.0% · No Internet access: 3.1% · Households: 77,019 · Population: 228,518 · Population (margin of error): 57Gilbert, Arizona · Broadband (cable, fiber or DSL): 89.7% · Margin of error: 0.8% · Cellular data plan only: 5.5% · No Internet access: 1.8% · Households: 91,712 · Population: 271,118 · Population (margin of error): 101Allen, Texas · Broadband (cable, fiber or DSL): 89.8% · Margin of error: 1.5% · Cellular data plan only: 6.1% · No Internet access: 2.1% · Households: 36,307 · Population: 107,684 · Population (margin of error): 44Bellevue, Washington · Broadband (cable, fiber or DSL): 90.1% · Margin of error: 0.6% · Cellular data plan only: 5.5% · No Internet access: 1.7% · Households: 61,433 · Population: 151,199 · Population (margin of error): 61Naperville, Illinois · Broadband (cable, fiber or DSL): 90.4% · Margin of error: 1.2% · Cellular data plan only: 5.2% · No Internet access: 1.5% · Households: 54,286 · Population: 149,424 · Population (margin of error): 393Cary, North Carolina · Broadband (cable, fiber or DSL): 90.4% · Margin of error: 0.5% · Cellular data plan only: 4.7% · No Internet access: 1.7% · Households: 67,964 · Population: 176,686 · Population (margin of error): 139Frisco, Texas · Broadband (cable, fiber or DSL): 91.2% · Margin of error: 1.2% · Cellular data plan only: 5.5% · No Internet access: 1.4% · Households: 74,081 · Population: 210,238 · Population (margin of error): 162Highlands Ranch, Colorado · Broadband (cable, fiber or DSL): 92.4% · Margin of error: 1.1% · Cellular data plan only: 4.1% · No Internet access: 1.3% · Households: 38,076 · Population: 101,437 · Population (margin of error): 2,176New YorkLos AngelesChicagoHoustonPhoenixSan FranciscoSeattleDenverDallasAtlantaMiamiBostonMinneapolisDetroitNew OrleansWashingtonPortlandLas VegasSalt Lake CityKansas CityJacksonvilleCharlotteAnchorageUrban HonoluluBroadband (cable, fiber or DSL)46.7%92.4%
Summary

Darker amber is a higher share of households with a broadband Internet subscription such as cable, fiber or DSL. Each city is a marked point on the US state map. Alaska and Hawaii are inset. Puerto Rico cities are in the ranking and table but are not drawn here.

Among the 346 US cities with at least 100,000 residents, a typical city has a broadband Internet subscription such as cable, fiber or DSL in 77.9% of households, the midpoint, so half of these cities sit above that share and half sit below. Highlands Ranch, Colorado leads at 92.4%, then Frisco, Texas at 91.2% and Cary, North Carolina at 90.4%. Brownsville, Texas is lowest at 46.7%. 5 cities reach 90%. These are each city's own ACS household shares, not a United States Internet rate.

In short

77.9%typical citymidpoint of city broadband shares, not a US rate
92.4%Highlands Ranch, Coloradohighest cable/fiber/DSL broadband share
46.7%Brownsville, Texaslowest among cities of 100,000 or more
5cities at or above 90%cable, fiber or DSL broadband share
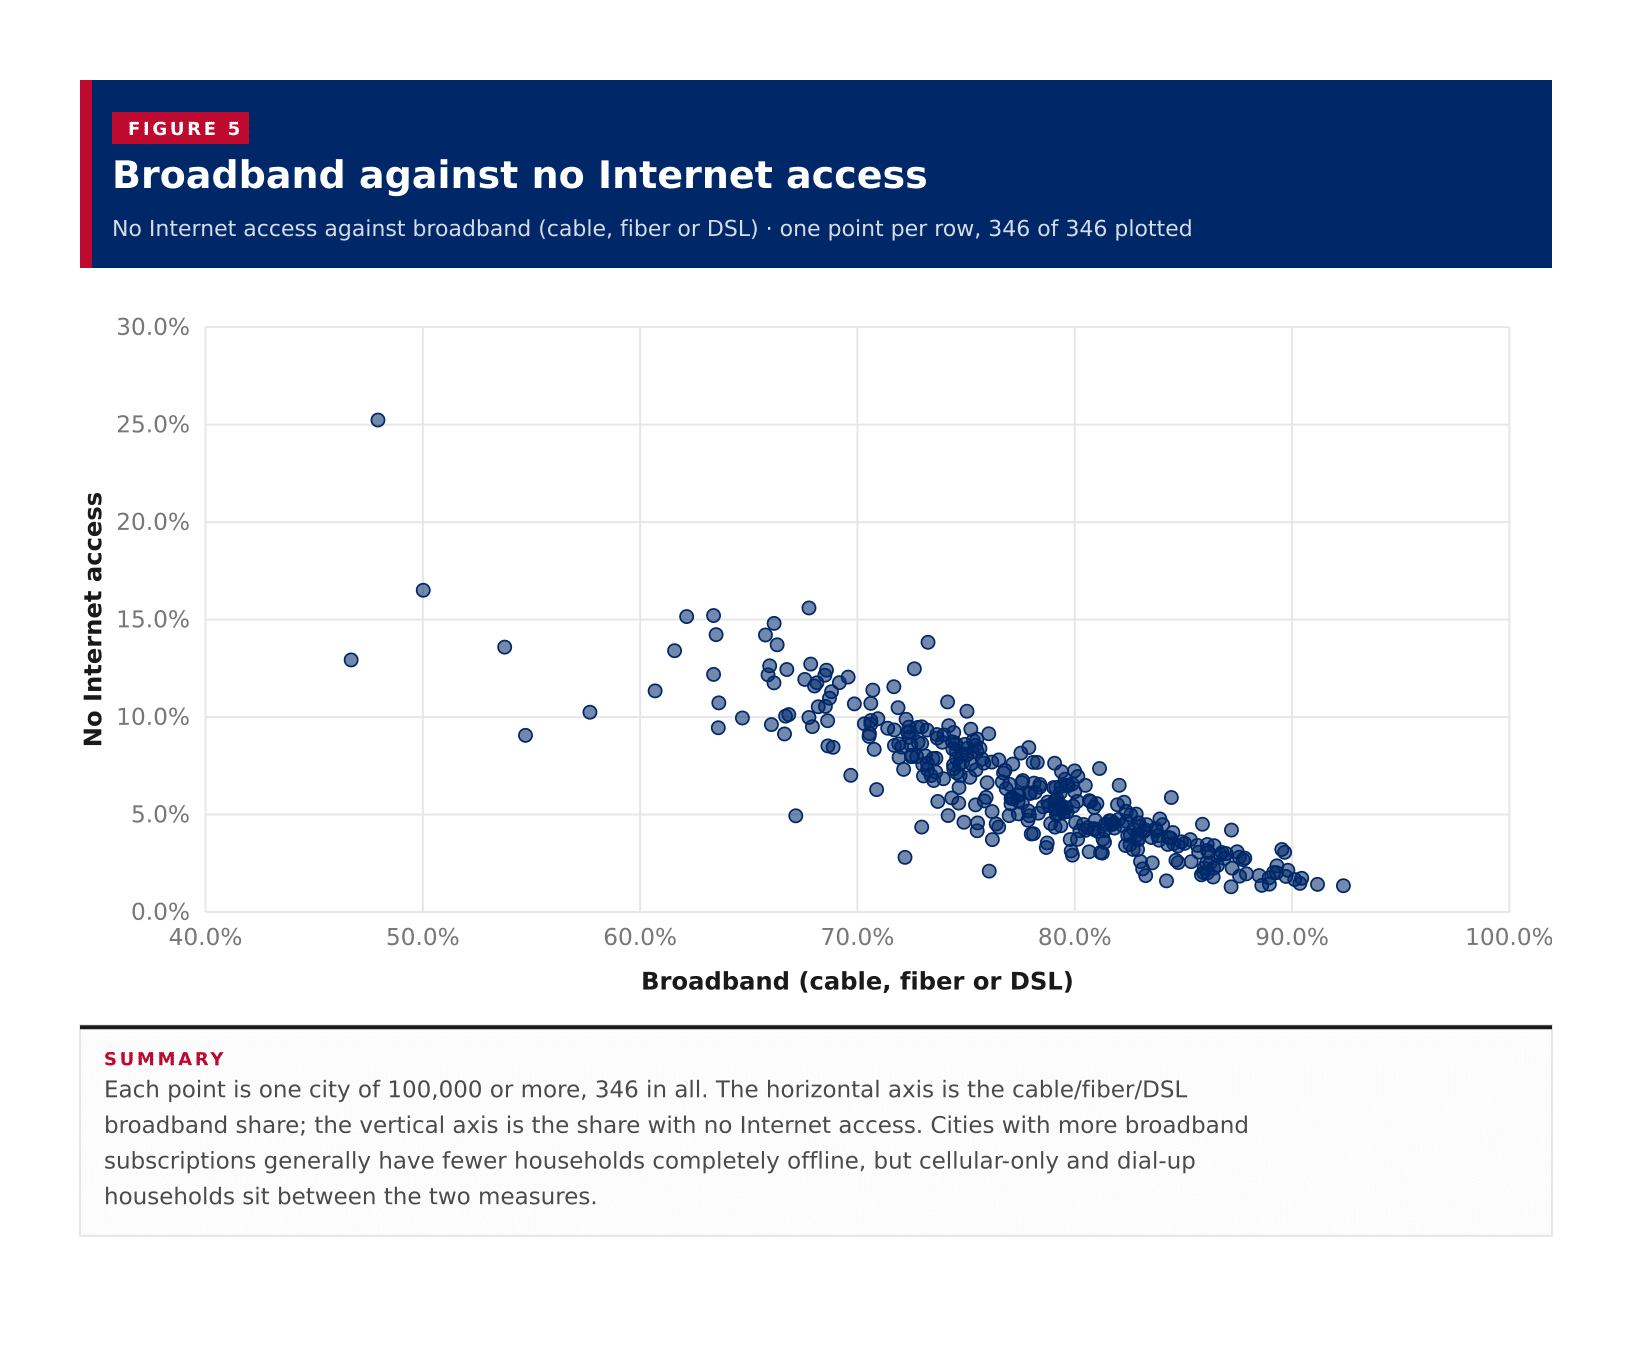
25.2%San Juan, Puerto Ricohighest share with no Internet access
Figure 1

Broadband Internet, all published cities

Broadband (cable, fiber or DSL) · all 346 · ranked high to low

346 items
View100%
DownloadPDFImageCSV
Broadband Internet, all published citiesEvery incorporated or Census place with at least 100,000 residents, 346 in all. Highlands Ranch, Colorado leads at 92.4%, then Frisco, Texas at 91.2% and Cary, North Carolina at 90.4%. Brownsville, Texas is lowest at 46.7%. The middle city sits at 77.9%. 5 cities reach 90%. The ranking is each city's own share of households with a broadband subscription such as cable, fiber or DSL on the 2023 ACS five-year estimates.0.0%20.0%40.0%60.0%80.0%100.0%Share of households with cable, fiber or DSL broadband92.4%Highlands Ranch, Colorado91.2%Frisco, Texas90.4%Cary, North Carolina90.4%Naperville, Illinois90.1%Bellevue, Washington89.8%Allen, Texas89.7%Gilbert, Arizona89.7%Fremont, California89.5%Columbia, Maryland89.3%Sunnyvale, California89.3%The Woodlands, Texas89.1%Centennial, Colorado89.0%Pearland, Texas88.9%Carmel, Indiana88.6%Sugar Land, Texas88.5%Plano, Texas87.9%Temecula, California87.8%Santa Clara, California87.7%Carlsbad, California87.6%Irvine, California87.6%Overland Park, Kansas87.5%Round Rock, Texas87.2%League City, Texas87.2%McKinney, Texas87.2%Fishers, Indiana87.0%Murrieta, California86.9%Olathe, Kansas86.8%Scottsdale, Arizona86.7%Chandler, Arizona86.6%Meridian, Idaho86.4%Arlington, Virginia86.4%Elk Grove, California86.4%Riverview, Florida86.2%Richardson, Texas86.2%Coral Springs, Florida86.1%Sandy Springs, Georgia86.1%Hillsboro, Oregon86.1%Berkeley, California86.1%Lee's Summit, Missouri86.0%Boulder, Colorado85.9%Ann Arbor, Michigan85.9%Davie, Florida85.8%Goodyear, Arizona85.7%Cambridge, Massachusetts85.6%Seattle, Washington85.4%Enterprise, Nevada85.3%San Mateo, California85.1%Arvada, Colorado84.9%Torrance, California84.8%Santa Clarita, California84.7%Huntington Beach, California84.7%Thornton, Colorado84.6%Vacaville, California84.5%Virginia Beach, Virginia84.4%Burbank, California84.4%San Jose, California84.3%Bend, Oregon84.3%Roseville, California84.2%West Jordan, Utah84.0%Westminster, Colorado83.9%Lakewood, Colorado83.9%Port St. Lucie, Florida83.8%San Diego, California83.7%Colorado Springs, Colorado83.7%Simi Valley, California83.6%Fort Collins, Colorado83.5%Raleigh, North Carolina83.3%Clarksville, Tennessee83.3%San Tan Valley, Arizona83.2%Thousand Oaks, California83.2%Henderson, Nevada83.1%Lewisville, Texas83.0%Fontana, California83.0%Broken Arrow, Oklahoma82.9%Austin, Texas82.9%Santa Rosa, California82.9%Oceanside, California82.9%Concord, California82.9%Renton, Washington82.8%Quincy, Massachusetts82.7%Portland, Oregon82.7%Madison, Wisconsin82.6%Daly City, California82.6%Peoria, Arizona82.5%Carrollton, Texas82.4%South Fulton, Georgia82.4%Durham, North Carolina82.4%San Francisco, California82.3%Kent, Washington82.3%Charlotte, North Carolina82.2%Chula Vista, California82.0%Aurora, Illinois82.0%Stamford, Connecticut82.0%Columbus, Ohio81.8%Denver, Colorado81.8%Lincoln, Nebraska81.7%Sioux Falls, South Dakota81.7%Spring Hill, Florida81.6%Hayward, California81.4%Riverside, California81.4%Rancho Cucamonga, California81.4%Columbia, Missouri81.3%Boise City, Idaho81.3%Tempe, Arizona81.2%Orange, California81.1%Oxnard, California81.1%Clovis, California81.0%Corona, California80.9%Alexandria, Virginia80.9%Murfreesboro, Tennessee80.9%Rochester, Minnesota80.9%St. Petersburg, Florida80.7%Everett, Washington80.7%Vancouver, Washington80.7%Antioch, California80.6%Chico, California80.5%Hesperia, California80.5%Palm Bay, Florida80.4%Sparks, Nevada80.2%Aurora, Colorado80.1%Boston, Massachusetts80.1%Fullerton, California80.1%Pasadena, California80.0%San Buenaventura (Ventura),…80.0%Huntsville, Alabama80.0%Manchester, New Hampshire79.9%Charleston, South Carolina79.9%Costa Mesa, California79.9%Gresham, Oregon79.8%Surprise, Arizona79.8%Eugene, Oregon79.7%Jersey City, New Jersey79.6%Cape Coral, Florida79.6%Nashville-Davidson metropol…79.6%Orlando, Florida79.6%Washington, District of Col…79.5%Sterling Heights, Michigan79.5%Sacramento, California79.4%Norman, Oklahoma79.4%Lafayette, Louisiana79.4%West Covina, California79.4%Rio Rancho, New Mexico79.3%Spring Valley, Nevada79.3%Arlington, Texas79.2%Lexington-Fayette urban cou…79.2%Tacoma, Washington79.2%Chesapeake, Virginia79.2%Athens-Clarke County unifie…79.1%Atlanta, Georgia79.1%Tallahassee, Florida79.1%Salem, Oregon79.1%Denton, Texas79.1%Mesa, Arizona79.1%Fayetteville, North Carolina79.0%Spokane, Washington78.9%Fairfield, California78.8%Menifee, California78.8%Minneapolis, Minnesota78.7%Nampa, Idaho78.7%Moreno Valley, California78.6%Wilmington, North Carolina78.4%Omaha, Nebraska78.4%Fort Lauderdale, Florida78.3%El Cajon, California78.3%Greensboro, North Carolina78.2%Joliet, Illinois78.1%Hampton, Virginia78.1%West Valley City, Utah78.1%Chattanooga, Tennessee78.0%Anchorage, Alaska77.9%Long Beach, California77.9%Billings, Montana77.9%Elgin, Illinois77.9%Pittsburgh, Pennsylvania77.9%Tampa, Florida77.8%Salt Lake City, Utah77.6%Pembroke Pines, Florida77.6%Concord, North Carolina77.6%Hollywood, Florida77.5%Oakland, California77.4%Victorville, California77.4%Norwalk, California77.4%North Las Vegas, Nevada77.4%Miramar, Florida77.2%Dearborn, Michigan77.1%Glendale, California77.1%Richmond, California77.1%Grand Prairie, Texas77.1%Cedar Rapids, Iowa77.0%Los Angeles, California77.0%Rialto, California76.8%Fort Worth, Texas76.8%Visalia, California76.7%Greeley, Colorado76.7%Lehigh Acres, Florida76.5%Spokane Valley, Washington76.5%Downey, California76.4%Ontario, California76.2%Brandon, Florida76.2%Bakersfield, California76.2%Reno, Nevada76.1%College Station, Texas76.0%Columbia, South Carolina76.0%Garden Grove, California75.9%St. Paul, Minnesota75.8%Jurupa Valley, California75.8%Phoenix, Arizona75.7%Yonkers, New York75.6%Warren, Michigan75.5%Garland, Texas75.5%Escondido, California75.5%Grand Rapids, Michigan75.5%Corpus Christi, Texas75.5%Urban Honolulu, Hawaii75.4%Anaheim, California75.4%Cincinnati, Ohio75.3%Pompano Beach, Florida75.3%Montgomery, Alabama75.2%Santa Maria, California75.2%Albany, New York75.2%Kansas City, Missouri75.1%Green Bay, Wisconsin75.0%Lowell, Massachusetts75.0%Little Rock, Arkansas74.9%Worcester, Massachusetts74.9%Gainesville, Florida74.8%San Antonio, Texas74.8%Albuquerque, New Mexico74.7%Midland, Texas74.7%Wichita, Kansas74.7%Newport News, Virginia74.7%Mesquite, Texas74.6%Fort Wayne, Indiana74.6%Las Cruces, New Mexico74.6%West Palm Beach, Florida74.5%Lansing, Michigan74.5%New Haven, Connecticut74.4%Las Vegas, Nevada74.4%Lynn, Massachusetts74.4%Savannah, Georgia74.4%Santa Ana, California74.4%New York, New York74.3%Modesto, California74.2%Akron, Ohio74.2%Fargo, North Dakota74.1%Edinburg, Texas74.0%Fresno, California74.0%Lancaster, California73.9%Amarillo, Texas73.7%Palmdale, California73.7%Metairie, Louisiana73.7%Davenport, Iowa73.6%Abilene, Texas73.6%Killeen, Texas73.5%Inglewood, California73.5%Evansville, Indiana73.4%Oklahoma City, Oklahoma73.2%Hialeah, Florida73.2%Tucson, Arizona73.2%Stockton, California73.2%Lakeland, Florida73.1%Lubbock, Texas73.0%Jacksonville, Florida73.0%Louisville/Jefferson County…73.0%Independence, Missouri73.0%Vallejo, California73.0%Dallas, Texas72.8%Brockton, Massachusetts72.8%Winston-Salem, North Caroli…72.7%McAllen, Texas72.6%Laredo, Texas72.5%Indianapolis city (balance)…72.5%High Point, North Carolina72.5%Chicago, Illinois72.4%Norfolk, Virginia72.4%Providence, Rhode Island72.4%Philadelphia, Pennsylvania72.3%Richmond, Virginia72.2%Wichita Falls, Texas72.2%Provo, Utah72.1%Pomona, California72.0%Tulsa, Oklahoma71.9%Peoria, Illinois71.9%Houston, Texas71.9%Clearwater, Florida71.7%Glendale, Arizona71.7%El Paso, Texas71.7%Milwaukee, Wisconsin71.4%Columbus, Georgia70.9%Buffalo, New York70.9%Pasadena, Texas70.8%Paradise, Nevada70.7%Macon-Bibb County, Georgia70.6%Tuscaloosa, Alabama70.6%Toledo, Ohio70.6%Baton Rouge, Louisiana70.6%Augusta-Richmond County con…70.5%Waco, Texas70.3%Kansas City, Kansas69.9%Syracuse, New York69.7%Irving, Texas69.6%Pueblo, Colorado69.2%Knoxville, Tennessee68.9%San Bernardino, California68.8%St. Louis, Missouri68.7%Rochester, New York68.6%Des Moines, Iowa68.6%Odessa, Texas68.6%Topeka, Kansas68.5%Bridgeport, Connecticut68.5%New Bedford, Massachusetts68.2%South Bend, Indiana68.1%Rockford, Illinois68.0%Miami Gardens, Florida67.9%Jackson, Mississippi67.8%New Orleans, Louisiana67.8%Miami, Florida67.8%Beaumont, Texas67.6%Birmingham, Alabama67.2%Salinas, California66.8%Sunrise Manor, Nevada66.8%Springfield, Massachusetts66.7%Paterson, New Jersey66.6%Springfield, Illinois66.3%East Los Angeles, California66.2%Shreveport, Louisiana66.2%Baltimore, Maryland66.0%North Charleston, South Car…66.0%Dayton, Ohio65.9%Allentown, Pennsylvania65.8%Mobile, Alabama64.7%El Monte, California63.6%Hartford, Connecticut63.6%Springfield, Missouri63.5%Waterbury, Connecticut63.4%Memphis, Tennessee63.4%Cleveland, Ohio62.1%Newark, New Jersey61.6%Detroit, Michigan60.7%Elizabeth, New Jersey57.7%Carolina, Puerto Rico54.7%Tyler, Texas53.8%Bayamón, Puerto Rico50.0%Ponce, Puerto Rico47.9%San Juan, Puerto Rico46.7%Brownsville, Texas
Summary

Every incorporated or Census place with at least 100,000 residents, 346 in all. Highlands Ranch, Colorado leads at 92.4%, then Frisco, Texas at 91.2% and Cary, North Carolina at 90.4%. Brownsville, Texas is lowest at 46.7%. The middle city sits at 77.9%. 5 cities reach 90%. The ranking is each city's own share of households with a broadband subscription such as cable, fiber or DSL on the 2023 ACS five-year estimates.

Figure 2

No Internet access, all published cities

No Internet access · all 346 · ranked high to low

346 items
View100%
DownloadPDFImageCSV
No Internet access, all published citiesShare of households with no Internet access, for every included city. San Juan, Puerto Rico is highest at 25.2%, then Ponce, Puerto Rico at 16.5% and Miami, Florida at 15.6%. Fishers, Indiana is lowest at 1.3%. This is the ACS "no Internet access" line, not the reverse of broadband alone: some households have dial-up, cellular data only, or Internet without a subscription.0.0%10.0%20.0%30.0%Share of households with no Internet access25.2%San Juan, Puerto Rico16.5%Ponce, Puerto Rico15.6%Miami, Florida15.2%Cleveland, Ohio15.2%Newark, New Jersey14.8%Shreveport, Louisiana14.2%Waterbury, Connecticut14.2%Mobile, Alabama13.8%Hialeah, Florida13.7%East Los Angeles, California13.6%Bayamón, Puerto Rico13.4%Detroit, Michigan12.9%Brownsville, Texas12.7%New Orleans, Louisiana12.6%Dayton, Ohio12.5%Laredo, Texas12.4%Springfield, Massachusetts12.4%Topeka, Kansas12.2%Memphis, Tennessee12.2%Allentown, Pennsylvania12.1%New Bedford, Massachusetts12.1%Pueblo, Colorado11.9%Birmingham, Alabama11.8%Knoxville, Tennessee11.8%Rockford, Illinois11.8%Baltimore, Maryland11.6%Miami Gardens, Florida11.6%Milwaukee, Wisconsin11.4%Macon-Bibb County, Georgia11.3%Elizabeth, New Jersey11.3%St. Louis, Missouri11.0%Rochester, New York10.8%Edinburg, Texas10.7%Hartford, Connecticut10.7%Toledo, Ohio10.7%Syracuse, New York10.5%Bridgeport, Connecticut10.5%South Bend, Indiana10.5%Clearwater, Florida10.3%Lowell, Massachusetts10.2%Carolina, Puerto Rico10.1%Sunrise Manor, Nevada10.0%Paterson, New Jersey10.0%Beaumont, Texas10.0%El Monte, California9.9%Buffalo, New York9.9%Wichita Falls, Texas9.8%Tuscaloosa, Alabama9.8%Odessa, Texas9.7%Kansas City, Kansas9.6%Baton Rouge, Louisiana9.6%North Charleston, South Car…9.6%Akron, Ohio9.5%Jackson, Mississippi9.5%Independence, Missouri9.5%Philadelphia, Pennsylvania9.5%Winston-Salem, North Caroli…9.5%Springfield, Missouri9.4%Columbus, Georgia9.4%Albany, New York9.3%El Paso, Texas9.3%Lakeland, Florida9.3%Norfolk, Virginia9.2%Lynn, Massachusetts9.2%Richmond, Virginia9.2%Augusta-Richmond County con…9.1%Columbia, South Carolina9.1%Springfield, Illinois9.1%Davenport, Iowa9.1%Fresno, California9.1%Tyler, Texas9.0%Waco, Texas9.0%Providence, Rhode Island8.9%Metairie, Louisiana8.9%Corpus Christi, Texas8.8%Pompano Beach, Florida8.7%New York, New York8.7%Amarillo, Texas8.7%Brockton, Massachusetts8.6%Dallas, Texas8.6%New Haven, Connecticut8.6%Lansing, Michigan8.6%Houston, Texas8.6%Worcester, Massachusetts8.6%Chicago, Illinois8.5%Cincinnati, Ohio8.5%Glendale, Arizona8.5%Des Moines, Iowa8.5%Tulsa, Oklahoma8.4%San Bernardino, California8.4%Pittsburgh, Pennsylvania8.4%Green Bay, Wisconsin8.4%Warren, Michigan8.4%Santa Ana, California8.3%Paradise, Nevada8.3%West Palm Beach, Florida8.2%Grand Rapids, Michigan8.2%Montgomery, Alabama8.2%Oakland, California8.1%Albuquerque, New Mexico8.1%Little Rock, Arkansas8.0%Indianapolis city (balance)…8.0%Lubbock, Texas8.0%McAllen, Texas8.0%High Point, North Carolina7.9%Peoria, Illinois7.9%Abilene, Texas7.9%Las Cruces, New Mexico7.9%Evansville, Indiana7.8%Yonkers, New York7.8%Spokane Valley, Washington7.7%Reno, Nevada7.7%Chattanooga, Tennessee7.7%Greensboro, North Carolina7.7%San Antonio, Texas7.6%Phoenix, Arizona7.6%Fayetteville, North Carolina7.6%Stockton, California7.6%Santa Maria, California7.6%Glendale, California7.6%Wichita, Kansas7.6%Louisville/Jefferson County…7.5%Savannah, Georgia7.4%Oxnard, California7.3%Las Vegas, Nevada7.3%Pomona, California7.3%Tucson, Arizona7.3%Urban Honolulu, Hawaii7.3%Visalia, California7.2%Manchester, New Hampshire7.2%Lafayette, Louisiana7.2%Killeen, Texas7.1%Fort Wayne, Indiana7.1%Greeley, Colorado7.0%Irving, Texas7.0%Oklahoma City, Oklahoma7.0%Midland, Texas7.0%Jacksonville, Florida7.0%Boston, Massachusetts6.9%Kansas City, Missouri6.8%Lancaster, California6.8%Washington, District of Col…6.7%Inglewood, California6.7%Pembroke Pines, Florida6.7%Lehigh Acres, Florida6.6%Hollywood, Florida6.6%Garden Grove, California6.6%Hampton, Virginia6.6%Gresham, Oregon6.5%Los Angeles, California6.5%Omaha, Nebraska6.5%Nashville-Davidson metropol…6.5%Aurora, Illinois6.5%Palm Bay, Florida6.5%Jersey City, New Jersey6.4%West Covina, California6.4%Fort Lauderdale, Florida6.4%Newport News, Virginia6.4%Spokane, Washington6.4%Atlanta, Georgia6.3%Fort Worth, Texas6.3%Pasadena, Texas6.2%Huntsville, Alabama6.1%Joliet, Illinois6.1%Spring Valley, Nevada6.1%Billings, Montana6.1%Long Beach, California6.0%Victorville, California6.0%Miramar, Florida5.9%St. Paul, Minnesota5.9%Burbank, California5.9%Richmond, California5.9%Modesto, California5.8%Grand Prairie, Texas5.8%Dearborn, Michigan5.8%Chesapeake, Virginia5.7%Salem, Oregon5.7%Vancouver, Washington5.7%Jurupa Valley, California5.7%North Las Vegas, Nevada5.7%Pasadena, California5.7%Palmdale, California5.7%Everett, Washington5.6%Minneapolis, Minnesota5.6%Charlotte, North Carolina5.6%Concord, North Carolina5.6%Tacoma, Washington5.6%Mesquite, Texas5.6%Corona, California5.5%Cedar Rapids, Iowa5.5%Columbus, Ohio5.5%Arlington, Texas5.5%Anaheim, California5.5%Menifee, California5.4%Norman, Oklahoma5.4%Charleston, South Carolina5.4%Wilmington, North Carolina5.4%St. Petersburg, Florida5.4%Orlando, Florida5.3%Mesa, Arizona5.3%Tallahassee, Florida5.2%Tampa, Florida5.2%San Francisco, California5.2%Bakersfield, California5.1%Cape Coral, Florida5.1%Sterling Heights, Michigan5.1%Sacramento, California5.1%El Cajon, California5.0%Norwalk, California5.0%Lexington-Fayette urban cou…5.0%Quincy, Massachusetts5.0%Daly City, California5.0%Athens-Clarke County unifie…4.9%Fargo, North Dakota4.9%Rialto, California4.9%Elgin, Illinois4.9%Salinas, California4.8%Lakewood, Colorado4.7%Stamford, Connecticut4.7%Salt Lake City, Utah4.7%Alexandria, Virginia4.7%Hayward, California4.7%Spring Hill, Florida4.6%Durham, North Carolina4.6%Gainesville, Florida4.6%San Buenaventura (Ventura),…4.6%Austin, Texas4.6%Garland, Texas4.6%Lincoln, Nebraska4.5%Fairfield, California4.5%Ontario, California4.5%Davie, Florida4.5%Riverside, California4.5%Sparks, Nevada4.5%Clarksville, Tennessee4.5%Westminster, Colorado4.5%Sioux Falls, South Dakota4.4%Chula Vista, California4.4%Rio Rancho, New Mexico4.4%Broken Arrow, Oklahoma4.4%Vallejo, California4.4%Downey, California4.4%Denton, Texas4.3%Chico, California4.3%Denver, Colorado4.3%Murfreesboro, Tennessee4.3%Simi Valley, California4.2%Portland, Oregon4.2%Rochester, Minnesota4.2%Thousand Oaks, California4.2%McKinney, Texas4.2%Hesperia, California4.2%Columbia, Missouri4.2%Colorado Springs, Colorado4.2%Aurora, Colorado4.2%Escondido, California4.1%Clovis, California4.1%Henderson, Nevada4.1%Virginia Beach, Virginia4.0%West Valley City, Utah4.0%Anchorage, Alaska3.9%Renton, Washington3.9%Peoria, Arizona3.9%South Fulton, Georgia3.9%San Diego, California3.8%Bend, Oregon3.8%Raleigh, North Carolina3.8%San Jose, California3.7%Boise City, Idaho3.7%Fullerton, California3.7%Eugene, Oregon3.7%Santa Rosa, California3.7%Brandon, Florida3.7%San Mateo, California3.7%Oceanside, California3.7%Port St. Lucie, Florida3.6%Torrance, California3.6%Rancho Cucamonga, California3.5%Nampa, Idaho3.5%Arvada, Colorado3.5%Vacaville, California3.5%Roseville, California3.5%Berkeley, California3.5%Carrollton, Texas3.4%Seattle, Washington3.4%Kent, Washington3.4%Arlington, Virginia3.4%Huntington Beach, California3.3%Moreno Valley, California3.2%Madison, Wisconsin3.2%Columbia, Maryland3.2%Concord, California3.2%Sandy Springs, Georgia3.1%Surprise, Arizona3.1%Antioch, California3.1%Round Rock, Texas3.1%Cambridge, Massachusetts3.1%Fremont, California3.1%Coral Springs, Florida3.1%Orange, California3.0%Scottsdale, Arizona3.0%Tempe, Arizona3.0%Murrieta, California2.9%Chandler, Arizona2.9%Costa Mesa, California2.8%Overland Park, Kansas2.8%Provo, Utah2.8%Santa Clara, California2.8%Olathe, Kansas2.7%Carlsbad, California2.7%Thornton, Colorado2.6%Fontana, California2.6%Enterprise, Nevada2.5%Santa Clarita, California2.5%Fort Collins, Colorado2.5%Richardson, Texas2.5%Lee's Summit, Missouri2.4%Meridian, Idaho2.4%Sunnyvale, California2.3%Boulder, Colorado2.3%League City, Texas2.2%Elk Grove, California2.2%Lewisville, Texas2.1%Allen, Texas2.1%College Station, Texas2.0%Centennial, Colorado2.0%Ann Arbor, Michigan2.0%The Woodlands, Texas2.0%Hillsboro, Oregon2.0%Temecula, California1.9%Goodyear, Arizona1.9%Plano, Texas1.9%San Tan Valley, Arizona1.8%Irvine, California1.8%Gilbert, Arizona1.8%Riverview, Florida1.8%Carmel, Indiana1.7%Cary, North Carolina1.7%Bellevue, Washington1.6%West Jordan, Utah1.5%Naperville, Illinois1.4%Pearland, Texas1.4%Frisco, Texas1.4%Sugar Land, Texas1.3%Highlands Ranch, Colorado1.3%Fishers, Indiana
Summary

Share of households with no Internet access, for every included city. San Juan, Puerto Rico is highest at 25.2%, then Ponce, Puerto Rico at 16.5% and Miami, Florida at 15.6%. Fishers, Indiana is lowest at 1.3%. This is the ACS "no Internet access" line, not the reverse of broadband alone: some households have dial-up, cellular data only, or Internet without a subscription.

Figure 3

Cellular data plan only, all published cities

Cellular data plan only · all 346 · ranked high to low

346 items
View100%
DownloadPDFImageCSV
Cellular data plan only, all published citiesShare of households with a cellular data plan and no other type of Internet subscription, for every included city. Brownsville, Texas is highest at 33.3%, then Tyler, Texas at 30.3% and Ponce, Puerto Rico at 27.3%. These households are counted in broadband of any type on some ACS lines, but they are not in the cable/fiber/DSL broadband share that ranks this page.0.0%10.0%20.0%30.0%40.0%Share of households with cellular data only33.3%Brownsville, Texas30.3%Tyler, Texas27.3%Ponce, Puerto Rico25.7%Carolina, Puerto Rico25.3%Bayamón, Puerto Rico23.1%Salinas, California21.5%San Juan, Puerto Rico19.6%Irving, Texas19.5%Paterson, New Jersey19.3%Hartford, Connecticut18.4%Jackson, Mississippi18.2%Springfield, Illinois18.0%Beaumont, Texas18.0%Memphis, Tennessee17.7%Detroit, Michigan16.8%Pasadena, Texas16.6%Newark, New Jersey16.5%El Monte, California16.0%Garland, Texas15.7%Vallejo, California15.4%Brandon, Florida15.1%Bridgeport, Connecticut15.1%East Los Angeles, California15.0%Allentown, Pennsylvania15.0%Des Moines, Iowa14.9%Newport News, Virginia14.9%High Point, North Carolina14.8%Sunrise Manor, Nevada14.8%Palmdale, California14.6%Springfield, Massachusetts14.6%Springfield, Missouri14.6%Baton Rouge, Louisiana14.6%Dayton, Ohio14.4%Baltimore, Maryland14.4%Louisville/Jefferson County…14.4%South Bend, Indiana14.4%North Charleston, South Car…14.3%Houston, Texas14.3%Killeen, Texas14.3%Jacksonville, Florida14.3%Brockton, Massachusetts14.2%Mobile, Alabama14.2%Waterbury, Connecticut14.2%Abilene, Texas14.1%McAllen, Texas14.1%Tulsa, Oklahoma14.1%Metairie, Louisiana14.0%Waco, Texas14.0%Fort Wayne, Indiana14.0%Anaheim, California14.0%Anchorage, Alaska13.9%Oklahoma City, Oklahoma13.9%Rockford, Illinois13.9%Rochester, New York13.9%Paradise, Nevada13.8%Bakersfield, California13.7%Indianapolis city (balance)…13.7%New Orleans, Louisiana13.6%Birmingham, Alabama13.5%St. Louis, Missouri13.5%Inglewood, California13.5%Stockton, California13.4%New Bedford, Massachusetts13.4%Elizabeth, New Jersey13.3%Cleveland, Ohio13.3%Peoria, Illinois13.3%Tucson, Arizona13.3%Lancaster, California13.2%Providence, Rhode Island13.2%Kansas City, Kansas13.2%Escondido, California13.2%Topeka, Kansas13.1%Shreveport, Louisiana13.1%Independence, Missouri13.0%Buffalo, New York13.0%Richmond, California13.0%New York, New York13.0%Wichita, Kansas12.9%Norfolk, Virginia12.9%Evansville, Indiana12.8%Moreno Valley, California12.8%Dallas, Texas12.8%Pueblo, Colorado12.8%Mesquite, Texas12.7%Modesto, California12.7%Philadelphia, Pennsylvania12.7%Cedar Rapids, Iowa12.6%Miami Gardens, Florida12.6%Garden Grove, California12.6%West Valley City, Utah12.6%Santa Ana, California12.5%El Paso, Texas12.5%Toledo, Ohio12.4%Savannah, Georgia12.4%El Cajon, California12.4%Pomona, California12.4%Downey, California12.4%Costa Mesa, California12.3%Las Vegas, Nevada12.3%New Haven, Connecticut12.3%Warren, Michigan12.3%Syracuse, New York12.2%St. Paul, Minnesota12.2%Worcester, Massachusetts12.1%Ontario, California12.1%Amarillo, Texas12.0%Chicago, Illinois12.0%Sterling Heights, Michigan12.0%Clearwater, Florida12.0%Tuscaloosa, Alabama12.0%San Antonio, Texas12.0%Macon-Bibb County, Georgia12.0%Little Rock, Arkansas11.9%Surprise, Arizona11.9%North Las Vegas, Nevada11.9%Elgin, Illinois11.8%Nampa, Idaho11.8%Knoxville, Tennessee11.8%Columbus, Georgia11.8%Lynn, Massachusetts11.8%Odessa, Texas11.7%Los Angeles, California11.7%Tampa, Florida11.7%Fort Worth, Texas11.6%Lowell, Massachusetts11.6%Milwaukee, Wisconsin11.6%Midland, Texas11.6%Concord, North Carolina11.5%Akron, Ohio11.5%Hampton, Virginia11.5%Yonkers, New York11.5%Winston-Salem, North Caroli…11.5%Victorville, California11.5%Glendale, California11.4%Lansing, Michigan11.4%West Palm Beach, Florida11.4%Davenport, Iowa11.4%Hollywood, Florida11.3%Lakeland, Florida11.3%Urban Honolulu, Hawaii11.3%Wichita Falls, Texas11.3%Kent, Washington11.3%Fargo, North Dakota11.3%Corpus Christi, Texas11.3%San Bernardino, California11.2%Phoenix, Arizona11.2%Jersey City, New Jersey11.2%Kansas City, Missouri11.2%Dearborn, Michigan11.2%Miramar, Florida11.2%Grand Rapids, Michigan11.2%Lubbock, Texas11.1%Santa Maria, California11.1%Las Cruces, New Mexico11.1%Green Bay, Wisconsin11.1%Tacoma, Washington11.1%Montgomery, Alabama11.1%Jurupa Valley, California11.0%Joliet, Illinois11.0%Lehigh Acres, Florida11.0%Glendale, Arizona11.0%Salt Lake City, Utah11.0%Fullerton, California11.0%Augusta-Richmond County con…10.9%Fresno, California10.9%Cape Coral, Florida10.8%Long Beach, California10.8%Orange, California10.8%Chesapeake, Virginia10.8%Pompano Beach, Florida10.7%Albuquerque, New Mexico10.7%Grand Prairie, Texas10.7%Cincinnati, Ohio10.7%Antioch, California10.6%Lewisville, Texas10.6%Omaha, Nebraska10.6%Aurora, Colorado10.6%Alexandria, Virginia10.5%Sacramento, California10.5%Richmond, Virginia10.5%Murfreesboro, Tennessee10.5%Mesa, Arizona10.5%Visalia, California10.4%Lafayette, Louisiana10.4%Fairfield, California10.4%Salem, Oregon10.3%Pembroke Pines, Florida10.3%Pittsburgh, Pennsylvania10.2%Albany, New York10.2%Spring Valley, Nevada10.2%Clovis, California10.2%Greeley, Colorado10.2%Fort Lauderdale, Florida10.0%Chico, California10.0%Wilmington, North Carolina10.0%Chula Vista, California10.0%Spokane Valley, Washington10.0%Carrollton, Texas9.9%Concord, California9.9%Oakland, California9.9%Billings, Montana9.9%Edinburg, Texas9.9%Arlington, Texas9.8%Hayward, California9.8%Daly City, California9.8%Tallahassee, Florida9.8%Tempe, Arizona9.8%Lexington-Fayette urban cou…9.8%Chattanooga, Tennessee9.7%St. Petersburg, Florida9.7%Renton, Washington9.7%Hesperia, California9.7%Spokane, Washington9.7%Boise City, Idaho9.7%Reno, Nevada9.7%Pasadena, California9.6%Nashville-Davidson metropol…9.6%South Fulton, Georgia9.6%Stamford, Connecticut9.5%Laredo, Texas9.5%Menifee, California9.5%Orlando, Florida9.5%Columbia, South Carolina9.5%Riverview, Florida9.4%Quincy, Massachusetts9.4%Riverside, California9.4%Norwalk, California9.4%Oceanside, California9.4%Miami, Florida9.4%Rialto, California9.3%West Covina, California9.3%San Buenaventura (Ventura),…9.3%Rancho Cucamonga, California9.3%Eugene, Oregon9.3%Minneapolis, Minnesota9.3%Manchester, New Hampshire9.3%Charleston, South Carolina9.2%Sioux Falls, South Dakota9.2%Fayetteville, North Carolina9.2%Atlanta, Georgia9.2%West Jordan, Utah9.2%Denton, Texas9.1%Vancouver, Washington9.1%Sparks, Nevada9.0%Columbus, Ohio9.0%Boston, Massachusetts9.0%Portland, Oregon9.0%Spring Hill, Florida8.9%Everett, Washington8.9%San Diego, California8.9%San Tan Valley, Arizona8.9%Athens-Clarke County unifie…8.9%Washington, District of Col…8.9%Greensboro, North Carolina8.8%Fontana, California8.8%Gresham, Oregon8.8%Broken Arrow, Oklahoma8.8%Durham, North Carolina8.7%Santa Rosa, California8.6%Huntington Beach, California8.6%San Mateo, California8.5%Palm Bay, Florida8.5%Santa Clarita, California8.5%Arvada, Colorado8.5%Gainesville, Florida8.5%Thornton, Colorado8.4%Charlotte, North Carolina8.4%Norman, Oklahoma8.4%Huntsville, Alabama8.3%Colorado Springs, Colorado8.3%Simi Valley, California8.3%Peoria, Arizona8.3%Rochester, Minnesota8.3%Goodyear, Arizona8.3%Rio Rancho, New Mexico8.2%Henderson, Nevada8.2%Lincoln, Nebraska8.2%San Francisco, California8.1%Virginia Beach, Virginia8.1%Denver, Colorado8.0%San Jose, California8.0%Bend, Oregon8.0%Enterprise, Nevada8.0%Fishers, Indiana7.9%Austin, Texas7.9%Thousand Oaks, California7.8%Oxnard, California7.8%Raleigh, North Carolina7.8%Vacaville, California7.8%Torrance, California7.7%Port St. Lucie, Florida7.6%Hialeah, Florida7.6%Roseville, California7.5%Westminster, Colorado7.5%Elk Grove, California7.5%Hillsboro, Oregon7.4%Lee's Summit, Missouri7.4%Corona, California7.3%Olathe, Kansas7.3%Clarksville, Tennessee7.3%Arlington, Virginia7.3%Lakewood, Colorado7.1%Sugar Land, Texas7.1%Scottsdale, Arizona7.1%Boulder, Colorado7.0%Murrieta, California7.0%Aurora, Illinois7.0%Davie, Florida6.9%Seattle, Washington6.9%Overland Park, Kansas6.8%Madison, Wisconsin6.8%Chandler, Arizona6.8%League City, Texas6.7%College Station, Texas6.7%Round Rock, Texas6.7%Irvine, California6.6%Berkeley, California6.6%Plano, Texas6.6%Carmel, Indiana6.6%Burbank, California6.5%Provo, Utah6.5%Cambridge, Massachusetts6.4%Richardson, Texas6.4%Temecula, California6.3%Ann Arbor, Michigan6.3%Santa Clara, California6.3%Sandy Springs, Georgia6.3%Coral Springs, Florida6.1%Meridian, Idaho6.1%Allen, Texas6.1%Columbia, Missouri6.1%Fort Collins, Colorado6.0%Sunnyvale, California5.9%Pearland, Texas5.9%Carlsbad, California5.7%The Woodlands, Texas5.5%Centennial, Colorado5.5%Bellevue, Washington5.5%Frisco, Texas5.5%Gilbert, Arizona5.5%Columbia, Maryland5.4%McKinney, Texas5.2%Naperville, Illinois5.0%Fremont, California4.7%Cary, North Carolina4.1%Highlands Ranch, Colorado
Summary

Share of households with a cellular data plan and no other type of Internet subscription, for every included city. Brownsville, Texas is highest at 33.3%, then Tyler, Texas at 30.3% and Ponce, Puerto Rico at 27.3%. These households are counted in broadband of any type on some ACS lines, but they are not in the cable/fiber/DSL broadband share that ranks this page.

Figure 4

Broadband against no Internet access

No Internet access against broadband (cable, fiber or DSL) · one point per row, 346 of 346 plotted

346 items
View100%
DownloadPDFImageCSV
Broadband against no Internet accessEach point is one city of 100,000 or more, 346 in all. The horizontal axis is the cable/fiber/DSL broadband share; the vertical axis is the share with no Internet access. Cities with more broadband subscriptions generally have fewer households completely offline, but cellular-only and dial-up households sit between the two measures.0.0%5.0%10.0%15.0%20.0%25.0%30.0%40.0%50.0%60.0%70.0%80.0%90.0%100.0%No Internet accessBroadband (cable, fiber or DSL)
Summary

Each point is one city of 100,000 or more, 346 in all. The horizontal axis is the cable/fiber/DSL broadband share; the vertical axis is the share with no Internet access. Cities with more broadband subscriptions generally have fewer households completely offline, but cellular-only and dial-up households sit between the two measures.

Table 1

All cities

346 rows · 8 columns · sorted by broadband (cable, fiber or DSL), low to high

346 rows
View100%
DownloadPDFImageCSV
Summary

Broadband (cable, fiber or DSL), cellular-data-plan-only, no-Internet, household and population counts for every US city of 100,000 or more on the 2023 ACS five-year estimates. Sort any column. Margins of error are 90 percent; a dash means the ACS did not publish a sampling error.

All cities
???????
Brownsville, Texas46.7%1.7%33.3%12.9%58,518188,02390
San Juan, Puerto Rico47.9%1.2%21.5%25.2%140,592320,6911,975
Ponce, Puerto Rico50.0%1.6%27.3%16.5%45,219109,7651,858
Bayamón, Puerto Rico53.8%1.4%25.3%13.6%65,508167,3121,545
Tyler, Texas54.7%2.5%30.3%9.1%37,727107,71863
Carolina, Puerto Rico57.7%1.6%25.7%10.2%57,303139,0511,354
Elizabeth, New Jersey60.7%2.0%13.4%11.3%45,932135,88779
Detroit, Michigan61.6%0.8%17.7%13.4%253,207636,644159
Newark, New Jersey62.1%1.3%16.6%15.2%113,748307,18849
Cleveland, Ohio63.4%1.1%13.3%15.2%168,652367,52361
Memphis, Tennessee63.4%1.0%18.0%12.2%254,530629,06384
Waterbury, Connecticut63.5%2.2%14.2%14.2%45,962114,35639
Springfield, Missouri63.6%1.3%14.6%9.5%79,439169,43292
Hartford, Connecticut63.6%1.8%19.3%10.7%49,023119,97053
El Monte, California64.7%1.6%16.5%10.0%29,540107,066113
Mobile, Alabama65.8%1.5%14.2%14.2%77,587185,09752
Allentown, Pennsylvania65.9%2.2%15.0%12.2%46,039125,32053
Dayton, Ohio66.0%1.4%14.6%12.6%57,953136,74170
North Charleston, South Carolina66.0%2.2%14.4%9.6%47,528117,46080
Baltimore, Maryland66.2%0.9%14.4%11.8%250,608577,193,
Shreveport, Louisiana66.2%1.5%13.1%14.8%75,353183,48360
East Los Angeles, California66.3%1.9%15.1%13.7%30,604114,6173,058
Springfield, Illinois66.6%1.7%18.2%9.1%50,803113,714376
Paterson, New Jersey66.7%1.7%19.5%10.0%49,688157,660137
Springfield, Massachusetts66.8%1.8%14.6%12.4%58,046154,75191
Sunrise Manor, Nevada66.8%1.4%14.8%10.1%64,328199,0993,940
Salinas, California67.2%1.5%23.1%4.9%43,624161,993109
Birmingham, Alabama67.6%1.3%13.6%11.9%88,527199,322646
Beaumont, Texas67.8%1.6%18.0%10.0%44,915113,71063
Miami, Florida67.8%1.0%9.4%15.6%190,282446,66377
New Orleans, Louisiana67.8%0.9%13.7%12.7%155,060376,035,
Jackson, Mississippi67.9%1.9%18.4%9.5%61,956149,82770
Miami Gardens, Florida68.0%1.6%12.6%11.6%34,515111,264111
Rockford, Illinois68.1%1.2%13.9%11.8%61,481147,649300
South Bend, Indiana68.2%1.4%14.4%10.5%41,127102,866612
New Bedford, Massachusetts68.5%1.6%13.4%12.1%42,233100,73162
Bridgeport, Connecticut68.5%1.6%15.1%10.5%55,498148,012100
Topeka, Kansas68.6%1.4%13.2%12.4%54,303126,10343
Odessa, Texas68.6%1.9%11.8%9.8%44,987114,08049
Des Moines, Iowa68.6%1.2%15.0%8.5%90,085212,464185
Rochester, New York68.7%1.2%13.9%11.0%92,228209,720114
St. Louis, Missouri68.8%1.0%13.5%11.3%144,450293,109,
San Bernardino, California68.9%1.3%11.3%8.4%63,133221,77488
Knoxville, Tennessee69.2%1.4%11.8%11.8%84,882193,72180
Pueblo, Colorado69.6%1.3%12.8%12.1%46,106111,51451
Irving, Texas69.7%1.7%19.6%7.0%94,252255,03657
Syracuse, New York69.9%1.3%12.3%10.7%59,286146,21165
Kansas City, Kansas70.3%1.6%13.2%9.7%56,853154,77626
Waco, Texas70.5%1.8%14.0%9.0%52,980141,925137
Augusta-Richmond County consolidated government (balance), Georgia70.6%1.4%11.0%9.2%73,493201,50420
Baton Rouge, Louisiana70.6%1.3%14.6%9.6%87,607223,69958
Toledo, Ohio70.6%1.1%12.5%10.7%118,508268,46164
Tuscaloosa, Alabama70.6%1.7%12.0%9.8%40,193107,69946
Macon-Bibb County, Georgia70.7%1.1%12.0%11.4%59,681156,543,
Paradise, Nevada70.8%1.5%13.9%8.3%76,326186,1784,601
Pasadena, Texas70.9%2.0%16.8%6.3%49,791149,34559
Buffalo, New York70.9%1.3%13.0%9.9%119,548276,39765
Columbus, Georgia71.4%1.5%11.8%9.4%80,600204,383,
Milwaukee, Wisconsin71.7%0.6%11.6%11.6%231,084569,75649
El Paso, Texas71.7%0.7%12.5%9.3%242,482678,147153
Glendale, Arizona71.7%1.4%11.0%8.5%86,733250,19386
Clearwater, Florida71.9%2.1%12.0%10.5%49,909117,07558
Houston, Texas71.9%0.5%14.3%8.6%916,5362,300,419172
Peoria, Illinois71.9%1.6%13.3%7.9%48,950112,126429
Tulsa, Oklahoma72.0%0.7%14.1%8.5%171,382412,322129
Pomona, California72.1%1.7%12.4%7.3%41,827148,39154
Provo, Utah72.2%1.7%6.5%2.8%34,076114,30348
Wichita Falls, Texas72.2%1.4%11.3%9.9%38,132102,55839
Richmond, Virginia72.3%1.1%10.5%9.2%102,145227,595,
Philadelphia, Pennsylvania72.4%0.6%12.7%9.5%669,2221,582,432,
Providence, Rhode Island72.4%1.6%13.2%9.0%70,313190,21461
Norfolk, Virginia72.4%1.3%12.9%9.3%94,457235,037,
Chicago, Illinois72.5%0.4%12.0%8.6%1,146,5472,707,64872
High Point, North Carolina72.5%1.7%14.9%8.0%45,043115,26363
Indianapolis city (balance), Indiana72.5%0.7%13.7%8.0%359,665882,043878
Laredo, Texas72.6%1.5%9.5%12.5%76,259255,94941
McAllen, Texas72.7%1.4%14.1%8.0%48,268143,78956
Winston-Salem, North Carolina72.8%1.2%11.5%9.5%100,278250,88768
Brockton, Massachusetts72.8%2.5%14.3%8.7%35,610105,08050
Dallas, Texas73.0%0.6%12.8%8.6%528,0381,299,553141
Vallejo, California73.0%1.7%15.7%4.4%43,921124,63770
Independence, Missouri73.0%1.7%13.1%9.5%50,925121,94474
Louisville/Jefferson County metro government (balance), Kentucky73.0%0.8%14.4%7.6%262,740627,210145
Jacksonville, Florida73.0%0.6%14.3%7.0%384,741961,73952
Lubbock, Texas73.1%1.1%11.2%8.0%105,259261,07849
Lakeland, Florida73.2%1.6%11.3%9.3%46,339117,03064
Stockton, California73.2%1.1%13.5%7.6%98,295320,470131
Tucson, Arizona73.2%0.7%13.3%7.3%225,095543,34898
Hialeah, Florida73.2%1.1%7.6%13.8%77,294221,90167
Oklahoma City, Oklahoma73.4%0.8%13.9%7.0%275,193688,693148
Evansville, Indiana73.5%1.6%12.9%7.9%52,284116,44134
Inglewood, California73.5%1.5%13.5%6.7%35,979105,57557
Killeen, Texas73.6%1.9%14.3%7.2%59,824156,14460
Abilene, Texas73.6%1.7%14.2%7.9%46,682127,130262
Davenport, Iowa73.7%1.4%11.4%9.1%43,479101,08334
Metairie, Louisiana73.7%1.9%14.1%8.9%60,896138,9953,016
Palmdale, California73.7%1.6%14.8%5.7%46,502165,48766
Amarillo, Texas73.9%1.1%12.1%8.7%78,612200,94543
Lancaster, California74.0%1.4%13.3%6.8%52,183170,01362
Fresno, California74.0%0.9%10.9%9.1%179,684543,615107
Edinburg, Texas74.1%2.7%9.9%10.8%34,618102,56151
Fargo, North Dakota74.2%2.0%11.3%4.9%58,629129,06449
Akron, Ohio74.2%1.3%11.5%9.6%83,854189,52676
Modesto, California74.3%1.3%12.7%5.9%72,418218,61491
New York, New York74.4%0.3%13.0%8.7%3,313,3168,516,202,
Santa Ana, California74.4%1.0%12.6%8.4%79,691311,63989
Savannah, Georgia74.4%1.4%12.4%7.5%58,632147,54685
Lynn, Massachusetts74.4%1.9%11.8%9.2%36,328100,90583
Las Vegas, Nevada74.4%0.8%12.3%7.3%244,429650,873108
New Haven, Connecticut74.5%1.7%12.3%8.6%53,424132,89376
Lansing, Michigan74.5%1.6%11.4%8.6%51,129112,54666
West Palm Beach, Florida74.6%1.2%11.4%8.3%50,518119,508117
Las Cruces, New Mexico74.6%1.9%11.1%7.9%46,661112,61286
Fort Wayne, Indiana74.6%1.1%14.0%7.1%109,604266,235395
Mesquite, Texas74.7%2.4%12.8%5.6%50,362148,848473
Newport News, Virginia74.7%1.5%14.9%6.4%75,798184,774,
Wichita, Kansas74.7%0.7%13.0%7.6%157,646396,48882
Midland, Texas74.7%2.2%11.6%7.0%52,780133,99847
Albuquerque, New Mexico74.8%0.7%10.7%8.1%242,117562,488118
San Antonio, Texas74.8%0.6%12.0%7.7%547,8831,458,954118
Gainesville, Florida74.9%2.0%8.5%4.6%58,176143,61198
Worcester, Massachusetts74.9%1.4%12.2%8.6%79,089205,50174
Little Rock, Arkansas75.0%1.6%12.0%8.1%86,853202,73978
Lowell, Massachusetts75.0%2.1%11.6%10.3%42,383114,79946
Green Bay, Wisconsin75.1%1.3%11.1%8.4%44,092106,58591
Kansas City, Missouri75.2%0.8%11.2%6.9%219,486508,233121
Albany, New York75.2%1.5%10.2%9.4%43,745100,08148
Santa Maria, California75.2%2.1%11.1%7.6%29,092109,88048
Montgomery, Alabama75.3%1.2%11.1%8.2%80,540198,44040
Pompano Beach, Florida75.3%1.9%10.8%8.8%47,403112,21280
Cincinnati, Ohio75.4%1.3%10.7%8.5%142,810309,59563
Anaheim, California75.4%1.2%14.0%5.5%105,819344,553138
Urban Honolulu, Hawaii75.5%1.0%11.3%7.3%136,228346,323116
Corpus Christi, Texas75.5%1.0%11.3%8.9%118,038317,38378
Grand Rapids, Michigan75.5%1.2%11.2%8.2%79,944197,76888
Escondido, California75.5%1.5%13.2%4.2%50,658149,91383
Garland, Texas75.5%1.1%16.0%4.6%80,811245,298145
Warren, Michigan75.6%1.5%12.3%8.4%54,076138,12856
Yonkers, New York75.7%0.9%11.5%7.8%80,550209,52981
Phoenix, Arizona75.8%0.4%11.2%7.6%601,3971,624,832112
Jurupa Valley, California75.8%2.0%11.1%5.7%27,132106,24454
St. Paul, Minnesota75.9%1.0%12.2%5.9%123,067307,76248
Garden Grove, California76.0%1.3%12.6%6.6%48,650170,60385
Columbia, South Carolina76.0%2.0%9.5%9.1%51,784138,019187
College Station, Texas76.1%1.6%6.7%2.1%44,676122,28066
Reno, Nevada76.2%1.1%9.7%7.7%112,061268,959101
Bakersfield, California76.2%1.0%13.8%5.2%127,626408,36697
Brandon, Florida76.2%1.7%15.4%3.7%45,008116,3653,137
Ontario, California76.4%1.6%12.1%4.5%52,664178,34766
Downey, California76.5%1.7%12.4%4.4%34,727111,79361
Spokane Valley, Washington76.5%1.7%10.0%7.8%42,781105,46071
Lehigh Acres, Florida76.7%1.8%11.0%6.7%38,555127,3913,339
Greeley, Colorado76.7%1.8%10.2%7.1%38,901109,42162
Visalia, California76.8%2.0%10.5%7.3%46,466142,6491,065
Fort Worth, Texas76.8%0.6%11.7%6.3%334,230941,311527
Rialto, California77.0%2.2%9.4%4.9%26,856103,86660
Los Angeles, California77.0%0.3%11.7%6.5%1,419,6633,857,89775
Cedar Rapids, Iowa77.1%1.1%12.7%5.5%58,870136,85960
Grand Prairie, Texas77.1%1.3%10.7%5.8%66,943198,56492
Richmond, California77.1%1.8%13.0%5.9%40,466115,39654
Glendale, California77.1%0.8%11.5%7.6%73,179192,27067
Dearborn, Michigan77.2%1.3%11.2%5.8%36,276107,84657
Miramar, Florida77.4%1.9%11.2%6.0%44,446135,98663
North Las Vegas, Nevada77.4%0.9%11.9%5.7%85,814270,77364
Norwalk, California77.4%2.3%9.4%5.0%26,801100,71359
Victorville, California77.4%1.6%11.5%6.0%37,480135,98380
Oakland, California77.5%0.9%9.9%8.2%173,179438,07258
Hollywood, Florida77.6%1.7%11.4%6.6%60,456152,93560
Concord, North Carolina77.6%1.7%11.6%5.6%37,047106,51849
Pembroke Pines, Florida77.6%1.3%10.3%6.7%63,994170,55764
Salt Lake City, Utah77.8%1.0%11.0%4.7%88,932203,88877
Tampa, Florida77.9%0.8%11.7%5.2%160,527393,389134
Pittsburgh, Pennsylvania77.9%0.7%10.3%8.4%137,593303,62057
Elgin, Illinois77.9%2.0%11.9%4.9%38,846114,106399
Billings, Montana77.9%1.7%9.9%6.1%50,340118,32143
Long Beach, California77.9%0.7%10.8%6.1%171,309458,49171
Anchorage, Alaska78.0%1.5%14.0%4.0%107,868289,069,
Chattanooga, Tennessee78.1%1.3%9.8%7.7%77,916182,83279
West Valley City, Utah78.1%0.8%12.6%4.0%38,855137,95555
Hampton, Virginia78.1%1.5%11.5%6.6%57,740137,334,
Joliet, Illinois78.2%1.1%11.0%6.1%50,648149,785914
Greensboro, North Carolina78.3%1.0%8.9%7.7%121,189298,564102
El Cajon, California78.3%1.8%12.4%5.1%33,986104,90994
Fort Lauderdale, Florida78.4%1.0%10.2%6.4%80,575183,03256
Omaha, Nebraska78.4%0.8%10.6%6.5%199,926488,19768
Wilmington, North Carolina78.6%1.3%10.0%5.4%55,145118,57853
Moreno Valley, California78.7%1.4%12.8%3.3%54,808210,37868
Nampa, Idaho78.7%1.6%11.8%3.5%37,305106,28952
Minneapolis, Minnesota78.8%0.8%9.3%5.6%188,944426,84569
Menifee, California78.8%2.0%9.5%5.5%35,034107,02063
Fairfield, California78.9%2.0%10.4%4.5%37,955119,98550
Spokane, Washington79.0%0.8%9.7%6.4%96,602229,22874
Fayetteville, North Carolina79.1%0.9%9.2%7.6%81,499209,69287
Mesa, Arizona79.1%0.8%10.5%5.3%196,065507,47887
Denton, Texas79.1%1.7%9.2%4.4%53,983146,98768
Salem, Oregon79.1%1.5%10.4%5.7%67,028176,66696
Tallahassee, Florida79.1%1.1%9.8%5.3%83,637199,696118
Atlanta, Georgia79.1%0.8%9.2%6.4%231,504499,28790
Athens-Clarke County unified government (balance), Georgia79.2%1.5%8.9%5.0%53,397126,987688
Chesapeake, Virginia79.2%1.4%10.8%5.8%92,361251,153,
Tacoma, Washington79.2%1.0%11.1%5.6%91,612220,48273
Lexington-Fayette urban county, Kentucky79.2%0.8%9.8%5.0%137,803321,122,
Arlington, Texas79.3%1.0%9.9%5.5%140,408394,769103
Spring Valley, Nevada79.3%1.1%10.2%6.1%87,275219,9135,139
Rio Rancho, New Mexico79.4%2.1%8.3%4.4%39,192106,53372
West Covina, California79.4%1.8%9.3%6.4%32,586107,43676
Lafayette, Louisiana79.4%1.9%10.4%7.2%52,480121,53775
Norman, Oklahoma79.4%1.7%8.4%5.4%51,489128,71476
Sacramento, California79.5%0.8%10.5%5.1%199,401524,802252
Sterling Heights, Michigan79.5%1.3%12.0%5.1%51,407133,47373
Washington, District of Columbia79.6%0.6%8.9%6.8%321,556672,079,
Orlando, Florida79.6%1.0%9.5%5.4%126,665311,732141
Nashville-Davidson metropolitan government (balance), Tennessee79.6%0.6%9.6%6.5%303,539684,29877
Cape Coral, Florida79.6%0.9%10.9%5.1%79,258206,38742
Jersey City, New Jersey79.7%1.0%11.2%6.5%123,132289,69157
Eugene, Oregon79.8%1.4%9.3%3.7%76,140177,52070
Surprise, Arizona79.8%1.2%11.9%3.1%54,442149,51964
Gresham, Oregon79.9%1.8%8.8%6.6%42,061112,81858
Costa Mesa, California79.9%1.0%12.4%2.9%41,628110,53883
Charleston, South Carolina79.9%1.2%9.3%5.4%66,408152,01477
Manchester, New Hampshire80.0%1.3%9.3%7.2%49,546115,41561
Huntsville, Alabama80.0%1.3%8.4%6.2%94,058218,81461
San Buenaventura (Ventura), California80.0%1.6%9.3%4.6%42,119109,90062
Pasadena, California80.1%1.2%9.7%5.7%57,131136,46263
Fullerton, California80.1%0.9%11.0%3.7%47,484141,27865
Boston, Massachusetts80.1%0.7%9.0%7.0%279,216663,97276
Aurora, Colorado80.2%0.8%10.6%4.2%143,179390,201117
Sparks, Nevada80.4%1.1%9.1%4.5%41,331109,10675
Palm Bay, Florida80.5%1.9%8.5%6.5%44,432125,273104
Hesperia, California80.5%1.1%9.7%4.2%29,215100,14144
Chico, California80.6%1.5%10.0%4.3%41,934102,03257
Antioch, California80.7%1.4%10.7%3.1%37,042115,759110
Vancouver, Washington80.7%1.1%9.1%5.7%79,747192,696110
Everett, Washington80.7%1.9%8.9%5.7%44,255111,08380
St. Petersburg, Florida80.9%1.0%9.7%5.4%116,772260,64654
Rochester, Minnesota80.9%1.4%8.3%4.2%50,658121,63872
Murfreesboro, Tennessee80.9%1.6%10.5%4.3%58,567157,54753
Alexandria, Virginia80.9%1.2%10.6%4.7%75,349156,788,
Corona, California81.0%1.1%7.4%5.6%48,083158,83997
Clovis, California81.1%0.8%10.2%4.1%41,080122,71969
Oxnard, California81.1%1.0%7.8%7.4%51,798201,01462
Orange, California81.2%1.3%10.8%3.1%44,867138,72368
Tempe, Arizona81.3%1.6%9.8%3.0%77,053186,41981
Boise City, Idaho81.3%1.3%9.7%3.7%99,616235,70154
Columbia, Missouri81.4%1.8%6.1%4.2%51,381127,20064
Rancho Cucamonga, California81.4%1.3%9.3%3.6%57,945174,69383
Riverside, California81.4%0.8%9.4%4.5%92,368316,241115
Hayward, California81.6%1.3%9.8%4.7%49,470159,20169
Spring Hill, Florida81.7%1.6%9.0%4.7%44,985118,8142,310
Sioux Falls, South Dakota81.7%0.8%9.2%4.5%82,836197,64266
Lincoln, Nebraska81.8%0.7%8.2%4.6%120,698291,93271
Denver, Colorado81.8%0.5%8.1%4.3%329,578713,734,
Columbus, Ohio82.0%0.6%9.0%5.5%386,581906,480134
Stamford, Connecticut82.0%1.3%9.6%4.7%54,165135,80640
Aurora, Illinois82.0%1.3%7.0%6.5%60,396179,867480
Chula Vista, California82.2%0.9%10.0%4.4%85,193275,03061
Charlotte, North Carolina82.3%0.5%8.4%5.6%361,100886,283226
Kent, Washington82.3%1.5%11.3%3.4%46,727135,01573
San Francisco, California82.4%0.6%8.2%5.2%362,650836,321,
Durham, North Carolina82.4%1.4%8.8%4.6%123,318288,465163
South Fulton, Georgia82.4%2.4%9.6%3.9%39,519109,15751
Carrollton, Texas82.5%1.0%10.0%3.5%51,059132,741170
Peoria, Arizona82.6%0.9%8.3%3.9%73,165194,338207
Daly City, California82.6%1.8%9.8%5.0%32,225102,56052
Madison, Wisconsin82.7%1.1%6.8%3.2%125,787275,56876
Portland, Oregon82.7%0.6%9.0%4.2%287,030642,715699
Quincy, Massachusetts82.8%1.1%9.4%5.0%45,571101,36135
Renton, Washington82.9%1.5%9.7%3.9%41,251105,27970
Concord, California82.9%1.4%9.9%3.2%45,635124,26042
Oceanside, California82.9%0.7%9.4%3.7%61,417172,54276
Santa Rosa, California82.9%1.2%8.7%3.7%68,234177,21654
Austin, Texas82.9%0.6%7.9%4.6%440,294967,862373
Broken Arrow, Oklahoma83.0%0.8%8.8%4.4%43,634115,91985
Fontana, California83.0%1.1%8.8%2.6%57,111211,92198
Lewisville, Texas83.1%1.7%10.6%2.2%50,147128,313470
Henderson, Nevada83.2%0.8%8.2%4.1%127,507324,52351
Thousand Oaks, California83.2%1.2%7.9%4.2%46,268125,67660
San Tan Valley, Arizona83.3%1.8%8.9%1.9%33,646105,2312,932
Clarksville, Tennessee83.3%1.2%7.3%4.5%64,863171,89751
Raleigh, North Carolina83.5%0.8%7.8%3.8%196,924470,763429
Fort Collins, Colorado83.6%1.2%6.1%2.5%70,782169,70563
Simi Valley, California83.7%1.1%8.3%4.3%44,355125,76977
Colorado Springs, Colorado83.7%0.8%8.3%4.2%198,070483,09979
San Diego, California83.8%0.5%8.9%3.9%522,1461,385,061147
Port St. Lucie, Florida83.9%1.4%7.7%3.7%79,185220,45373
Lakewood, Colorado83.9%1.3%7.3%4.8%69,296156,309154
Westminster, Colorado84.0%1.1%7.5%4.5%47,995115,54683
West Jordan, Utah84.2%1.4%9.2%1.6%36,295116,27773
Roseville, California84.3%0.9%7.6%3.5%57,921152,43880
Bend, Oregon84.3%1.6%8.0%3.8%43,278101,47276
San Jose, California84.4%0.5%8.0%3.8%326,767990,054201
Burbank, California84.4%1.1%6.6%5.9%43,066105,16581
Virginia Beach, Virginia84.5%0.8%8.1%4.1%179,800457,066,
Vacaville, California84.6%1.4%7.8%3.5%34,401102,08563
Thornton, Colorado84.7%1.5%8.5%2.7%49,579142,87877
Huntington Beach, California84.7%1.0%8.6%3.4%77,549196,01078
Santa Clarita, California84.8%1.1%8.5%2.5%75,281229,02197
Torrance, California84.9%1.3%7.8%3.6%55,317143,49965
Arvada, Colorado85.1%1.2%8.5%3.5%49,766122,83566
San Mateo, California85.3%1.4%8.6%3.7%39,760103,55558
Enterprise, Nevada85.4%1.2%8.0%2.6%82,039232,0435,278
Seattle, Washington85.6%0.5%6.9%3.4%353,019741,440121
Cambridge, Massachusetts85.7%1.3%6.5%3.1%49,592117,79460
Goodyear, Arizona85.8%1.3%8.3%1.9%35,839102,89162
Davie, Florida85.9%1.6%7.0%4.5%38,377106,41262
Ann Arbor, Michigan85.9%0.7%6.3%2.0%49,907121,17950
Boulder, Colorado86.0%1.3%7.1%2.3%43,825106,27449
Lee's Summit, Missouri86.1%1.1%7.4%2.5%39,531102,58351
Berkeley, California86.1%1.4%6.6%3.5%46,762120,22350
Hillsboro, Oregon86.1%1.8%7.5%2.0%41,304107,05043
Sandy Springs, Georgia86.1%1.6%6.3%3.2%52,035107,19840
Coral Springs, Florida86.2%1.8%6.3%3.1%44,659133,96264
Richardson, Texas86.2%2.0%6.4%2.5%45,444118,26991
Riverview, Florida86.4%1.8%9.5%1.8%38,144107,7763,794
Elk Grove, California86.4%1.2%7.5%2.2%54,707177,221134
Arlington, Virginia86.4%1.0%7.3%3.4%111,530235,463,
Meridian, Idaho86.6%1.3%6.1%2.4%45,486124,86575
Chandler, Arizona86.7%0.9%6.8%2.9%105,867278,12377
Scottsdale, Arizona86.8%0.6%7.1%3.0%117,787242,169118
Olathe, Kansas86.9%0.9%7.3%2.8%51,985143,72063
Murrieta, California87.0%0.8%7.0%3.0%35,452111,62163
Fishers, Indiana87.2%1.9%8.0%1.3%36,680100,91835
McKinney, Texas87.2%1.1%5.4%4.2%70,787202,31465
League City, Texas87.2%1.3%6.8%2.3%42,827114,885119
Round Rock, Texas87.5%1.5%6.7%3.1%46,764124,288898
Overland Park, Kansas87.6%0.7%6.9%2.8%82,965197,19994
Irvine, California87.6%0.6%6.7%1.8%111,979308,160117
Carlsbad, California87.7%1.4%5.9%2.7%43,981114,50085
Santa Clara, California87.8%1.4%6.3%2.8%48,601129,23965
Temecula, California87.9%1.6%6.4%2.0%35,423110,40464
Plano, Texas88.5%1.1%6.6%1.9%110,522287,33974
Sugar Land, Texas88.6%1.2%7.1%1.4%37,830109,73564
Carmel, Indiana88.9%1.3%6.6%1.8%38,160100,501198
Pearland, Texas89.0%1.3%5.9%1.4%43,526125,98375
Centennial, Colorado89.1%0.9%5.5%2.0%41,518107,38670
The Woodlands, Texas89.3%1.3%5.7%2.0%42,657116,9165,154
Sunnyvale, California89.3%1.4%6.0%2.4%58,791153,45592
Columbia, Maryland89.5%1.2%5.5%3.2%41,218105,8712,631
Fremont, California89.7%0.9%5.0%3.1%77,019228,51857
Gilbert, Arizona89.7%0.8%5.5%1.8%91,712271,118101
Allen, Texas89.8%1.5%6.1%2.1%36,307107,68444
Bellevue, Washington90.1%0.6%5.5%1.7%61,433151,19961
Naperville, Illinois90.4%1.2%5.2%1.5%54,286149,424393
Cary, North Carolina90.4%0.5%4.7%1.7%67,964176,686139
Frisco, Texas91.2%1.2%5.5%1.4%74,081210,238162
Highlands Ranch, Colorado92.4%1.1%4.1%1.3%38,076101,4372,176

Image files

Download all

Figure 1

Broadband Internet, US cities
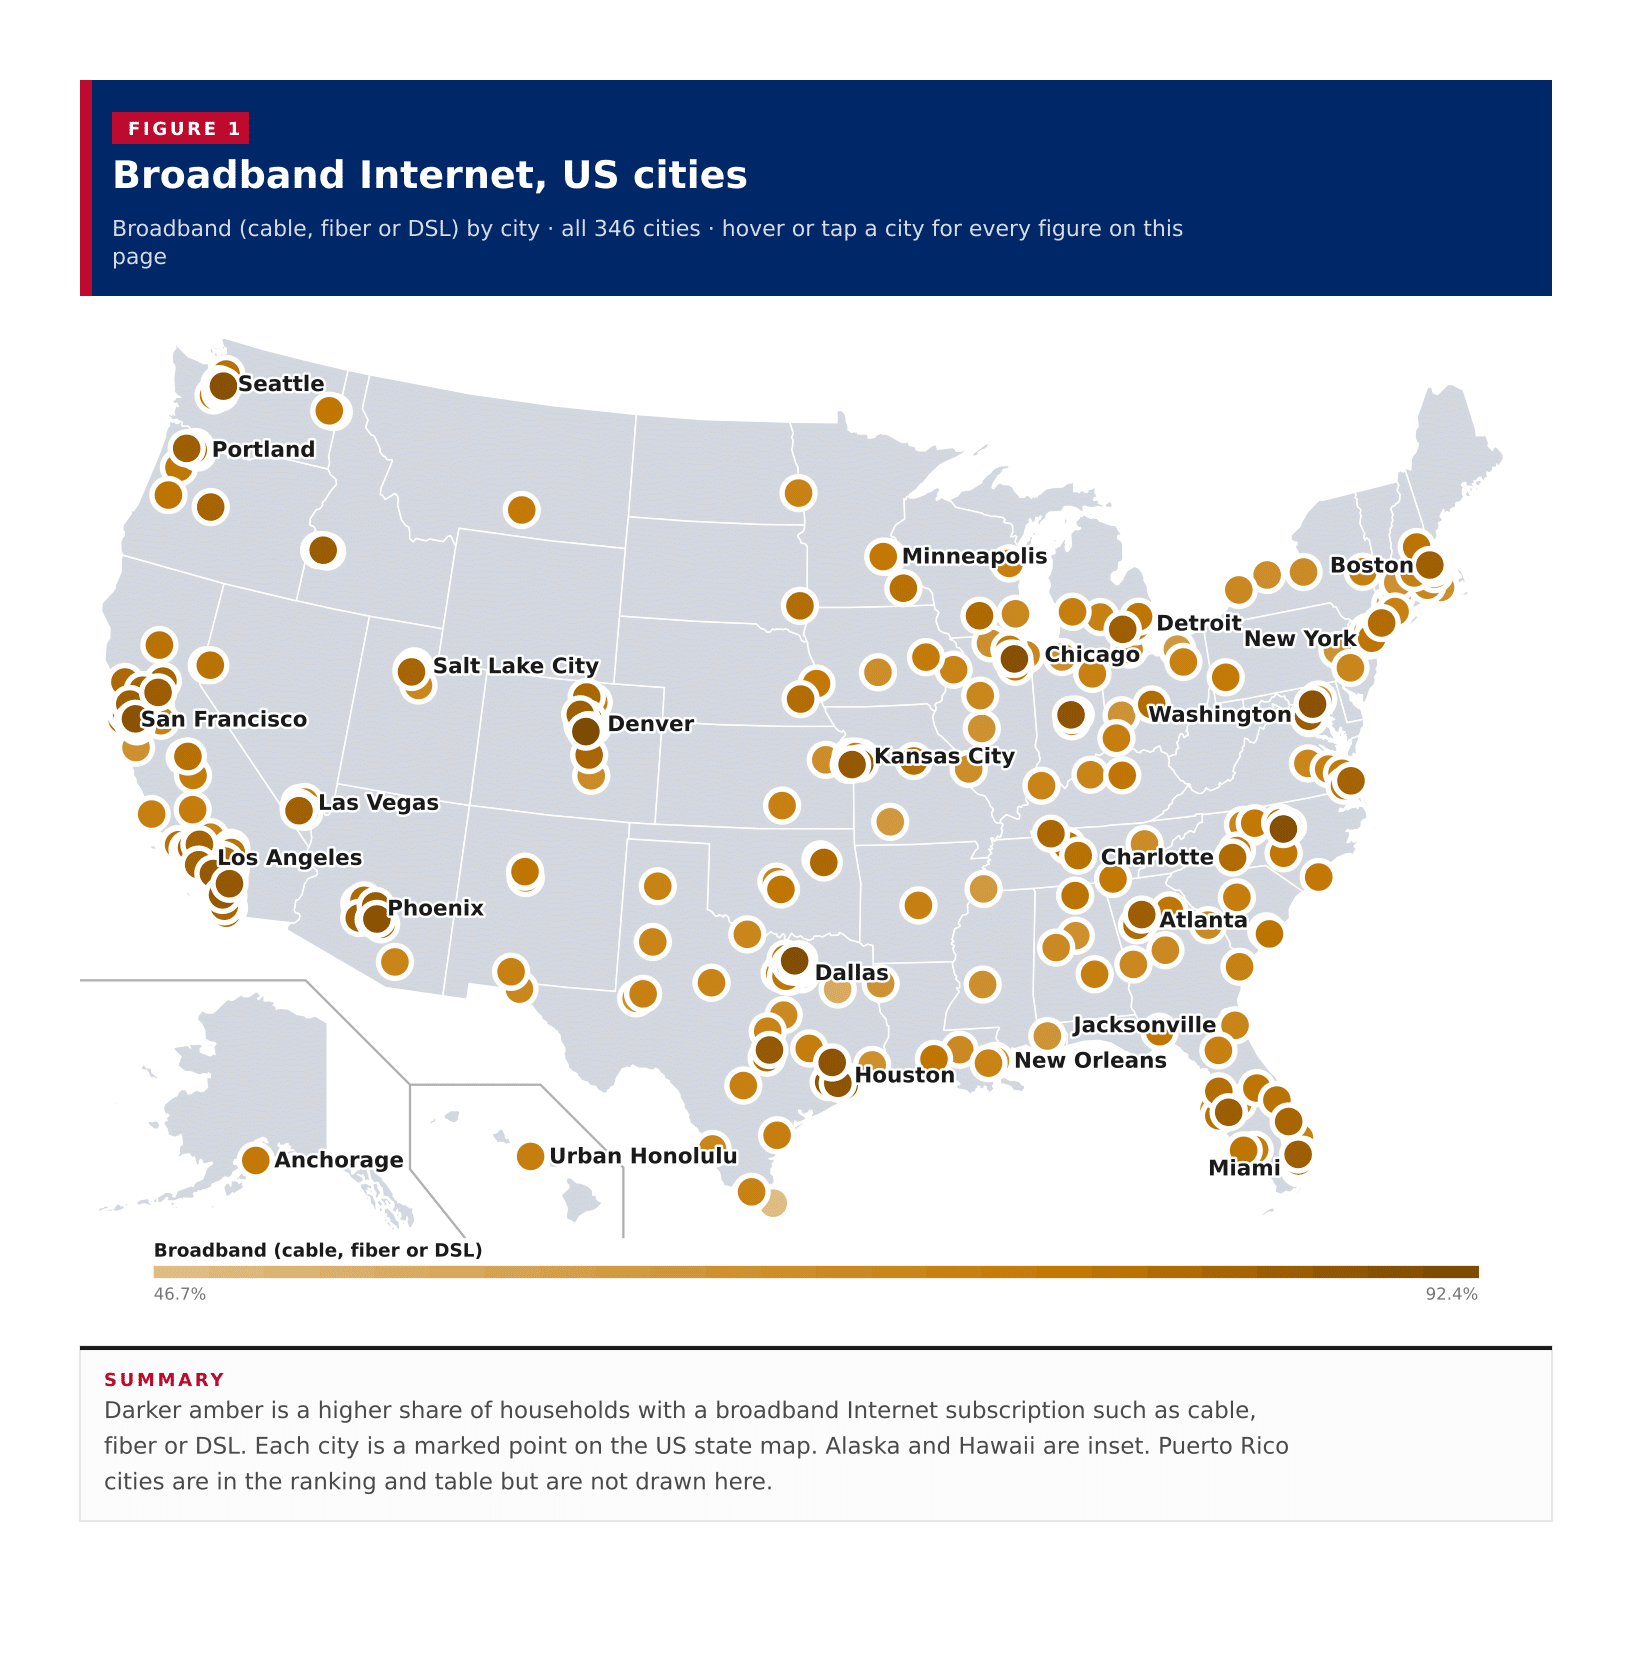
Figure 1: Broadband Internet, US cities
DownloadPDFImageCSV

Figure 2

Broadband Internet, all published cities

Figure 2: Broadband Internet, all published cities
DownloadPDFImageCSV

Figure 3

No Internet access, all published cities

Figure 3: No Internet access, all published cities
DownloadPDFImageCSV

Figure 4

Cellular data plan only, all published cities

Figure 4: Cellular data plan only, all published cities
DownloadPDFImageCSV

Figure 5

Broadband against no Internet access

Figure 5: Broadband against no Internet access
DownloadPDFImageCSV

About this data

  • A city is included when the ACS published at least 100,000 residents in the 2023 five-year estimates. Smaller places are left out.
  • Each share is of occupied households in that city on ACS table B28002, not a count of people. Broadband here is the cable, fiber optic or DSL line (B28002_007), recomputed as a share of total households (B28002_001).
  • Cellular data plan only is households with a cellular data plan and no other type of Internet subscription (B28002_006). No Internet access is B28002_013. Ranking on this page uses the cable/fiber/DSL broadband share, not broadband of any type.
  • A midpoint of city shares is not a United States Internet rate. Cities have different numbers of households, so these percentages cannot be averaged to produce a national figure.
  • The map covers the 48 contiguous states. Cities in Alaska, Hawaii and Puerto Rico stay in the ranking and table.
  • For 20 city estimates the ACS does not publish a sampling margin of error (code *****): the figure is controlled, so a sampling error is not applicable. Those cells are shown as a dash, not as −555,555,555.